Measured Sensitivity of the First Mark II Phased Array Feed on an ASKAP Antenna
Abstract
This paper presents the measured sensitivity of CSIRO’s first Mk. II phased array feed (PAF) on an ASKAP antenna. The Mk. II achieves a minimum system-temperature-over-efficiency of 78 K at 1.23 GHz and is 95 K or better from 835 MHz to 1.8 GHz. This PAF was designed for the Australian SKA Pathfinder telescope to demonstrate fast astronomical surveys with a wide field of view for the Square Kilometre Array (SKA).
1 INTRODUCTION
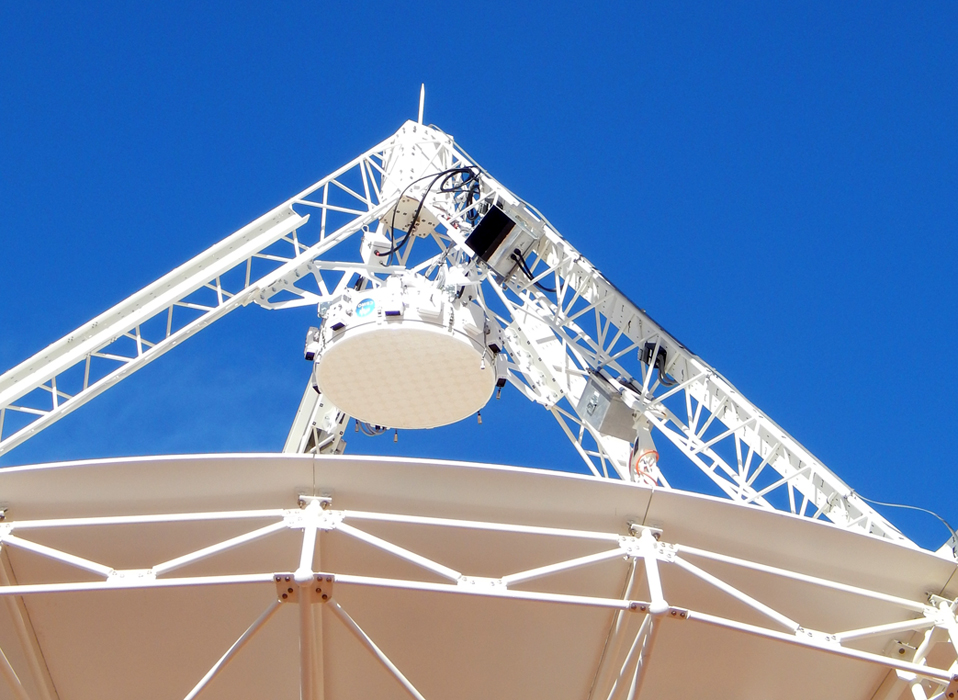
We present preliminary measurements of the sensitivity of CSIRO’s first Mk. II phased array feed (PAF) [1] on an ASKAP antenna as shown in Figure 1. Over the next two years, Mk. II PAFs will be installed on thirty 12 m parabolic reflectors of the Australian SKA Pathfinder telescope (ASKAP) [2] to demonstrate fast astronomical surveys with a wide field of view for the Square Kilometre Array (SKA). The SKA is an international project to build the world’s largest radio telescope with a square kilometre of collecting area [3].
Figure 2 shows that the Mk. II achieves a minimum system-temperature-over-efficiency of 78 K at 1.23 GHz and is 95 K or better from 835 MHz to 1.8 GHz with the receiver near room temperature. By comparison, the CSIRO Mk. I PAF is 95 K or better only from 735 MHz to 1.2 GHz [4]. This significant improvement was achieved via enhanced antenna array and low-noise amplifier (LNA) designs [5]. Both Mk. I and Mk. II ASKAP PAFs are based on a connected-element “chequerboard” array [6] that is dual-polarized, low-profile, and inherently wide-band.
The only other PAF being built in comparable numbers to the ASKAP PAFs is ASTRON’s APERTIF PAF for 12 antennas of the Westerbork Synthesis Radio Telescope. It is specified for K over 1.13 GHz to 1.75 GHz [7]. Next steps to improve PAF sensitivity include the adoption of lower-noise transistors [8] and cryogenically cooling PAFs as recently demonstrated on the Green Bank Telescope [9].
2 MEASUREMENT SYSTEM
Figure 1 shows the prototype Mk. II PAF installed on ASKAP antenna 29 at the Murchison Radio-astronomy Observatory (MRO) in Western Australia. Antenna 29 is cabled so a receiver can be tested as a PAF at the antenna’s focus or as an aperture array on the ground nearby.
Radio-frequency (RF) signals from each of the 188 “chequerboard” ports are modulated onto optical fibre links within the PAF package. The RF signals then travel over 1.4 km of optical fibre to the digital receiver in the ASKAP control building.
The ASKAP digital receiver [10] directly samples 192 signals (188 from the PAF and 4 spare) and then uses an oversampled poly-phase filter bank [11] to divide these signals into 1 MHz channels. Each directly-sampled band has approximately 600 MHz RF bandwidth, but only 384 MHz are passed to the beamformer in the current configuration. A particular contiguous 384 MHz sub-band is selected for beamforming via a software command to set the centre frequency.
ASKAP’s beamformer [12] includes a firmware Array Covariance Matrix (ACM) module to calculate the receiver-output sample covariance matrix
| (1) |
where is the time sample of the column vector of 192 complex array-port voltages for a single 1 MHz coarse filter bank (CFB) channel. Rather than using the online firmware beamformer, we downloaded the ACM output and calculated beamformed power for weight vector by
| (2) |
This allows offline experimentation with arbitrary beamformer weights.
3 SENSITIVITY MEASUREMENTS
We deduce the on-dish noise performance of the ASKAP PAF from the Y-factor power ratio between measurements of a standard astronomical source and nearby empty sky [13, 14]. The Y-factor and therefore the telescope sensitivity are a function of the beamformer weights
| (3) |
Here we measure beamformed power towards an astronomical source of known flux and towards nearby empty sky.
| Band | Sampled | Digtal Centre | Beamformer | Observation | Elevation | |
| RF Band | Frequency | Band | UTC Epoch | Tau A | off-source | |
| (MHz) | (MHz) | (MHz) | (yyyymmddhhmmss) | (deg) | (deg) | |
| 1 | 700-1200 | 891 | 700-1083 | 20140909210010 | 37.2 | 34.5 |
| 2 | 840-1440 | 1249 | 1058-1441 | 20140911203019 | 34.5 | 31.7 |
| 3 | 1400-1800 | 1608 | 1417-1800 | 20140911215449 | 41.0 | 40.0 |
| 4 | 600-700 | 575 | 384-767 | measurement pending | ||
The ratio of system temperature to antenna efficiency is then given by [13]
| (4) |
where is the geometric antenna (reflector) area, is the known flux of the reference source and is Boltzmann’s constant. Antenna efficiency is defined by , the product of aperture efficiency and radiation efficiency. The efficiencies and system noise temperature of receiving arrays are more fully defined in [15]. They both depend on the beamformer weights as can be implied from equations (3) and (4).
Equation (4) shows that is minimised by maximising . Rearranging (3) reveals an eigenvalue problem
| (5) |
Maximum beamformed Y-factor corresponds to the dominant eigenvalue of and is achieved with beamformer weights set to the dominant eigenvector [14]. In this work we included all ports of both polarizations in the beamformer weight solution by using the full matrix when solving equation (5). Figure 2 shows the resulting sensitivity for the beam corresponding to the strongest of two dominant eigenvalues. This should be the overall best-case maximum sensitivity beam, but its polarization will be biased by any polarization in the signal field (calibrator) or noise fields (eg. spillover and receiver noise).
Table 1 summarises the measurements made for this work. On and off-source measurements were made in three of ASKAP’s RF bands over two days in September 2014. The off-source position was a offset in right ascension. We used Taurus A as the flux reference assuming the flux model of [16]. Tau A is 0.5% and 3.5% polarized at wavelengths of 20 cm and 30 cm respectively [17].
Care should be taken when comparing our measurements to those from the northern hemisphere using Cas A as the flux reference. The strength of Cas A is evolving non-uniformly with time [18]. This necessitates ongoing monitoring of flux calibration sources concurrent with their use to measure the sensitivity of new telescope receivers [19].
Single-dish beamforming with a PAF on a 12 m reflector antenna in the southern hemisphere is challenging as Tau A, the strongest available unresolved source, has a flux of 980 Jy at 1.25 GHz. This is weaker than the system equivalent flux density of 2,000 Jy at the same frequency. Most single-dish beamforming for the Mk. I BETA PAFs has been performed using the Sun, which although slightly resolved by a 12 m reflector antenna, provides a much higher signal-to-noise ratio () of order 100 to 1,000 [4]. In this work we have for the first time successfully beamformed on a single 12 m ASKAP antenna with an instantaneous less than unity. This is important for commissioning, but we expect the full ASKAP to make high beamforming solutions via interferometry [20, 13].
We also measured aperture-array sensitivity via the method of [21] and found a beam equivalent system noise temperature referenced to the sky of K from 800 MHz to 1.7 GHz. Beamformer weights and spillover differ between aperture array measurement of and on-dish measurement of . Measuring efficiency is not as simple as dividing one by the other.
4 CONCLUSION
Our measurement for the first Mk. II PAF shows a doubling of low-noise bandwidth over the Mk. I PAF results in [4]. Above 1.4 GHz, sensitivity has been doubled and survey speed should be quadrupled. The Mk. II PAF has operated reliably at the MRO and near continuously since it was installed on antenna 29 in September 2014. This has included numerous summer weeks with maximum daily site temperatures regularly exceeding 40.
Acknowledgements
The Australian SKA Pathfinder is part of the Australia Telescope National Facility which is funded by the Commonwealth of Australia for operation as a National Facility managed by CSIRO. This scientific work uses data obtained from the Murchison Radio-astronomy Observatory (MRO), which is jointly funded by the Commonwealth Government of Australia and State Government of Western Australia. The MRO is managed by the CSIRO, who also provide operational support to ASKAP. We acknowledge the Wajarri Yamatji people as the traditional owners of the Observatory site.
Creating the Mk. II ASKAP PAF was a large team effort conceived and lead by Grant Hampson. Project management included Adam Macleod, Adrian Rispler and Ant Schinckel. John Bunton provided key concepts and critical specifications across the system as ASKAP project engineer.
The prototype team included Aaron Chippendale (leader), Ron Beresford, Andrew Brown, Steve Broadhurst, Michael Brothers, Chris Cantrall, Warren Chandler, David Chandler, Paul Doherty, Ross Forsyth, Dezso Kiraly, Jeganathan Kanapathippillai, Mark Leach, Neale Morison and Paul Roberts. The firmware team included Andrew Brown (leader), Stephan Neuhold (manager), John Tuthill, Tim Bateman, Craig Haskins and John Bunton. The production team included Steve Barker (leader), Matthew Shields (project engineer), Alan Ng, Andrew Ng, Aaron Sanders, Raji Chekkala, Dezso Kiraly, Wan Cheng and Neale Morison. Electromagnetic designers and validators included Stuart Hay, Robert Shaw, Doug Hayman and Russell Gough.
The Marsfield Workshop supported the prototype work, in particular Paul Cooper, Michael Bourne, Minh Hyunh, Raymond Moncay and Michael Death. Additional assistance was given to the prototype work by Santiago Castillo, Yoon Chung, Daniel Gain, Li Li, Simon Mackay and Les Reilly. Deployment to the MRO and on-site testing was supported by Suzy Jackson, Michael Reay, John Morris, Lou Puls, Ryan McConigley, Shaun Amy, Aidan Hotan and John Reynolds.
References
- Hampson et al. [2012] G. Hampson et al. ASKAP PAF ADE – advancing an L-band PAF design towards SKA. In Electromagnetics in Advanced Applications (ICEAA), 2012 International Conference on, pages 807–809, Sept 2012.
- DeBoer et al. [2009] D. R. DeBoer et al. Australian SKA pathfinder: A high-dynamic range wide-field of view survey telescope. Proc. IEEE, 97(8):1507–1521, Aug 2009.
- Dewdney et al. [2009] P. E. Dewdney, P. J. Hall, R. T. Schilizzi, and T. J. L. W. Lazio. The Square Kilometre Array. Proc. IEEE, 97(8):1482–1496, Aug 2009.
- Hotan et al. [2014] A. W. Hotan et al. The Australian Square Kilometre Array Pathfinder: System architecture and specifications of the Boolardy Engineering Test Array. Proc. Astron. Soc. Aust., 31:e041, Jan 2014.
- Shaw et al. [2012] R. D. Shaw, S. G. Hay, and Y. Ranga. Development of a low-noise active balun for a dual-polarized planar connected array antenna for ASKAP. In Electromagnetics in Advanced Applications (ICEAA), 2012 International Conference on, pages 438–441, Sept 2012.
- Hay and O’Sullivan [2008] S. G. Hay and J. D. O’Sullivan. Analysis of common-mode effects in a dual-polarized planar connected-array antenna. Radio Sci., 43(6), Dec 2008.
- van Cappellen and bij de Vaate [2014] W. A. van Cappellen and J. G. bij de Vaate. Status update on APERTIF, phased array feeds for the Westerbork radio telescope. In General Assembly and Scientific Symposium (URSI GASS), 2014 XXXIth URSI, pages 1–4, Aug 2014.
- Shaw and Hay [2015] R. Shaw and S. Hay. Transistor Noise Characterization for an SKA Low-Noise Amplifier. In European Conference on Antennas and Propagation (EuCAP), Lisbon, Portugal, Apr 2015.
- Roshi et al. [2015] D. A. Roshi et al. A 19 element cryogenic phased array feed for the Green Bank Telescope. In IEEE International Symposium on Antennas and Propagation, Vancouver, BC, Canada, July 2015. Forthcoming.
- Brown et al. [2014] A. J. Brown et al. Design and implementation of the 2 generation ASKAP digital receiver system. In Electromagnetics in Advanced Applications (ICEAA), 2014 International Conference on, pages 268–271, Aug 2014.
- Tuthill et al. [2012] J. Tuthill et al. Development of multi-stage filter banks for ASKAP. In Electromagnetics in Advanced Applications (ICEAA), 2012 International Conference on, pages 1067–1070, Sept 2012.
- A. et al. [2014] Hampson G. A. et al. ASKAP Redback-3 – an agile digital signal processing platform. In General Assembly and Scientific Symposium (URSI GASS), 2014 XXXIth URSI, pages 1–4, Aug 2014.
- Hayman et al. [2010] D. B. Hayman, T. S. Bird, K. P. Esselle, and P. J. Hall. Experimental demonstration of focal plane array beamforming in a prototype radiotelescope. IEEE Trans. Antennas Propag., 58(6):1922–1934, June 2010.
- Landon et al. [2010] J. Landon et al. Phased Array Feed Calibration, Beamforming, and Imaging. Astron. J., 139:1154–1167, Mar 2010.
- Warnick et al. [2010] Karl F. Warnick, M.V. Ivashina, R. Maaskant, and B. Woestenburg. Unified definitions of efficiencies and system noise temperature for receiving antenna arrays. IEEE Trans. Antennas Propag., 58(6):2121–2125, June 2010.
- Baars et al. [1977] J. W. M. Baars et al. The absolute spectrum of CAS A - an accurate flux density scale and a set of secondary calibrators. Astron. Astrophys., 61:99–106, Oct 1977.
- Kuz’min and Salomonovich [1966] A. D. Kuz’min and A. E. Salomonovich. Radioastronomical Methods of Antenna Measurements. Electrical Science Series. Academic Press, New York, 1966.
- Vinyajkin [1997] E. N. Vinyajkin. Secular Decrease and Random Variations of the Flux Density of CAS A at 927, 290, 151.5, and 38 MHz from Long-Term Measurements. Astrophys. Space. Sci., 252:249–257, Mar 1997.
- Kraus et al. [2015] A. Kraus, U. Bach, A. Jessner, and B. Winkel. Checking the base of the flux density calibration scale. In URSI Atlantic Radio Science Conference, Gran Canaria, Spain, May 2015.
- Chippendale et al. [2010] A. P. Chippendale et al. Phased array feed testing for astronomy with ASKAP. In Phased Array Systems and Technology (ARRAY), 2010 IEEE International Symposium on, pages 648–652, Oct 2010.
- Chippendale et al. [2014] A. P. Chippendale, D. B. Hayman, and S. G. Hay. Measuring Noise Temperatures of Phased-Array Antennas for Astronomy at CSIRO. Proc. Astron. Soc. Aust., 31:e019, Mar 2014.