Relaxation dynamics of functionalized colloids on attractive substrates
Abstract
Particle-based simulations are performed to study the post-relaxation dynamics of functionalized (patchy) colloids adsorbed on an attractive substrate. Kinetically arrested structures that depend on the number of adsorbed particles and the strength of the particle-particle and particle-substrate interactions are identified. The radial distribution function is characterized by a sequence of peaks, with relative intensities that depend on the number of adsorbed particles. The first-layer coverage is a non-monotonic function of the number of particles, with an optimal value around one layer of adsorbed particles. The initial relaxation towards these structures is characterized by a fast (exponential) and a slow (power-law) dynamics. The fast relaxation timescale is a linearly increasing function of the number of adsorbed particles in the submonolayer regime, but it saturates for more than one adsorbed layer. The slow dynamics exhibits two characteristic exponents, depending on the surface coverage.
I Introduction
Large-scale production of materials with enhanced physical properties from the self-organization of colloidal particles is believed to set the stage for a revolution in materials engineering Zhang et al. (2015); Paulson et al. (2015); Lu and Weitz (2013); Duguet et al. (2011); Hu et al. (2012); Kretzschmar and Song (2011); Sacanna and Pine (2011); Solomon (2011); Pawar and Kretzschmar (2010); Bianchi et al. (2011); Sacanna et al. (2013); Manoharan (2015). There has been a sustained effort towards finding design rules to obtain the desired structures through the control of the experimental conditions and the particle-particle interactions. One promising route is to promote the aggregation of anisotropic colloidal particles on an attractive substrate Iwashita and Kimura (2014, 2013); van Oostrum et al. (2015). However, the feasibility of the target structures is deeply compromised by the kinetic pathways of aggregation and post-relaxation. In this work, we study the kinetics of relaxation of patchy particles on a flat substrate.
Patchy particles usually refer to spherical colloids with a chemical decoration (patches) on their surface. The idea is to control the directionality and strength of the particle-particle interaction, the maximum valence of the colloid, and the local structure of the aggregates. The functionalization of the patches can be obtained using, for example, DNA, polymers, or enzymes James et al. (2015); Peng et al. (2014); Wilner and Willner (2012); Rogers and Manoharan (2015); Geerts and Eiser (2010). This type of functionalization allows a very detailed control on of colloidal valence, strength, and selectivity of the colloidal bonds. During self-assembly, the chemical nature (or strength) of the patch-patch interaction leads to large energy barriers impeding the formation of equilibrium structures, promoting kinetically trapped structures, such as gels, glasses or polycrystals Bianchi et al. (2013); Khan et al. (2015); Guo et al. (2014); Markova et al. (2014); Vasilyev et al. (2013); Zhang et al. (2015). One route to control the assembly of non-equilibrium structures is the use of flat or patterned substrates Araújo et al. (2008); Cadilhe et al. (2006); Eskandari et al. (2014); Silvestre et al. (2014). Recent studies of self-assembly of patchy particles on substrates have focused on the thermodynamic structures Bernardino and Telo da Gama (2012); Kalyuzhnyi et al. (2015); Sokolowski and Kalyuzhnyi (2014); Pizio et al. (2014); Rzysko et al. (2015) or on the fully irreversible regime Dias et al. (2013, 2014, 2014); Araújo et al. (2015). Here, we study the relaxation dynamics on the substrate and how it depends on the number of adsorbed particles and the strength of the particle-substrate interaction. This article is organized in the following way. In the next section, the model and the simulation parameters are described. Results are discussed in Sec. III and in Sec. IV we draw some conclusions.
II Model and Numerical Simulations
We consider a three dimensional system of spherical colloidal particles with three patches distributed along the equator, with an opening angle of . Colloidal particles are represented by a core of mass and three patches at a distance from the center. The particles representing the patches are of zero diameter and mass . Their relative position to the center of the core is fixed at all times.
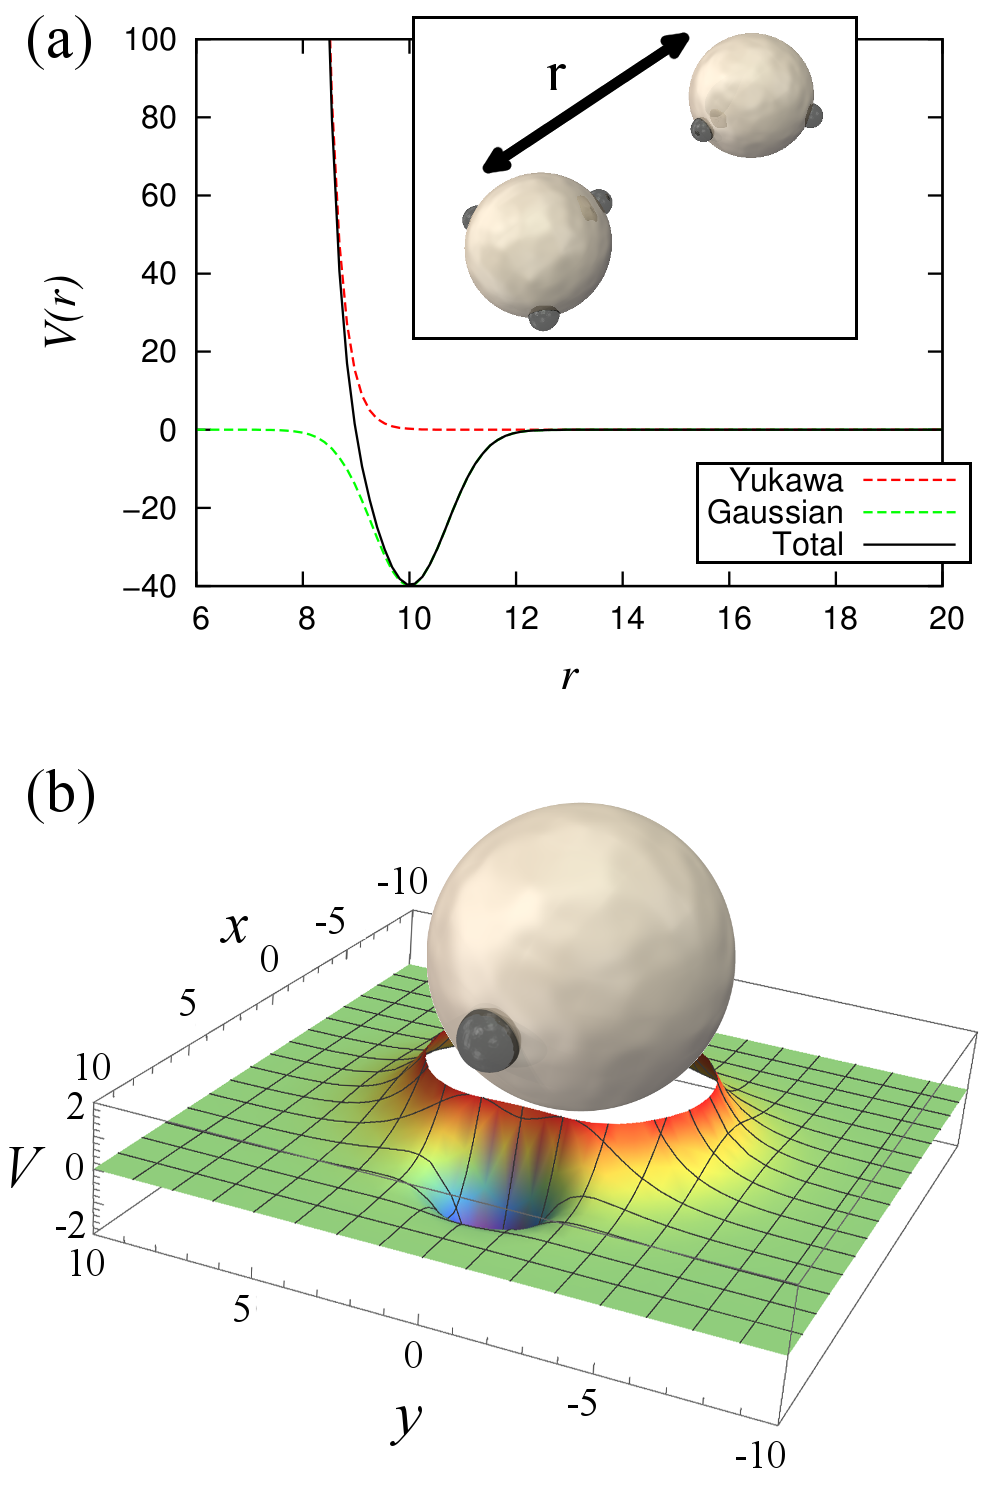
The core-core interaction is repulsive, described by a Yukawa potential (see Fig. 1(a)),
| (1) |
where and are the effective radii of the two interacting particles, is the interaction strength and the inverse of the screening length. The core-core interaction is truncated at a cutoff distance (at the potential is ). The patch-patch interaction is described by an attractive Gaussian potential Vasilyev et al. (2013), (see Fig. 1(a)),
| (2) |
where (in units of ) is the interaction strength, the width of the Gaussian, and is the distance between the two interacting patches. The patch-patch interaction is truncated at a cutoff distance . The superposition of these two interactions and the resulting energy landscape are represented in Figs. 1(a) and (b). For these parameters, we expect at most one bond per patch. However, as we discuss below, in certain cases we observe the formation of double bonds, i.e. two bonds per patch.
We consider an attractive substrate interacting isotropically with the patchy particles. The pairwise potential was derived from the Hamaker theory for two spheres Everaers and Ejtehadi (2003) in the limit where the radius of one particle diverges. This gives,
| (3) |
for the attractive part and
| (4) |
for the repulsive one, where is the Hamaker’s constant and the distance between the surface of the particle and the substrate. The potential is highly repulsive for distances shorter than the particle radius and is attractive at longer distances. It has a minimum at .
To resolve the stochastic trajectories of the particles, we describe them as rigid bodies and integrate the corresponding Langevin equations of motion for the translational degrees of freedom,
| (5) |
and rotational ones,
| (6) |
The equations are integrated using the velocity Verlet scheme with a time step of and Large-scale Atomic/Molecular Massively Parallel Simulator (LAMMPS) for efficient parallel simulations Plimpton (1995). and are the translational and angular velocity, and are mass and inertia of the patchy particle, is the pairwise potential, and is the stochastic term, from the thermal noise, given from a random distribution of zero mean. We consider the damping time for the translational motion,
| (7) |
which we set to be . From the Stokes-Einstein-Debye relation Mazza et al. (2007),
| (8) |
and so the rotational damping time .
The parameters for the Langevin dynamics simulations were taken from Ref. Wang et al. (2012): and . To access time scales of the order of the second we used translational and rotational diffusion coefficients and , which are one order of magnitude larger than the ones observed experimentally in solution at room temperature Wang et al. (2012). There are, at least, two relevant time scales governing the relaxation process: The typical time for a bond to break and the diffusion time. During our simulations we did not observe any bond breaking event, as is low. By contrast, the relaxation dynamics consists of particle rearrangements leading to the formation of new bonds. Thus, in this low temperature limit, considering a larger diffusion coefficient corresponds to re-scaling the time.
The initial structures were generated using the stochastic model first presented in Ref. Dias et al. (2013) where bonds are considered irreversible during the growth and the mechanism of mass transport to the substrate is advective Dias et al. (2013). We measure the total number of particles in monolayers (ML) corresponding to particles, where is the lateral size of the substrate in units of the particle diameter .
III Results
III.1 Particle bonds
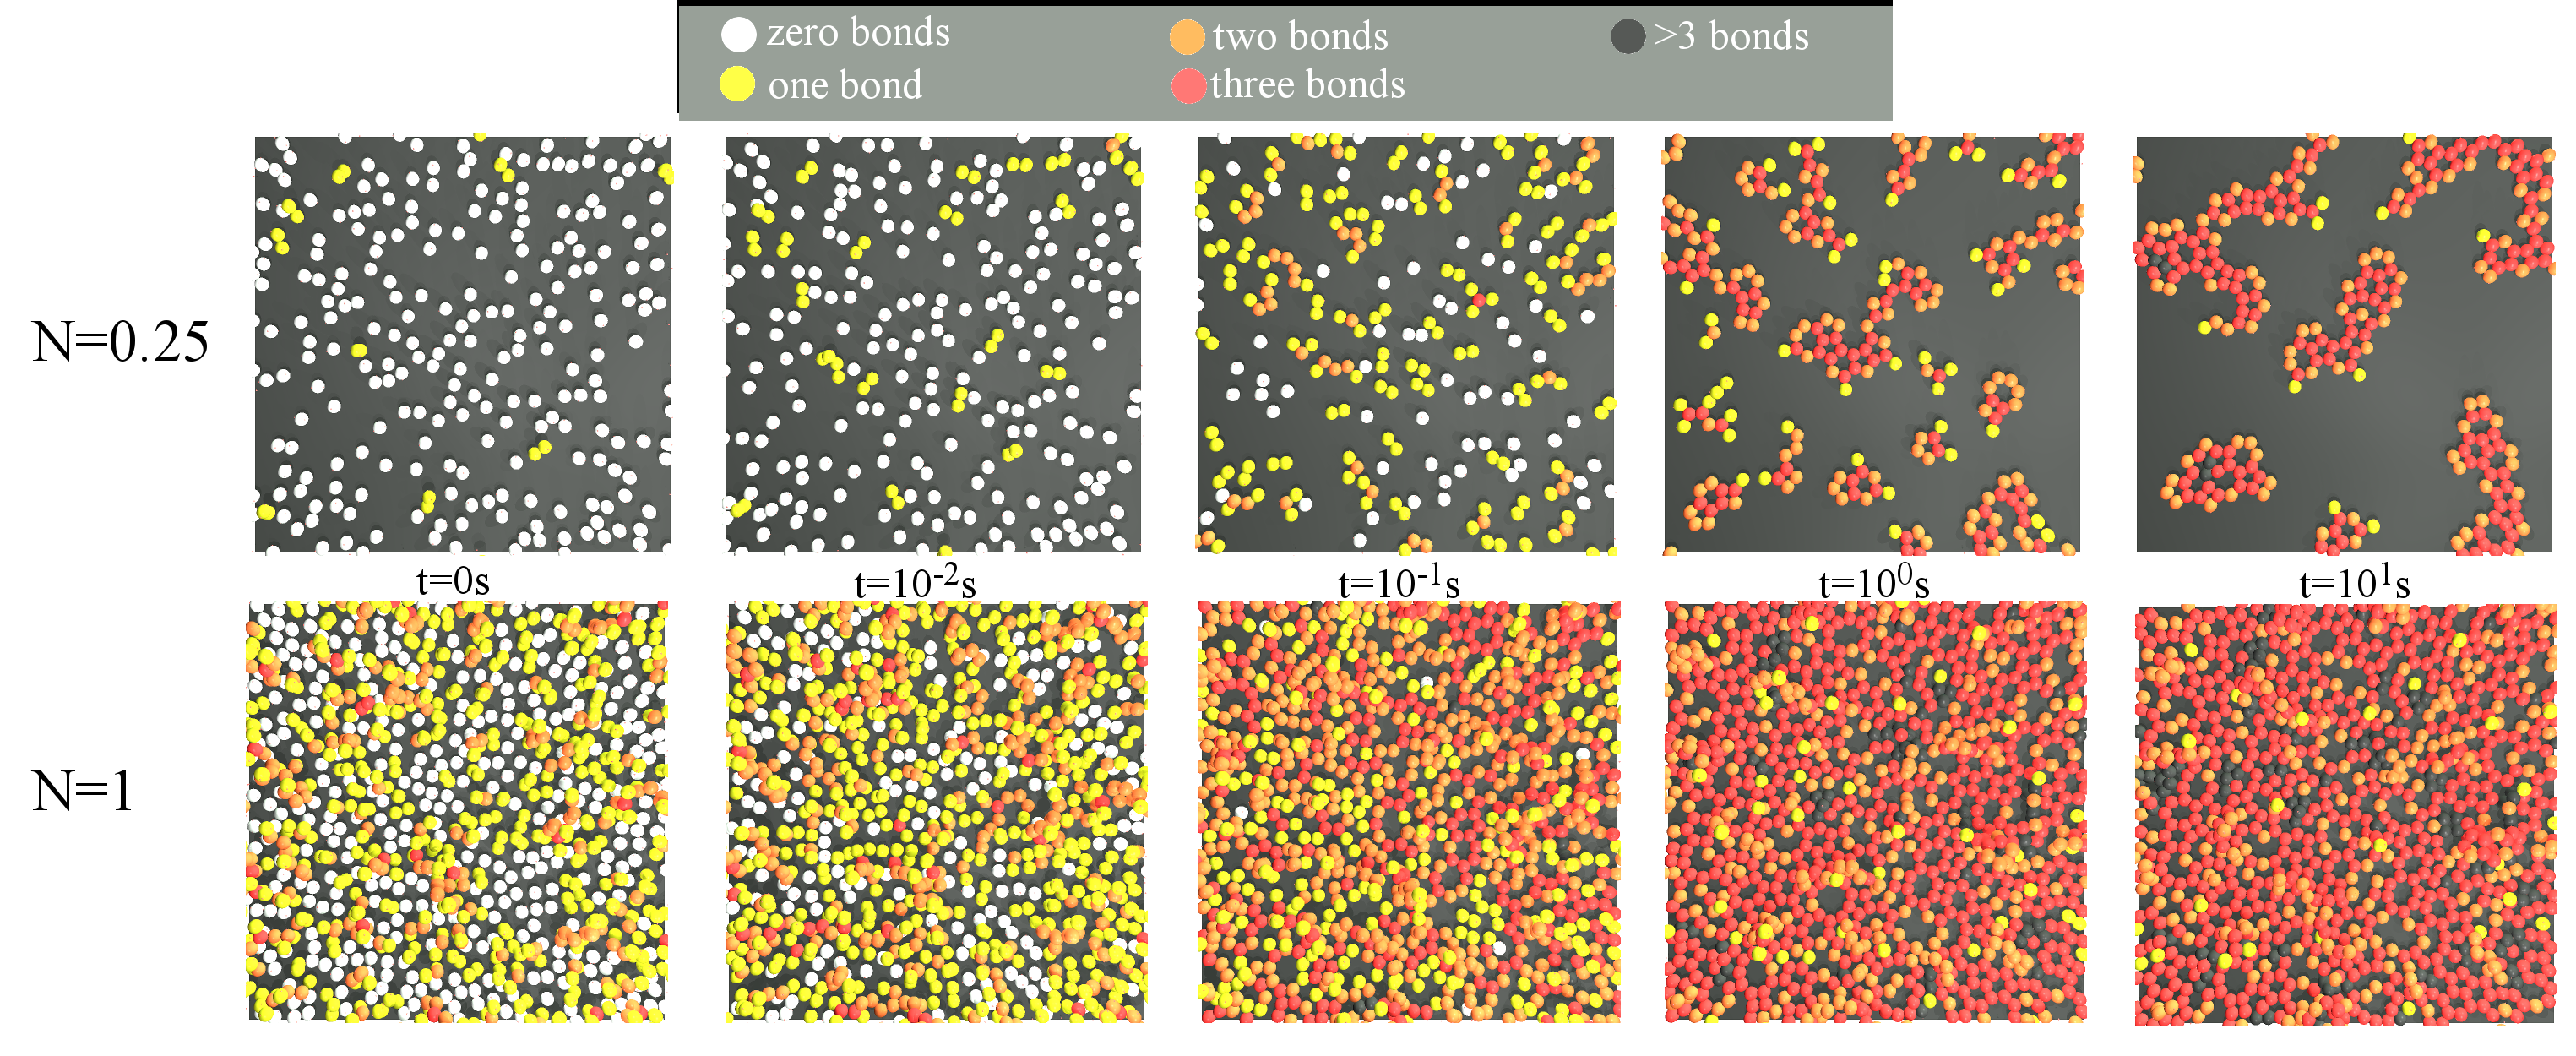
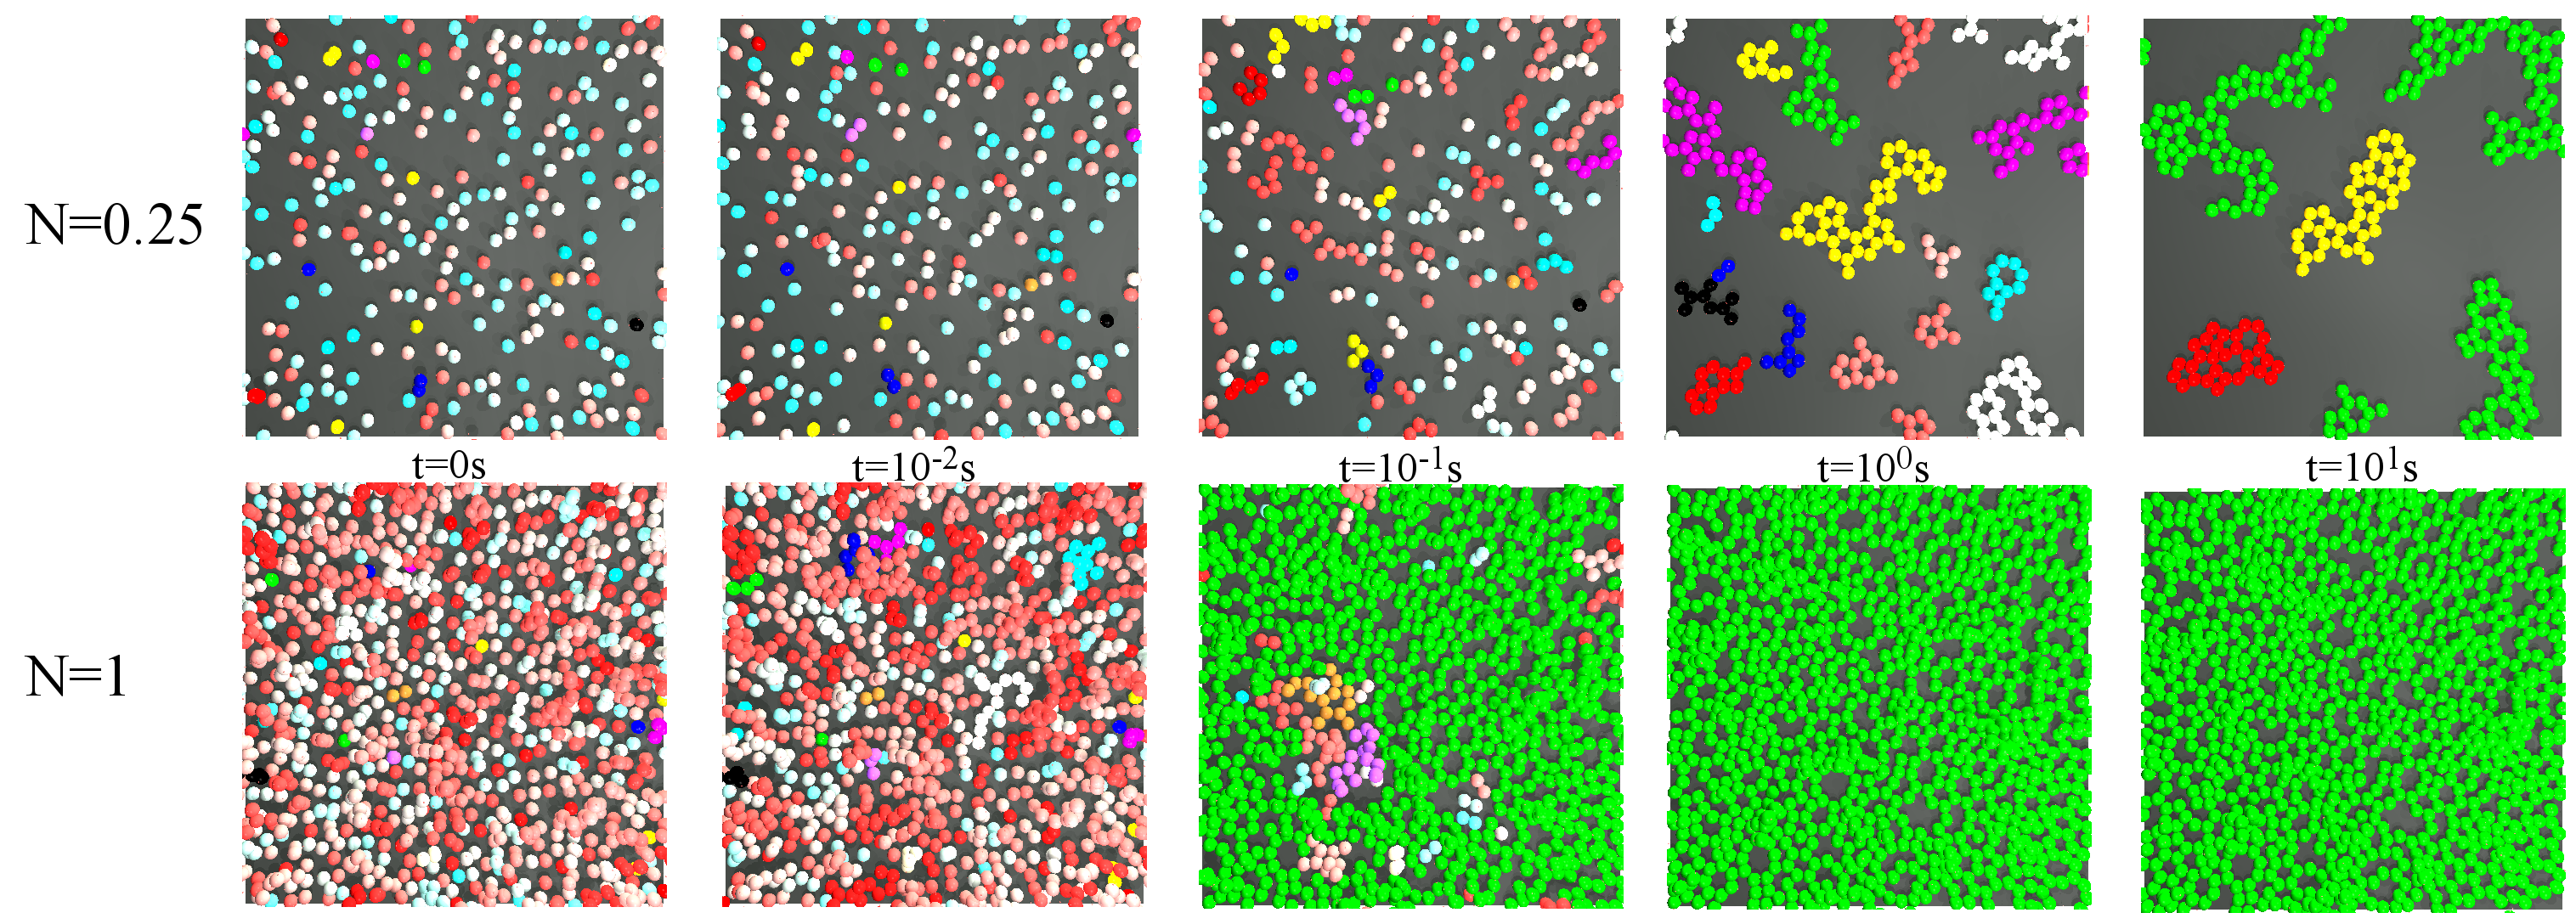
We analyze the dynamics for and . From the snapshots in Fig. 2 one can see that for the lower the overall structure evolves from an initially homogeneous distribution of patchy particles to a handful of aggregates. We define aggregates as particles connected through their patches. For the spatial distribution of particles does not change significantly in time and only a single aggregate spanning the entire substrate is formed. This result hints at two different mechanisms of relaxation. While for lower , the particles need to diffuse and rotate to maximize the coordination of each particle, and thus decrease the overall energy, for larger , the diffusion of the particles is hindered by the particle-particle repulsive interaction and relaxation is mainly driven by the local rearrangements of individual particles.
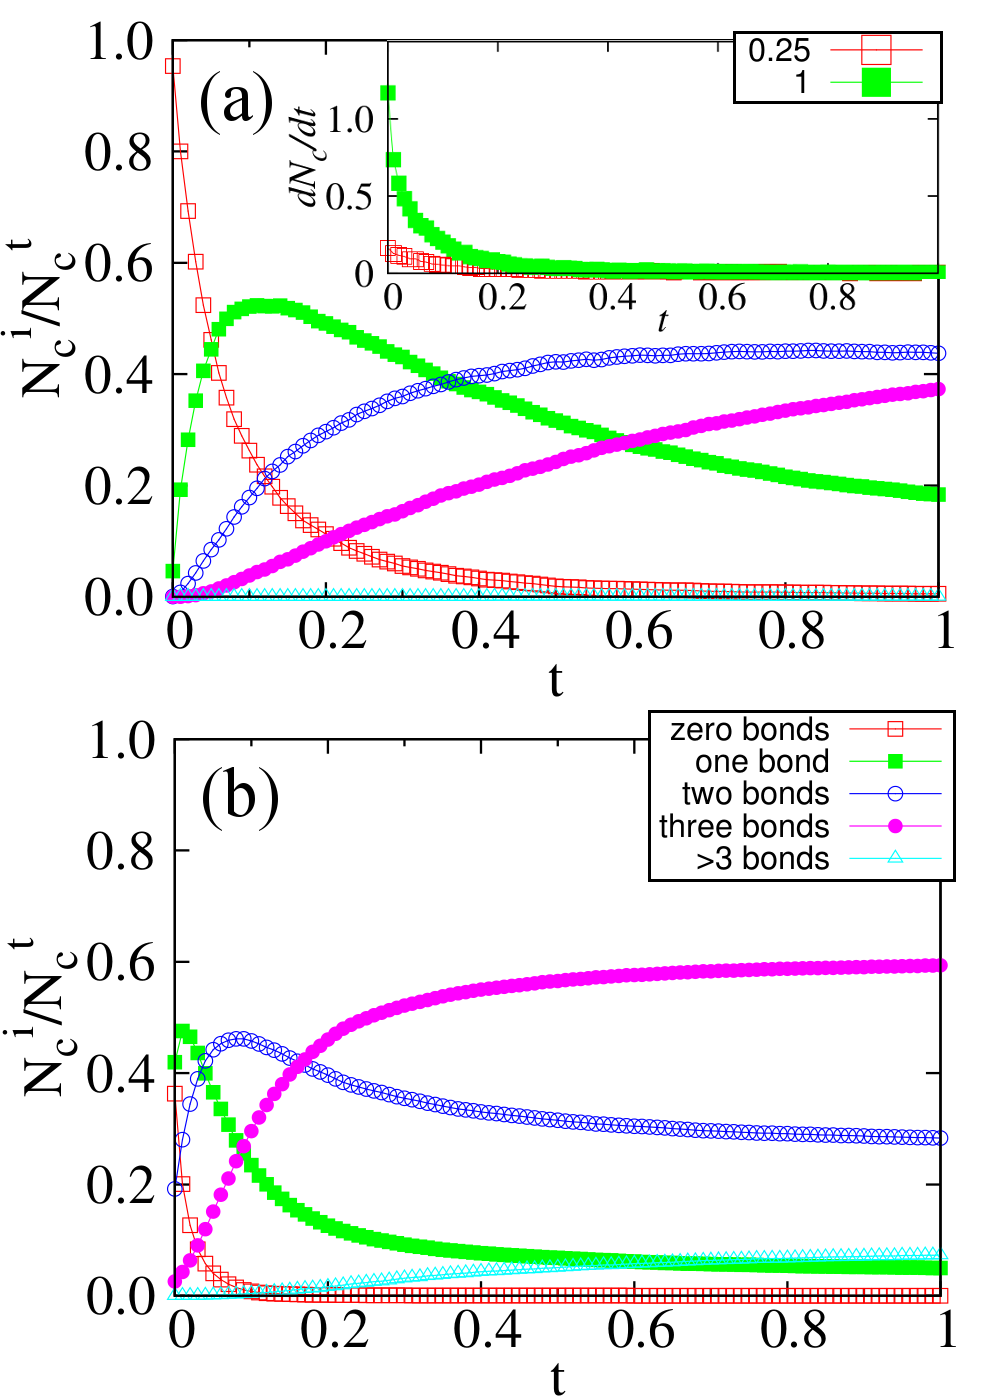
In Fig. 3 we plot the ratio of particles of a certain number of bonds as a function of time. A qualitative different behavior is observed for the two values of . The inset of Fig. 3(a) shows the binding rate, given by the time derivative of the total number of bonds. The initial binding rate for is one order of magnitude larger than for , as the initial interparticle distance on the substrate is lower and particles can promptly form bonds with their neighbors. This is also visible from the evolution of the fraction of isolated particles (unbonded) in the main plots of Figs. 3(a) and (b). For (Fig. 3(b)), this fraction vanishes for , while for Fig. 3(a)) it takes six times longer for every isolated particle to form at least one bond. The fraction of particles with one and two bonds is characterized by a maximum at an intermediate time. As the initial relaxation dynamics is faster for than , these maxima occur much earlier. For longer times, the fraction of particles with three bonds dominates (at low temperatures and strong patch-patch interaction). The fraction of particles with three bonds is higher for , as only one aggregate is formed. Note that, for N=1, about of particles have a final number of bonds larger than three (the number of patches), while there are almost none for . This result suggests that for a sufficiently large number of particles on the substrate the interparticle repulsion is such that multiple bonds per patch are formed to decrease the overall energy.
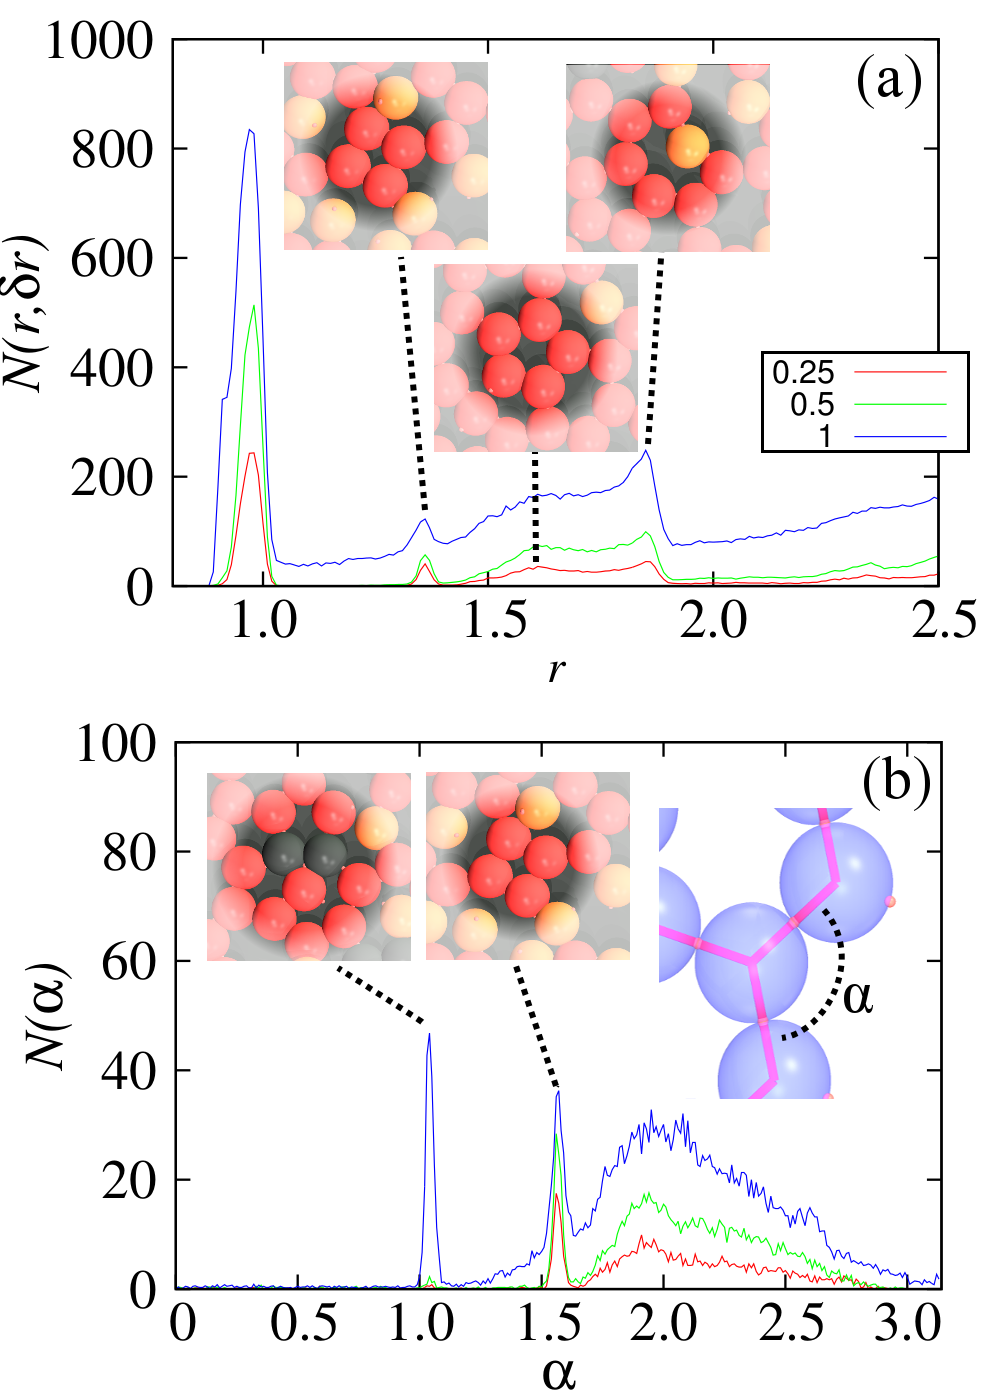
One expects that three-equally-spaced-patch particles self-organize into a honeycomb-like structure Dias et al. (2015). However, the radial distribution function, shown in Fig. 4(a), consists of a sequence of peaks at positions that differ from the characteristic interparticle distances of the honeycomb lattice. The first peak of the radial distribution function is given by particles in direct contact. The second one indicates a square-like arrangement of connected particles, however they are not periodically reproduced, since the third and fourth neighbors of the square lattice are not present on the radial distribution function. The following peaks of the radial distribution function range from a five-particle loop to more stretched ones of six, seven, or eight particles.
Figure 4(b) shows the distribution of angles between two neighbors connected to one particle (see the inset scheme). The first peak indicates the occurrence of double bonds on a single patch (see inset snapshot). This peak occurs at suggesting that the local structure resembles a triangle. This is an uncommon event since the probability that one particle has, at least, one double bond is (see discussion above). This event has a large effect on the angular distribution as it contributes three times to the statistics, one for each of the three particles. These structures are not visible in the radial distribution function of Fig. 4(a) since the distance between the particles is one diameter. The next peak on the angular distribution function is related to square structures (), and the widest peak is the superposition of the contribution of the other structures forming loops of five to eight particles. This distribution is considerably different from the original structure from the stochastic model (without relaxation), which exhibits only one peak at Dias et al. (2013).
III.2 Aggregation dynamics
We proceed to analyze the aggregation dynamics. We label particles belonging to the same aggregate using the Hoshen-Kopelman algorithm Hoshen and Kopelman (1976). As shown in Fig. 5 for the dynamics evolves to form a single aggregate. For the formation of a single aggregate may occur at long enough times, if the patch-patch interaction is strong enough.
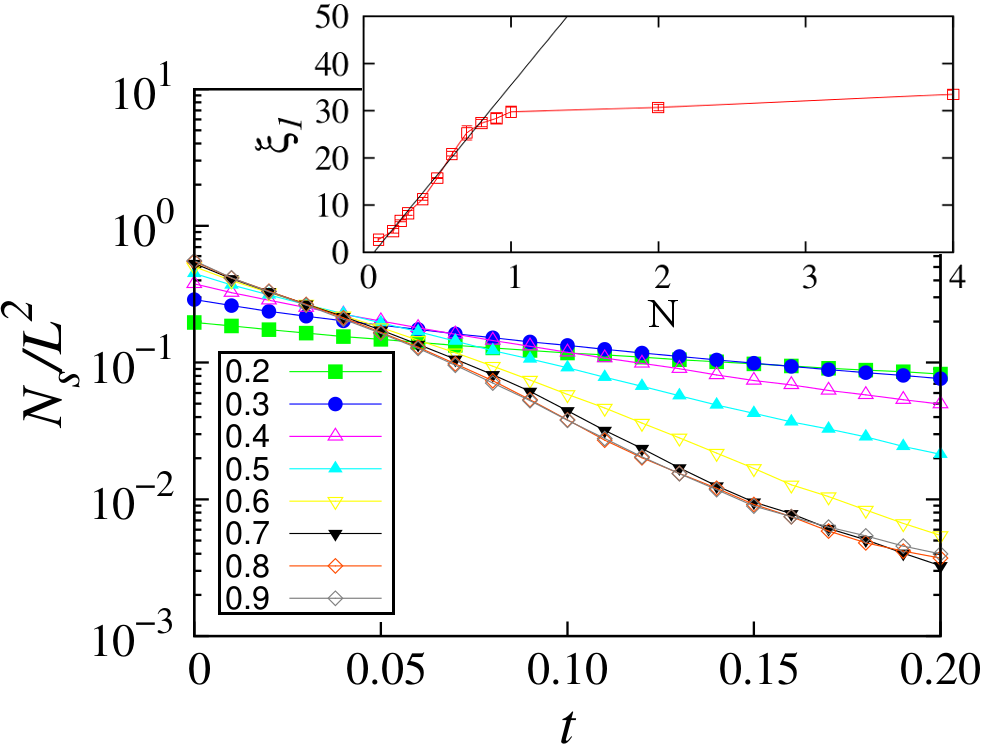
We measure the number of aggregates as a function of time for different , as shown in Figs. 6 and 7. For a strong patch-patch interaction and very long times (and below the bond breaking time), all particles are connected, forming a single aggregate. From these results, we can distinguish two regimes: the first regime for and the second for . In Fig. 6, we plot the number of aggregates as a function of time for the first regime to show that has an exponential decay,
| (9) |
where is the inverse of a characteristic time scale. As we can see from the snapshots in Fig. 5, in the first regime, the dynamics is dominated by fast formation of bonds with local neighbors leading to the formation of small aggregates.
In the inset of Fig. 6 we plot as a function of . For low , increases linearly with . In the submonolayer regime, particles are initially distributed on the substrate in a homogeneous fashion. They diffuse and form aggregates. The typical area that each isolated particle needs to diffuse and aggregate scales with the inverse of the total number of particles on the substrate (). Since is the inverse of the characteristic time it should scale linearly with . For (and above) as increasing the number of particles does not reduce the typical inter-particle distance in the first-layer on the substrate due to the nucleation of the second layer, saturates and remains practically independent of .
Figure. 7 shows the approach to the asymptotic value for different values of . We can see a power-law behavior at long times,
| (10) |
which reveals the second relaxation regime. As can be seen in the snapshots of Fig. 5, the overall structure does not change significantly in this regime. From Fig. 7 we observe two different power laws for small and large . For and , an exponent of is found, indicating very slow aggregation dynamics. For , we found an exponent of , indicating a faster relaxation. For values of and , crossover effects are observed suggesting that the transition between the two regimes occurs around these values.
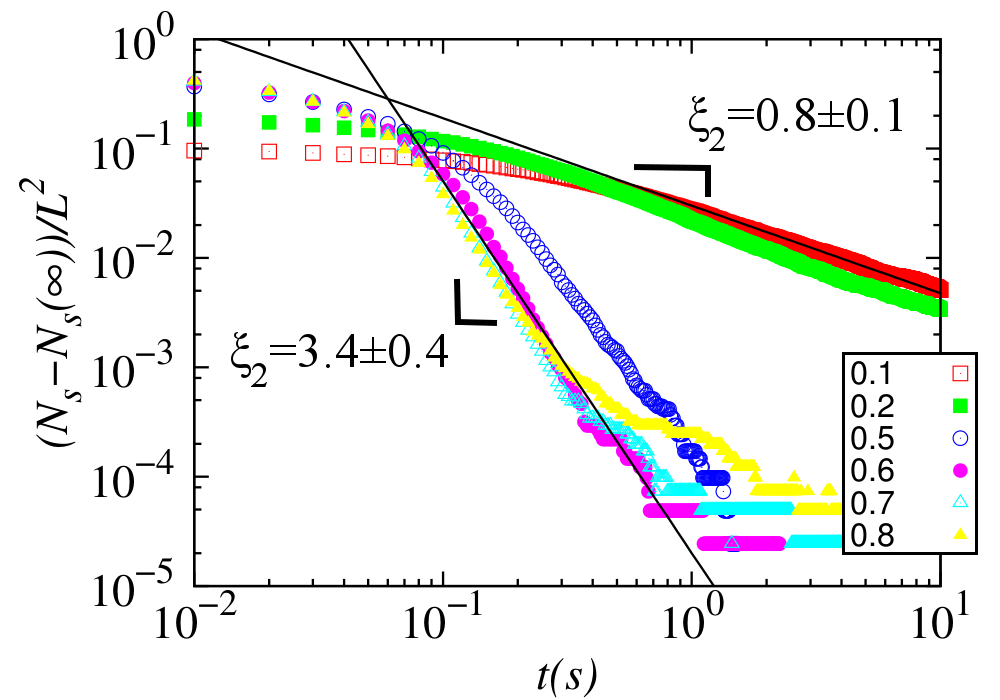
The power-law scaling has one of two characteristic exponents depending on . For small , aggregates need to diffuse and eventually merge. While for larger , diffusion is negligible and aggregates need to readjust to merge with neighboring ones. This transition can be related to a percolation transition. In Fig. 8, we plot the wrapping probability, given by the probability of finding an aggregate that spans the system from one side to the other (the same aggregate crosses opposite boundaries along the x-direction) as a function of , for three different sizes. The percolation transition only occurs for which is in agreement with the transition found in the second relaxation regime shown in Fig. 7 but below the mean-field solution of for a Bethe lattice with three neighbors Stauffer and Aharony (1994).
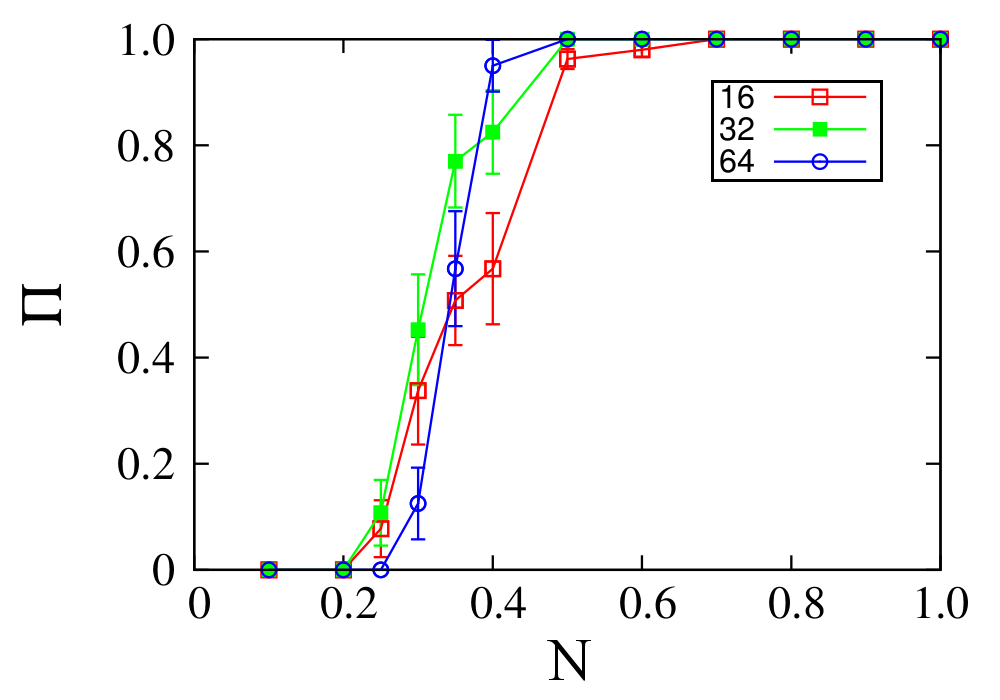
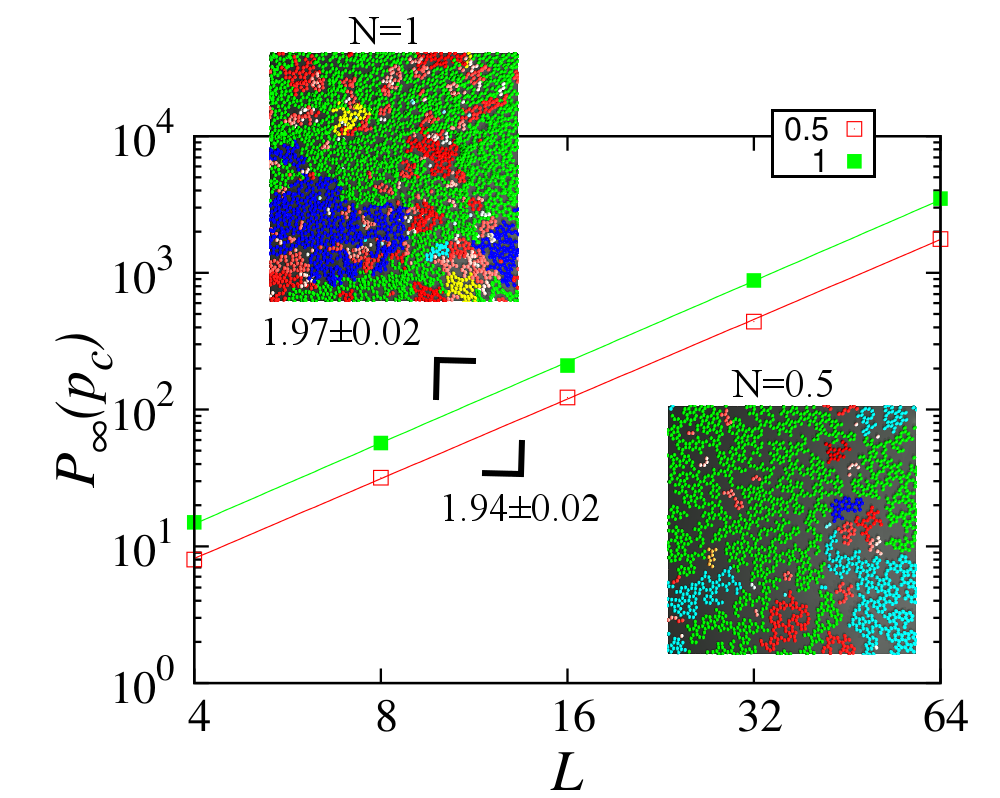
The percolation threshold was estimated for and by the peak on the order parameter standard deviation. From the position of the peak we can estimate the percolation threshold in the thermodynamic limit by extrapolating for an infinite substrate. To characterize the spanning aggregate we plot in Fig. 9 its size at the percolation threshold as a function of the substrate lateral size L for and . It scales as,
| (11) |
where is the fractal dimension. For the fractal dimension is , in agreement with that for two-dimensional random percolation. The numerical value of the fractal dimension for is slightly larger than the one expected for two-dimensional percolation, due to the contribution of particles from the second layer that also belong to the spanning aggregate.
III.3 First-layer coverage
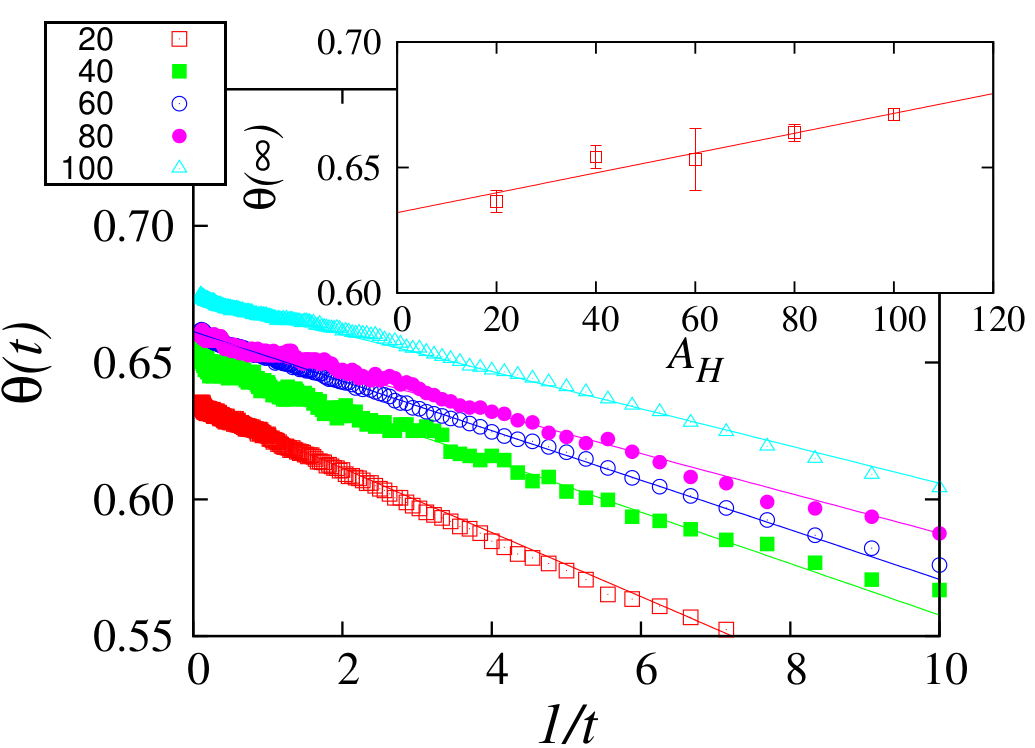
Figure 10 shows the first-layer coverage for as a function of the inverse time. The first-layer coverage is defined as,
| (12) |
where is the number of particles on the substrate within a distance of one diameter from it, the cross-section area of a sphere, and the lateral size of the substrate. is initially lower than the expected value for single-layer random sequential adsorption Evans (1993), due to the formation of more than one layer Dias et al. (2013). During the relaxation, increases, suggesting that particles adsorbed on top of others are attracted to the substrate. The coverage exceeds the one expected for a Honeycomb-like arrangement. We extrapolate the first-layer coverage in the thermodynamic limit for different values of the strength of the particle-substrate interaction, (see inset of Fig. 10). We observe a dependence on , as we increase the substrate interaction, the local restructuring increases the possibility of more particles being adsorbed on the substrate, increasing the first-layer coverage. The radial distribution function for various indicates some inter-particle penetration, a larger peak for the square structures, and a more enhanced peak related to the contribution of the loops of five to eight particles (not shown here).
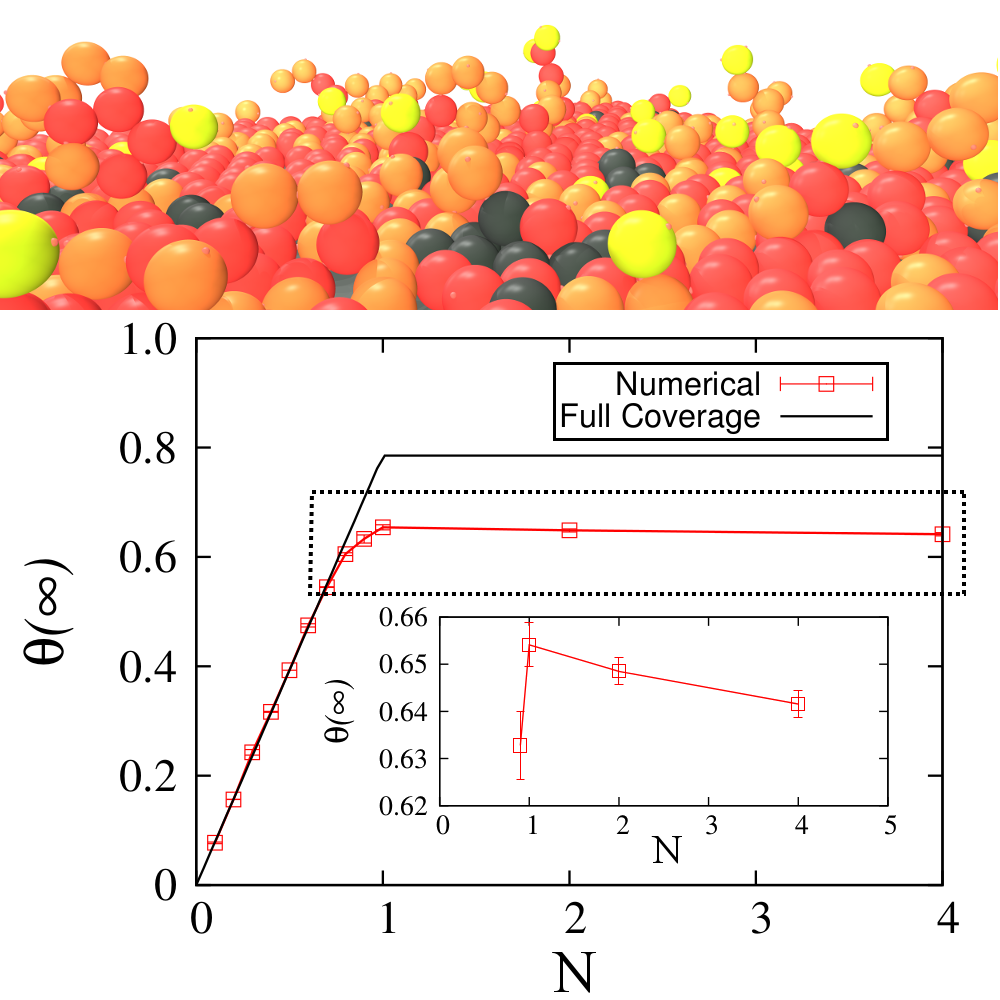
In Fig. 11 the extrapolated first-layer coverage as a function of is plotted. We observe the predictable increase in the submonolayer case, since all particles eventually move to the first layer. However, for larger number of particles, the first-layer coverage decreases with (see inset of Fig. 11). This is related to the formation of connected structures of patchy particles that hold the particles away from the minimum of the particle-substrate potential (see snapshot in Fig. 11).
IV Conclusions
Self-assembly of strongly interacting particles towards thermodynamic structures is typically hindered by the formation of kinetically trapped structures that are stable over long time scales. For the self-assembly of patchy colloids on an attractive substrate we considered the relaxation dynamics towards equilibrium, at low temperature, and identified the relevant kinetic structures. We have shown how the formation and relaxation of kinetic structures depends on the total number of particles and on the particle-substrate interaction. We observed a dependence of the relaxation dynamics on the number of absorbed particles at both short and long times. We have found that the long time dynamics exhibits two characteristic power-law exponents depending on the coverage.
Combining the directionality of particle-particle interactions and the presence of a substrate provides a promising route to grow (mono- and multi-layer) regular structures. However, our results reveal that, while strong patch-patch interactions favor the resilience to thermal fluctuations they yield large barriers to the relaxation towards equilibrium. Thus, as a follow up it would be of interest to explore possible annealing strategies (such as temperature annealing cycles) to overcome these barriers. Nevertheless, it is interesting to notice that these non-equilibrium structures are stable over long periods of time. A systematic analysis of their mechanical and optical properties might reveal them useful for certain practical applications.
Acknowledgements.
We acknowledge financial support from the Portuguese Foundation for Science and Technology (FCT) under Contracts nos. EXCL/FIS-NAN/0083/2012, UID/FIS/00618/2013, and IF/00255/2013.References
- Zhang et al. (2015) J. Zhang, E. Luijten and S. Granick, Ann. Rev. Phys. Chem., 2015, 66, 581.
- Paulson et al. (2015) J. A. Paulson, A. Mesbah, X. Zhu, M. C. Molaro and R. D. Braatz, J. Proc. Cont., 2015, 27, 38.
- Lu and Weitz (2013) P. J. Lu and D. A. Weitz, Annu. Rev. Condens. Matter Phys., 2013, 4, 217.
- Duguet et al. (2011) E. Duguet, A. Désert, A. Perro and S. Ravaine, Chem. Soc. Rev., 2011, 40, 941.
- Hu et al. (2012) J. Hu, S. Zhou, Y. Sun, X. Fang and L. Wu, Chem. Soc. Rev., 2012, 41, 4356.
- Kretzschmar and Song (2011) I. Kretzschmar and J. H. Song, Curr. Op. Coll. Interf. Sci., 2011, 16, 84.
- Sacanna and Pine (2011) S. Sacanna and D. J. Pine, Curr. Op. Coll. Interf. Sci., 2011, 16, 96.
- Solomon (2011) M. J. Solomon, Curr. Op. Coll. Interf. Sci., 2011, 16, 158.
- Pawar and Kretzschmar (2010) A. B. Pawar and I. Kretzschmar, Macromol. Rapid Commun., 2010, 31, 150.
- Bianchi et al. (2011) E. Bianchi, R. Blaak and C. N. Likos, Phys. Chem. Chem. Phys., 2011, 13, 6397.
- Sacanna et al. (2013) S. Sacanna, D. J. Pine and G.-R. Yi, Soft Matt., 2013, 9, 8096.
- Manoharan (2015) V. N. Manoharan, Science, 2015, 349, 1253751.
- Iwashita and Kimura (2014) Y. Iwashita and Y. Kimura, Soft Matt., 2014, 10, 7170.
- Iwashita and Kimura (2013) Y. Iwashita and Y. Kimura, Soft Matt., 2013, 9, 10694.
- van Oostrum et al. (2015) P. D. J. van Oostrum, M. Hejazifar, C. Niedermayer and E. Reimhult, J. Phys.: Cond. Matt., 2015, 27, 234105.
- James et al. (2015) S. James, M. K. Quinn and J. J. McManus, Phys. Chem. Chem. Phys., 2015, 17, 5413.
- Peng et al. (2014) B. Peng, G. Soligno, M. Kamp, B. de Nijs, J. de Graaf, M. Dijkstra, R. van Roij, A. van Blaaderen and A. Imhof, Soft Matt., 2014, 10, 9644.
- Wilner and Willner (2012) O. I. Wilner and I. Willner, Chem. Rev., 2012, 112, 2528.
- Rogers and Manoharan (2015) W. B. Rogers and V. N. Manoharan, Science, 2015, 347, 6222.
- Geerts and Eiser (2010) N. Geerts and E. Eiser, Soft Matt., 2010, 6, 4647.
- Bianchi et al. (2013) E. Bianchi, C. N. Likos and G. Kahl, ACS Nano, 2013, 7, 4657.
- Khan et al. (2015) S. Khan, J. Haaga and J. D. Gunton, J. Chem. Phys., 2015, 143, 024906.
- Guo et al. (2014) R. Guo, J. Mao, X.-M. Xie and L.-T. Yan, Sci. Rep., 2014, 4, 7021.
- Markova et al. (2014) O. Markova, J. Alberts, E. Munro and P.-F. Lenne, Phys. Rev. E, 2014, 90, 022301.
- Vasilyev et al. (2013) O. A. Vasilyev, B. A. Klumov and A. V. Tkachenko, Phys. Rev. E, 2013, 88, 012302.
- Araújo et al. (2008) N. A. M. Araújo, A. Cadilhe and V. Privman, Phys. Rev. E, 2008, 77, 031603.
- Cadilhe et al. (2006) A. Cadilhe, N. A. M. Araújo and V. Privman, J. Phys.: Cond. Matter, 2006, 19, 065124.
- Eskandari et al. (2014) Z. Eskandari, N. M. Silvestre, M. M. Telo da Gama and M. R. Ejtehadi, Soft Matt., 2014, 10, 9681.
- Silvestre et al. (2014) N. M. Silvestre, Q. Liu, B. Senyuk, I. I. Smalyukh and M. Tasinkevych, Phy. Rev. Lett., 2014, 112, 225501.
- Bernardino and Telo da Gama (2012) N. R. Bernardino and M. M. Telo da Gama, Phys. Rev. Lett., 2012, 109, 116103.
- Kalyuzhnyi et al. (2015) Y. V. Kalyuzhnyi, E. Bianchi, S. Ferrari and G. Kahl, J. Chem. Phys., 2015, 142, 114108.
- Sokolowski and Kalyuzhnyi (2014) S. Sokołowski and Y. V. Kalyuzhnyi, J. Phys. Chem. B, 2014, 118, 9076.
- Pizio et al. (2014) O. Pizio, S. Sokołowski and Z. Sokołowska, J. Chem. Phys., 2014, 140, 174706.
- Rzysko et al. (2015) W. Rżysko, S. Sokołowski and T. Staszewski, J. Chem. Phys., 2015, 143, 064509.
- Dias et al. (2013) C. S. Dias, N. A. M. Araújo and M. M. Telo da Gama, Soft Matt., 2013, 9, 5616.
- Dias et al. (2014) C. S. Dias, N. A. M. Araújo and M. M. Telo da Gama, Phys. Rev. E, 2014, 90, 032302.
- Dias et al. (2014) C. S. Dias, N. A. M. Araújo and M. M. Telo da Gama, Europhys. Lett, 2014, 107, 56002.
- Araújo et al. (2015) N. A. M. Araújo, C. S. Dias and M. M. Telo da Gama, J. Phys.: Cond. Matt., 2015, 27, 194123.
- Everaers and Ejtehadi (2003) R. Everaers and M. R. Ejtehadi, Phys. Rev. E, 2003, 67, 041710.
- Plimpton (1995) S. Plimpton, J. Comp. Phys., 1995, 117, 1.
- Mazza et al. (2007) M. G. Mazza, N. Giovambattista, H. E. Stanley and F. W. Starr, Phys. Rev. E, 2007, 76, 031203.
- Wang et al. (2012) Y. Wang, D. R. Breed, V. N. Manoharan, L. Feng, A. D. Hollingsworth, M. Weck and D. J. Pine, Nature, 2012, 491, 51.
- Dias et al. (2013) C. S. Dias, N. A. M. Araújo and M. M. Telo da Gama, Phys. Rev. E, 2013, 87, 032308.
- Dias et al. (2013) C. S. Dias, N. A. M. Araújo and M. M. Telo da Gama, J. Chem. Phys., 2013, 139, 154903.
- Dias et al. (2015) C. S. Dias, N. A. M. Araújo and M. M. Telo da Gama, Mol. Phys., 2015, 113, 1069.
- Hoshen and Kopelman (1976) J. Hoshen and R. Kopelman, Phys. Rev. B, 1976, 14, 3438.
- Stauffer and Aharony (1994) D. Stauffer and A. Aharony, Introduction to percolation theory, Taylor & Francis, London, 1994.
- Evans (1993) J. Evans, Rev. Mod. Phys., 1993, 65, 1281.