Gas outflows in Seyfert galaxies: effects of star formation versus AGN feedbacks
Abstract
Large scale, weakly collimated outflows are very common in galaxies with large infrared luminosities. In complex systems in particular, where intense star formation (SF) coexists with an active galactic nucleus (AGN), it is not clear yet from observations whether the SF, the AGN, or both are driving these outflows. Accreting supermassive black holes (SMBHs) are expected to influence their host galaxies through kinetic and radiative feedback processes, but in a Seyfert galaxy where the energy emitted in the nuclear region is comparable to that of the body of the galaxy, it is possible that stellar activity is also playing a key role in these processes. In order to achieve a better understanding of the mechanisms driving the gas evolution specially at the nuclear regions of these galaxies, we have performed high-resolution three-dimensional hydrodynamical simulations with radiative cooling considering the feedback from both star formation regions including supernova (type I and II) explosions and an AGN jet emerging from the central region of the active spiral galaxy. We computed the gas mass lost by the system, separating the role of each of these injection energy sources on the galaxy evolution and found that at scales within one kiloparsec an outflow can be generally established considering intense nuclear star formation only. The jet alone is unable to drive a massive gas outflow, although it can sporadically drag and accelerate clumps of the underlying outflow to very high velocities.
Subject headings:
galaxies: Seyfert – galaxies: ISM – galaxies: outflow – galaxies: AGN –ISM: kinematics and dynamics – ISM: evolution1. Introduction
Gas outflows extending for few kiloparsec scales (kpc) or larger are frequently observed in local galaxies with high star formation rates (SFRs) and in active galactic nuclei (AGN). A large fraction of the outflows is detected in high-redshift, active star forming sources, and for this reason it is common to believe that outflows represent a stage of the galactic evolution (see, e.g., Shapley et al., 2003). Such outflows affect the multiphase distribution of the interstellar medium (ISM; see, e.g., McKee, 1995) and are responsible for the dynamical and chemical evolution of the galaxy, determining the enrichment of the intergalactic medium (IGM; see e.g. Heckman et al., 1990; Melioli et al., 2009, 2013, 2015, and references therein) as well as the deficit of baryons seen in many galaxies.
Outflows may also quench star formation by heating up the cold gas component and ejecting it from the host galaxy (see, e.g., Binney, 2004). High energy outflows have been proposed as the main cause of the drop in AGN luminosity and the end of the galactic gas fuelling onto the central super massive black hole (SMBH), limiting the active phase of the nucleus to a time of about yr. Outflows are also particularly important for starburst (SB) galaxies whose intrinsically large SFR provides the perfect conditions for gas outflow to develop.
In complex systems where an intense star formation (SF) activity coexists with an AGN, it is unclear whether the SF, the AGN, or both are driving the outflows. It is known that accreting SMBHs influence their host galaxies through kinetic/radiative feedback processes, but the details of these processes remain unclear (e.g. Storchi-Bergmann et al., 2009, 2010; Morganti et al., 2013). In particular, in Seyfert galaxies, where the nuclear source emits an amount of energy comparable to that of the host galaxy, it would be possible that the outflows are driven predominantly by the stellar activity, which therefore would have a key role in the evolution of the system.
There are several studies that assume a thermal AGN feedback in the vicinity of the black hole (e.g Di Matteo et al., 2005; Springel et al., 2005; Johansson et al., 2009). Observations indicate that there may be two distinct modes of AGN feedback (see Fabian, 2012, for a review). The kinetic-mode (also denominated radio mode), thought to occur at low Eddington ratios ( 0.1), is expected to operate through heat injection into the surrounding gas by a relativistic jet. In the quasar-mode, likely linked to high Eddington ratios ( 0.1), the AGN power is believed to couple directly to the interstellar medium of the host galaxy via radiation pressure or accretion disc winds, resulting in fast outflows (e.g. Aalto et al., 2012; Cicone et al., 2014; Genzel et al., 2014; Tombesi et al., 2015). The general conclusions of these studies is that AGN feedback can unbind a large fraction of the baryons provided that a few percent of the bolometric luminosity couples thermally to the ISM. This applies specially in the framework of quasar or radiativemode AGN feedback (see, e.g., King, 2003; Ostriker et al., 2010; Faucher-Giguère & Quataert, 2012; Zubovas & King, 2012).
Gaspari et al. (2011b, a) and Gaspari et al. (2012) performed three-dimensional simulations of the evolution of the gas in clusters, groups of galaxies and elliptical galaxies taking into account the AGN feedback and found that a mechanical feedback with these lower efficiencies would be enough to both constrain the growth of the black hole and balance the radiative cooling resulting in gas density and temperature distributions compatible with the observation and with the results of similar studies (see, e.g., Falceta-Gonçalves et al., 2010b, a; Ciotti et al., 2010; Novak et al., 2011).
However, these studies, in general, have focussed on the large (100 kpc 1 Mpc) scale evolution of the gas, where most of the energy of the SMBH jet is directly transferred to the intra-group or intra-cluster medium carrying out a large amount of gas and probably preventing cooling flows. Almost no work has addressed the effects of the AGN on the host galaxy, where the highly collimated jet has possibly very weak interactions with the surrounding medium. Of course, there is a theoretical interest in the ability of AGNs to affect the gas mass in the nuclear region and its star formation history (e.g., Croton et al., 2006; Schawinski et al., 2007), but the inclusion of effects like the interplay between star formation and the AGN activity, the merger of galaxies and secular processes, in general, is complex, and the parameter space is not yet fully mapped, mainly at small (1 kpc) scales.
In a recent work, Wagner et al. (2012) investigated with help of HD simulations the detailed physics of the feedback mechanism between a SMBH jet and a two phase fractal ISM in the kpc-scale core of a galaxy, but their results refer only to the early stages of the jet evolution, when it propagates through the disk for the first time. In this case the dense embedded clouds of the ISM are accelerated by the ram pressure of the high velocity flow through the porous channels of the warm phase gas, but probably this regime cannot be maintained for much time after the jet digs a hole in the disk and beyond it and therefore, this cannot be taken as a stationary solution.
Generally, feedback of the ISM implies not only energy and momentum injection by supernovae and stellar winds (e.g. McKee & Ostriker, 1977), but also radiation from massive stars and from the SMBH (Thompson et al., 2005, and references therein). The coupling between photons and the interstellar gas is expected to be very weak if only Thompson cross-section is implied (e.g. Ciotti & Ostriker, 2001), but this coupling is enhanced in the presence of dust. Dust grains are able to scatter and absorb UV radiation re-emitting it into infrared. Thus since the gas is coupled to the grains hydrodynamically, radiation pressure on the dust may be able to push the gas against its self-gravity providing an additional driving to gas outflow.
When momentum from stellar radiation pressure and radiation pressure on larger scales via the light that escapes from star-forming regions is considered (see Hopkins et al., 2011, 2012), a more realistic multi-phase ISM develops, maintaining a reasonable fraction of the ISM at densities where the thermal heating from supernovae has a larger effect. The potential importance of radiative momentum feedback has been explored for some time now (see, e.g., Haehnelt, 1995; Ciotti & Ostriker, 2007), and its potential role in the context of AGN and SBs was first pointed out by Murray et al. (2005) and Thompson et al. (2005). It might be considered in principle at least in some situations to study the evolution of the gas of a galaxy hosting an AGN.
In this study we will consider kinetic (or radio) mode AGN feedback and neglect the radiation and dust driven mechanisms (see also Martin, 2005; Sharma et al., 2011). The photo-ionizing radiation will be considered only to justify the minimum temperature of the diffuse gas, T K. In fact, we assume that all the mechanical energy and momentum are effectively deposited into the ISM, so that the mechanical feedback will dominate over the radiative feedback. This is a reasonable assumption for Seyfert galaxies for which the column densities are about cm−2 (or less), as pointed out by Novak et al. (2011). Moreover, although dusty structures, in the form of spiral and filaments at hundreds of parsecs scales are often observed in early-type active galaxies (see, e.g., Simões Lopes et al., 2007) indicating that a reservoir of dust is a necessary condition for the nuclear activity, in Seyfert galaxies the dust mass is lower than that observed in ultraluminous IR galaxies (ULIRGs), and a rapid destruction in supernova-generated shock waves may make the typical dust lifetime shorter than the time over which the galaxy is active (McKee, 1989; Jones & Nuth, 2011).
In order to achieve a better understanding of the processes driving the nuclear gas evolution in a Seyfert galaxy, in this study we perform fully three-dimensional (3D) hydrodynamical simulations at high (1.9 pc) resolution taking into account the effects of radiative cooling and considering the feedback from both star formation regions with type I and II SNe and from a collimated SMBH jet propagating from the central region of an active spiral galaxy. We compute the gas mass lost by the system and separate the role of each energy injection source on the galaxy evolution.
The paper is organized as follows. In Section 2 we summarize some recent observational results about the gas dynamics in the inner kiloparsec scale of Seyfert galaxies. In Section 3 we describe the main physical processes in the nuclear region of an active galaxy and present solutions for a steady state system. In Section 4 we outline the main characteristics of our model, while in Section 5 we present the main results of the simulations and finally, in Section 6, we summarize our conclusions.
2. Observations
Seyfert galaxies are usually spiral galaxies whose nuclei are exceptionally bright. The original definition of the class (Seyfert, 1943) was primarily morphological, i.e., these are galaxies with high surface brightness nuclei, but today the definition has evolved so that Seyfert galaxies are now identified spectroscopically by the presence of strong, high-ionization emission lines. Khachikian & Weedman (1974) were the first to realize that exist two distinct subclasses of Seyfert galaxies, Type I and Type II, which are distinguished by the presence or not of broad bases of permitted emission lines. The spectra of Type I Seyfert galaxies show broad lines that include both allowed lines, like HI, HeI or HeII and narrower forbidden lines, like OIII ( , BLR), while the spectra of Type II Seyfert galaxies show only (permitted and forbidden) narrow lines ( , NLR). In some cases the spectra show both broad and narrow permitted lines, and these objects are then classified as an intermediate type between Type I and Type II, such as Type 1.5 Seyfert. NLRs are characteristic of a low-density ionized gas with widths corresponding to velocities of several hundred kilometres per second, while BLR have widths of up to km s-1, and the absence of broad forbidden-line emission indicates that the broad-line gas is of high density, so the nonelectricdipole transitions are collisionally suppressed. BLRs are associated to the nuclear region (rBLR 1 pc) where the relativistic SMBH jet develops, while NLRs are observed between 10 pc and 1 kpc, and are associated to less dense clouds that may be optically thick and/or optically thin.
The physical conditions of the NLRs have been observed accurately, and in the last years a large number of studies have shown that photoionization by the central continuum source plays a dominant role in exciting the gas (e.g. Kraemer & Crenshaw, 2000a; Kraemer et al., 2000; Bennert et al., 2006b, a), although shocks may play an important role in localized regions (Kraemer & Crenshaw, 2000b; Dopita et al., 2002; Groves et al., 2004). Generally, the NLR is the largest observable feature which may be affected by the AGN radiation and its dynamical forces. Therefore, its investigation is crucial to understand the AGN structure and evolution, as well as the interaction between the nuclear engine and the circumnuclear ISM and the stellar activity of the host galaxies. Despite a large number of ground-based long-slit spectroscopic studies, up to now a consensus about the kinematics of the NLR and its velocity distribution has not been reached yet. Several dynamical models have been proposed such as infall, rotation, outflow (e.g Veilleux, 1991; Fraquelli et al., 2000, 2003; Fischer et al., 2010; Müller-Sánchez et al., 2011, and references therein), and radial acceleration by radio jets or tangential expansion of the gas around the jets (Winge et al., 1997; Axon et al., 1998). However, observations with the Space Telescope Imaging Spectrograph indicated that the main component of the motion in the NLR seems to be radial and more recently, further observational constraints on the kinematic of the NLR in Seyfert galaxies have been established (e.g. Müller-Sánchez et al., 2011). Though biconical models can explain very well the radial velocity profiles of the outflows, there are still several local variations in the gas kinematics that remain unexplained.
Also recently, observations of Seyfert galaxies based on integral-field spectroscopy have found evidences of radial outflows in the NLR (García-Lorenzo et al., 2001; Storchi-Bergmann et al., 2010; Müller-Sánchez et al., 2011). In these studies, it were measured the kinematics of the ionized and molecular gas surrounding the nucleus of the galaxy and it was found that the ionized-gas kinematics may be the result of three velocity components, namely, an extended emission at a systemic velocity observed in a circular region around the nucleus, an outflowing component along the bi-cone characterized by an angle of 60∘, and another component due to the interaction of the radio jet with the galactic disk. The data indicate that the origin of the extended emission is gas from the galactic plane that could be ionized by the AGN and suggest that the NLR clouds may be accelerated very close to the nucleus ( 10 pc), after which the flow moves at essentially constant velocity. The observed mass outflow rates vary between 1 and 10 M⊙ yr−1, being 102 to 103 times larger than the expected accretion rates for an AGN, while the kinetic powers associated to the outflow are between 102 and 104 times smaller than the typical AGN bolometric luminosities (Storchi-Bergmann et al., 2010; Müller-Sánchez et al., 2011). Regarding the third kinematic component, that is, the one due to the interaction of the radio jet with the ambient gas moving at a systemic velocity, there are clear indications that the jet is launched close to the plane of the galaxy, pushing the gas it encounters on its way. The observed high-velocity gas in the nuclear regions of some galaxies as well as the large ratios between Mout and Macc indicate that the outflow cannot be attributed to a single AGN wind episode. It might be rather due to a process in which the interstellar matter around the nuclear region is pushed away by a previous AGN wind (Müller-Sánchez et al., 2011).
Molecular hydrogen emission arises in extended regions along the axis of the galaxy stellar bar, avoiding the region of the bi-cone. The H2 velocities are close to systemic with a small rotation component, supporting an origin in the galactic plane. On the contrary, the maximum velocity of the outflowing component ranges between 120 km s-1 and 2000 km s-1 and is reached at a typical distance of 180 pc from the AGN.
3. Steady state solutions
As described, the physical processes occurring in the nuclear region of a Seyfert galaxy are quite complex. SNI and SNII explode at a given rate injecting energy, momentum and metals into the ISM. The supernova remnants (SNRs) generated by the SN explosions expand through a turbulent multiphase medium in which clouds and filaments are embedded. At the same time, the gas heated by the SNe and by ionizing photons emitted by massive stars is also cooled via radiative losses that depend on the square of the gas density and on the metal abundance affected by the stellar activity. At the center of the galaxy, the presence of the SMBH also contributes to make more complex the evolution of the system. In fact, imaging studies have revealed that structures such as small-scale disks or nuclear bars and associated spiral arms are frequently observed in the inner kiloparsec of active galaxies (Erwin & Sparke, 1999; Pogge & Martini, 2002; Laine et al., 2003), transporting gas into the inner few hundred parsecs. In the same central region, small-scale jets emerge from the base of the accreting disk of the black hole, transfering a large amount of energy into a very collimated region, producing strong shocks and bright emission knots typical of collisionally excited plasma. As stressed in §1, in this contest it is very hard to understand if the observed gas outflow is a consequence of the SMBH feedback or if SNe-driven hot superbubbles may fill out the core of the galaxy developing a wind rich in filamentary structures and turbulences, or both effects are prevailing.
3.1. Energy balance
A first analytical approach study of the evolution of this sort of system may be done by comparing the energy injected by the main sources (SNI, SNII, Jet) with the energy lost by radiative cooling and the energy required to drive a gas outflow. The rate of SNI explosions is about 0.01(Mbulge,10) yr-1 (Pain et al., 1996), where Mbulge,10 is the stellar mass of the bulge in units of 1010 M⊙, while the rate of SNII explosions corresponds to about 0.01 (SFRSB,1) yr-1 (see Melioli et al., 2009), where SFRSB,1 is the star formation rate of a given SB region in units of 1 M⊙ yr-1. Therefore, assuming that each SN releases 1051 erg, the injected luminosity associated to the SN events is:
| (1) |
where MBH,7 is the mass of the central SMBH in units of 107 M⊙ and where we have considered the observed relation between the bulge and the SMBH mass.
The total rate of radiative cooling in an optically thin plasma within a cylindrical region of radius RSB,300 (in units of 300 pc) and thickness hSB,200 (in units of 200 pc) is: 111As remarked in the introduction we are neglecting dust driven mechanisms and radiation pressure because of the low dust column densities observed in the nuclear regions of the Seys and the expected high frequency of SN shocks waves that will help to destroy dust structures. At the same time, the shocks as well as photoionization and non-thermal heating processes by the AGN will ensure a high gas temperature (we will find below in the simulations values as large as K; see. e.g., Figures 10 and 17). Thus, the assumption of an optically thin gas in near ionization equilibrium at the pc-scales around the AGN is reasonable. In this case, the thermal radiative cooling function given in Eq. 2 should be a good approximation even in the presence of photoionization and non-thermal heating by the AGN. This will actually help to keep the surrounding interstellar gas at temperatures larger than or equal to K.
| (2) |
where is the gas density in units of 10 cm-3 at the height , and is the cooling function in units of erg s-1 cm3, corresponding to a temperature of about 104 K. Given the Kennicutt-Schmidt law (Kennicutt, 1998) that provides an excellent parametrization of the global SFR over a density range extending from the most gas-poor spiral disks to the cores of the most luminous SB galaxies, after some algebraic operations we obtain
| (3) |
where SFRkpc = 3.5 SFRSB/R, and substituting Eq. 3 in Eq. 2 we may directly compare the energy injected with the energy lost as a function only of the SFR (per kpc2) of a given galaxy. Therefore, the rate of energy radiated away may be rewritten as:
| (4) |
and the trend of the energy injected and lost (per second) by the system is shown in Fig. 1.
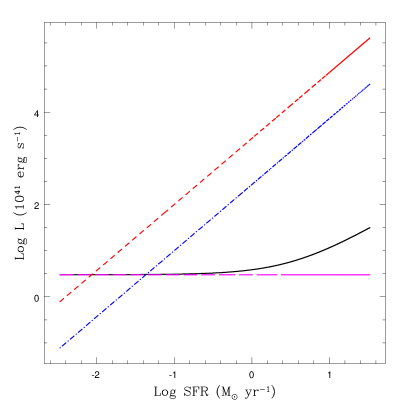
Regarding the jet associated to the SMBH, an amount of energy could in principle be injected in the surrounding gas. This means that about 5 erg s-1 may be released over a time of yr, a value significantly larger than the binding energy of the interstellar medium in a typical spiral or elliptical galaxy, or even in a group of galaxies. However, in a Seyfert galaxy the luminosity associated to the central active jet is lower, between and erg s-1, i.e., of the same order of the luminosity injected by the SNe (Eq. 1). It is also comparable to the energy carried out per second by the gas mass outflow, that is . Moreover, unlike the events described above, near the central black hole, the jet is strongly collimated and its interaction with the ISM of the host galaxy is limited to a small fraction of the total gas mass of the system, of the order of , where is the width of the jet within the galaxy disk in units of 20 pc. Therefore, we can expect that, except for the very early stages of evolution, the SMBH jet will influence only weakly the increase of the mass outflow, so that we can neglect its contribution in Eq. 1.
From Fig. 1, we note that for a cooling function with a value of erg s-1 cm3, which is a lower limit for a gas at T=104 K, the rate of energy injected is larger than the rate of energy radiated away only for a SFR smaller than 0.1 M⊙ yr-1 kpc-2, and for a value of erg s-1 cm-3, which is an upper limit for a gas at T=104 K, the rate of energy injected is larger than the lost energy rate only for SFR smaller than 10-2 M⊙ yr-1. In fact, according with the Kennicutt-Schmidt law, the SFR increases slower than the square of the density, and therefore there is a critical gas density value above which an outflow cannot develop because of the radiative cooling, as indicated in Fig. 1.
3.2. Hot gas and filaments
The result above is mainly due to the idealized scenario adopted with a homogeneous distribution of the gas which misrepresents the expected and observed multi-phase ISM (see, e.g., McKee & Ostriker, 1977; Dettmar, 1990; Hill et al., 2014) in the disk of the galaxies. Indeed, when the stellar winds and the SN energy are injected into the SB region, two competing processes occur: on one hand the winds and the SNRs sweep the diffuse gas, thus lowering its mean density; on the other hand the interactions between the shells of the several SNRs determine the formation of dense and cold structures, generating turbulences and a network of filaments which may coexist with the high-temperature, low-density gas (see, e.g., Melioli & de Gouveia Dal Pino, 2004; Melioli et al., 2005). Therefore, the importance of the radiative cooling depends on which of these two processes dominate. Besides, the radiative cooling is almost negligible in the hot bubbles generated inside the SNRs.
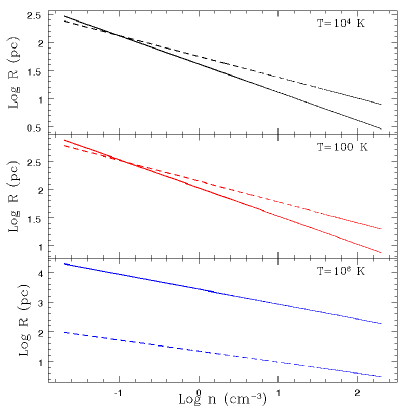
The average distance crossed by a SNR before interacting with another one depends on its expansion velocity and thus on the density of the ISM, and also on the rate of SN explosions per volume. Assuming that a SNR expands for a maximum time t yr (see equations 6 and 9 in Melioli et al., 2006), during this period the number of SN explosions is:
| (5) |
and the average distance between two SNe is:
| (6) |
Therefore, when the average distance between two SNe is smaller than the stall radius of the SNRs, these may interact developing a low density ambient at high temperature coexisting with filamentary structures. Figure 2 illustrates the average distance (solid lines) and the stall radius (dotted lines) as a function of the density and temperature of the ISM. We note that if the Kennicutt-Schmidt law is valid, when the temperature is 104 K or lower, SNRs always interact for ambient densities higher than 0.1 cm-3. When the temperature is about 106 K, each SN explosion may be considered as a single event and there is no SNRs interaction mainly because of the high thermal pressure of the ISM.
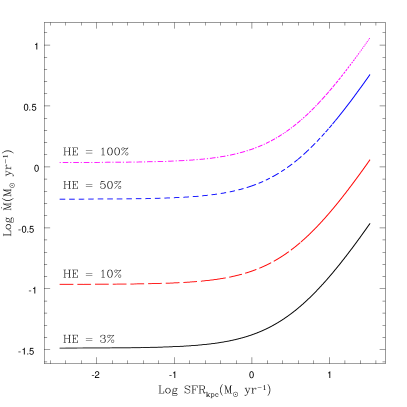
If there is interaction, the successive generations of SNRs expand in a medium more and more rarefied, thus becoming adiabatic and eventually transferring most of their energy to the ISM; in this case the heating efficiency (HE) of the SNe, that is, the fraction of the SN explosion energy that remains effectively stored in the ISM gas and is not radiated away, will be close to unity. On the other hand, in a situation where filaments, clouds and clumps are destroyed on short time-scales raising again very rapidly the ambient density, HE will be very small (for a detailed study on the HE see, e.g., Melioli & de Gouveia Dal Pino, 2004). Therefore, in a multiphase ambient medium characterized by diffuse low density gas and denser filaments, if we assume an escape velocity of the order of , the mass loss rate of the gas in the nuclear region will be approximately given by:
| (7) |
where and are the injected and radiated power, respectively. Considering an average total mass of the system of M⊙ and a height kpc, the outflowing bipolar gas mass rate, as a function of the global SFR for different values of HE, is given in Fig. 3. The most striking result is that, for values of SFR smaller than or approximately equal to 1 M⊙ yr-1, the SB activity drives an outflow smaller than 1 M⊙ yr-1, regardless of the SFR. For SFRs larger than 1 M⊙ yr-1, different scenarios are possible. Depending on the efficiency of the radiative cooling, a strong outflow may develop or not. If HE is high, between 0.5 and 1, a mass loss rate between 25% and 50% of the SFR is possible, but for smaller HE values either an outflow or an inflow can occur, or even both of them concomitantly. Of course, the higher the SFR, the density surface and/or the jet interaction with the ISM, more complex is the description of the evolution of the whole system using a simple approach. For this reason we need to perform hydrodynamical simulations in order to provide a better description of the main physical events in a nuclear region where a SB coexists with an AGN.
4. The numerical model
4.1. Seyfert galaxy initial setup
In our model we consider the central (kpc) region of a typical spiral (Seyfert) galaxy and set the initial conditions for the ISM following the procedure outlined in Melioli et al. (2008, 2009, 2013). We first assume a mass model for the galaxy, which includes the contribution of a bulge and a stellar disk, and then we set the ISM in equilibrium with the gravitational potential given by the summation of the dark matter halo, the bulge, and the disk contributions. The dark matter halo is assumed to follow the Navarro, Frenk & White profile (Navarro et al., 1996):
| (8) |
where is the spherical radius, Mvir is the mass at the virial radius, defined as the radius where the average density is times the cosmological critical density, , is a scale radius, is the ratio between and , = is the concentration and = ln. In this model we considered Mvir = 1011 M⊙, = 120 kpc, = 10 kpc and , adopting a cold dark matter cosmological universe with =0.27, =0.73 and =71 km s-1 Mpc-1. However, we note that due to the limited extension of the galaxy region here investigated, we verify that the gravitational potential of the dark matter halo has almost no influence in the determination of the initial distribution and the evolution of the gas.
The gravitational potential of the stellar bulge is given by a Plummer distribution (Plummer, 1911):
| (9) |
where Mb is the total mass of the bulge and is the core radius defined as the radius containing 50% of the stellar mass. The bulge mass is assumed to be always Mb = 1010 M⊙, while the core radius varies according to the model.
Finally, the gravitational potential of the gas disk is given by a Miyamoto & Nagai profile (Miyamoto & Nagai, 1975), that is:
| (10) |
where Mdisk is the mass of the disk (for the whole galaxy), while and are its radial and vertical scales, respectively. In this study we assume Mdisk = 5 1010 M⊙, = 8 kpc and = 0.8 kpc. Therefore the total gravitational potential is: = + + .
The rotating gas in the disk is initially put in equilibrium with the galaxy gravitational potential. We obtain the rotation velocity resolving the equation (see Melioli et al., 2008, 2009, 2013, 2015). The values of the velocity obtained in this way mimic quite well the rotation curve of a spiral galaxy.
We assume three distinct galaxy models, , and characterized by gas disk distributions with different total mass, density profile and resulting column densities defined as ( cm-2), ( cm-2) and ( cm-2), respectively. All models have a multi-phase gas distribution, and each phase at is defined by a typical temperature and central density , initially in equilibrium in the total gravitational potential described above. The isothermal density distribution of each phase will have the form:
| (11) |
where is the isothermal sound speed of the -phase of the gas and quantifies the fraction of rotational support of the ISM. In our model the -phase density is replaced by the -phase density wherever the -phase pressure is larger than the (coldest and densest) pressure of the -phase.
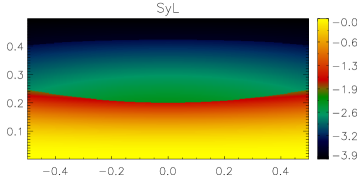
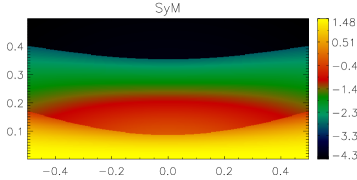
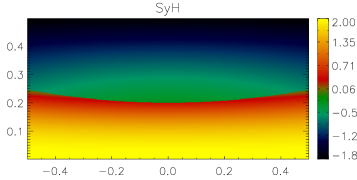
The galaxy parameters adopted in this study are presented in Table 1, and the initial density and temperature distribution for each model is shown in Fig. 4.
| Model | M300pc | |||||||||||
|---|---|---|---|---|---|---|---|---|---|---|---|---|
| kpc | cm-3 | cm-3 | cm-3 | K | K | K | cm-2 | M⊙ | ||||
| SyL | 1.3 | 1 | 10-2 | 10-3 | 1 | 0.9 | 0.8 | 2 | 0.03 | |||
| SyM | 0.7 | 30 | 1 | 3 | 1 | 0.9 | 0.5 | 4 | 0.5 | |||
| SyH | 1.3 | 100 | 1 | 1 | 0.9 | 0.5 | 2 | 3.0 |
4.2. Energy injection
As stressed before, the energy injected in the central region of a Seyfert galaxy comes from a large number of sources: stellar winds and protostellar jets, SN (type I and II) explosions, SMBHs, cosmic rays and spiral waves. However, the average energy injected by the protostellar jets is about 100 times smaller than the energy injected by the SN explosions (Mac Low & Klessen, 2004), while only the Wolf-Rayet stars have winds that are energetically important (Nugis & Lamers, 2000), but last only years. Furthermore, since we are mainly interested in the gas outflow, cosmic rays and spiral waves may be also neglected because although they may play an important role in the star formation processes, they are expected to be less relevant to drive the gas out of the disk in active galaxies222See, however, the importance of cosmic rays to drive winds in normal spiral galaxies and dwarf galaxies (see, e.g., Everett et al., 2008; Booth et al., 2013).
For these reasons, in this study we assume that the kpc-scale outflow observed in different wavelengths is mainly driven by the Type I and Type II SN explosions and/or by the jet produced by the activity of the SMBH in the center of the galaxy.
The rate of type I SN explosions is proportional to the bulge mass (), which in turn is proportional to the mass of the central SMBH () (see §3.1). Given the relation (see, e.g., Häring & Rix, 2004), and assuming a SNI rate in the bulge of 0.01 yr-1 per M⊙ (Pain et al., 1996), we obtain:
| (12) |
where the mass of the SMBH, MBH, is given in units of M⊙. Each -th SN explosion is associated randomly to a given position in the stellar bulge of the galaxy at a random time in the interval , where =30 Myr is the time of stellar activity. This procedure generates points with a random spatial frequency proportional to the stellar density described by the Plummer profile (Plummer, 1911):
| (13) |
To introduce the SNII (characterized by a lifetime 30 Myr), we assume a SB in the central region of the host galaxy, in the disk within a radius of 300 pc and with a typical half-height (above and below the disk) of 80 or 160 pc, depending on the model. We consider an event of star formation in which a total mass of stars 3 107 or 3 108M⊙ (depending on the model) form. Considering a SN rate is (or ) yr-1, which is in agreement with many observations of Seyfert galaxies (see, e.g., Forbes & Norris, 1998), we expect to have 3 (or 3 ) SNe injecting an average luminosity LSN 3 (or 3) erg s-1 in a time interval of 30 Myr. As in the case of the SNI, to set the SNII spatially and temporally within the SB region, we associate randomly to each -th SNII a position , where pc and pc pc depending on the model, and a time in the range Myr. Both for the SNe I and the SNe II, we inject the energy of each explosion over a time of 300 yr and with a SN heating efficiency HE = 100% (Melioli & de Gouveia Dal Pino, 2004) 333We note that a SNR will develop only after the SN shock front enter the Sedov phase, that is, after a time 400/n1/3 yr. The SNR evolution may be considered adiabatic up to a time t/n0.55 yr. This explains why we adopt HE = 100% in the first 300 yr.. Therefore, each SN explosion injects mass and energy at rates = Minj/(300 yr) and = /(300 yr), respectively, where Minj is the mean mass released by a single SN explosion, that is, 16 M⊙ for the SNII and 1 M⊙ for the SNI.
Finally, we assume that the SMBH injects a total constant luminosity of erg s-1 above and below the midplane of the galaxy in two collimated jets characterized in most of the models by a non-relativistic velocity perpendicular to the plane of the disk of 2.1 cm s-1 and by a total rate of injected matter of 6 M⊙ yr-1. The jet is injected in a central cylindric volume of about 14 pc3. In order to verify how the jet setup may affect the results, we have also considered a model with a higher velocity and smaller density jet, with the same luminosity of the one described above, but with a relativistic velocity of 0.2 and a rate of injected matter of 5 M⊙ yr-1.
Since in this study we are interested in understanding the role of each of the energy sources described above on the galaxy evolution we have performed different simulations where either all or only part of the energy sources have been considered. In order to cover a parametric space as large as possible, we have run 16 different models and a summary of the characteristics and parameters adopted for each model are given in Table 2.
4.3. Numerical methodology
To simulate the evolution of the system descrived above, we employed a modified version of the Cartesian Godunov MHD code originally developed by G. Kowal (see Kowal et al., 2007; Falceta-Gonçalves et al., 2008; Santos-Lima et al., 2010; Leão et al., 2013), using the Harten-Lax-van-Leer C (HLLC) solver and a second order RungeKutta for time integration. It also uses the message-passing interface (MPI) library to achieve portability and efficient scalability on a variety of parallel highperformance computing systems. The code is available upon request directly from the authors.
In this version, the code includes a parametrized cooling function in the energy equation that allows the gas to cool down to 10 K with errors smaller than 10 and which is calculated implicitly in each time step for each grid position. The cooling function considers an optically thin gas in ionization equilibrium and takes into account also the gas metallicity and the gas fraction of H2, according to the methodology used by Raga et al. (2000, 2002). We have run all the models with a maximum resolution of 1.9 pc per cell. 444We have also performed several tests with a larger resolution of 0.95 pc per cell for about 2 Myr and found that the results are very similar to those with a 1.9 pc resolution per cell. For this reason, we adopted the latter scheme for the study presented here as it allowed us to save computation time without loosing information and quality in the results. The adopted box has physical dimensions of 111 kpc in the x, y and z directions, respectively, and is covered by 5123 cells.
The energy associated to each SN explosion is injected as thermal energy in a single cell, while the SMBH jet is injected in a single cell above and below the midplane disk, at the center of the system.
In all simulations the initial metallicity at the midplane is assumed to be equal to the solar one (=1) and decreases inversely proportional with the height of the disk, up to a minimum value =0.1. We note that the metallicity can influence the value of the cooling function up to a factor 10 specially at gas temperatures K, but it is not so important for the gas cooling at temperatures between and , or above K. For this reason, we have adopted for the injected SNe a metallicity that increases according to their evolution as described, e.g., in Melioli et al. (2013, see also references therein). We further notice that we have also run a few models (not presented here) with different initial values of the metallicity in the disk (=0.3; =5) and found no significant modifications in the results with regard to the reference model (=1).
Each simulation was run on 512 processors of the LAI supercomputing centre at IAG-USP, using about 105 CPU hours per simulation.
| Modela | Gal. Typeb | SFRd | h | Jet Lum.f | Jet Vel.g | |
|---|---|---|---|---|---|---|
| SyL-SNI | SyL | 0.01 | ||||
| SyL-SNI-SB | SyL | 0.01 | 1 | 160 | ||
| SyL-SNI-SB-JET | SyL | 0.01 | 1 | 160 | 5 | |
| SyL-SNI-JET | SyL | 0.01 | 5 | |||
| SyM-SNI | SyM | 0.01 | ||||
| SyM-SNI-SB | SyM | 0.01 | 1 | 80 | ||
| SyM-SNI-SB-JET | SyM | 0.01 | 1 | 80 | 5 | |
| SyM-SNI-JET | SyM | 0.01 | 5 | |||
| SyM-SNI-10SB | SyM | 0.01 | 10 | 80 | ||
| SyH-SNI | SyH | 0.01 | ||||
| SyH-SNI-SB | SyH | 0.01 | 1 | 80 | ||
| SyH-SNI-SB-large | SyH | 0.01 | 1 | 160 | ||
| SyH-SNI-SB-JET | SyH | 0.01 | 1 | 80 | 5 | |
| SyH-SNI-JET | SyH | 0.01 | 5 | |||
| SyH-SNI-SB-JET-light | SyH | 0.01 | 1 | 160 | 2 | |
| SyH-SNI-10SB | SyH | 0.01 | 10 | 80 |
5. Results
In this section, we present the main results for the different models listed in Table 2. All the models were followed for a time interval between 2 and 12 Myr (depending on the model), which is an appropriate time to investigate the global properties of the wind build-up, from the first SN explosions up to a nearly steady-state phase, when no gas inflow (from the external regions to the center of the galaxy) is detected.
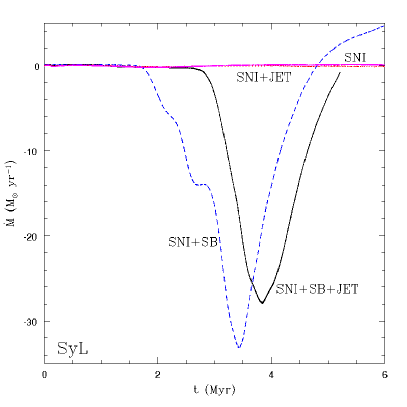
Although we analysed all models of Table 2, we will focus our attention on four of them, namely, the models SyM-SNI-SB, SyM-SNI-SB-JET, SyH-SNI-SB and SyH-SNI-SB-JET which combine one or more of the potential outflow-driving mechanisms. Observations (see, e.g., Tombesi et al., 2013) indicate that a large fraction of Seyfert galaxies has an amount of gas in the inner region of the order of 108 M⊙, so that models with the setup (Table 1) can be taken as main references in this study. On the other hand, models with the setup, which have lower values of gas column density in the center, are more rare to observe and for this reason their results will be only briefly discussed in the Appendix.
5.1. Seyfert galaxy models with intermediate column density (SyM)
5.1.1 SyM-SNI
In this model, we consider a disk galaxy with the setup (see Table 1), characterized by a total mass in the central half kpc volume of about 5 M⊙, a maximum density of 30 cm-3 and a column density, = 1022 cm-2. The energy injected comes only from the SNI explosions, which are expected to occur in any galaxy regardless of the presence or not of a SB region or a SMBH jet. In this case we find that the SNe I, alone, are unable to remove the gas from the center of the galaxy. Figure 6 depicts the mass evolution for this model (dashed-green line) and we clearly see in the top panel that the mass of the whole system remains nearly constant over the time simulated, that is, 6.5 Myr for this model555We note that in this and all diagrams representing the global evolution of the system, there is a small decrease in the gas mass mainly due to the rotation of the galaxy which causes an artificial mass loss through the lateral boundaries of the computational domain. For this reason, in our simulations, in order to compute the final mass loss due to the stellar (or jet) feedback we calculate the difference between the total mass in a model with gas outflow and its counterpart without gas outflow. In the core of the galaxy, within a radius of 40 pc, the mass of the gas varies by about 15% compared to its initial value, while in the disk up to a radius of 400 pc the total amount of gas is reduced by only a few per cent (see Fig. 6, dashed-green lines in the middle and bottom panels).
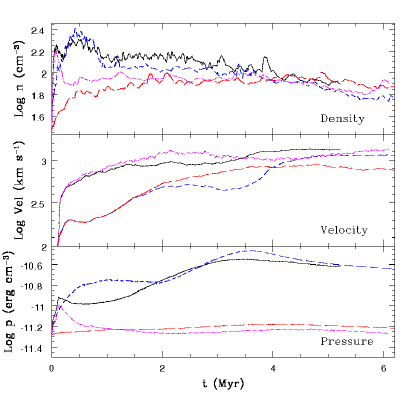
Figures 5 and 8 (dashed-green line) indicate that the SNI explosions only induce the growth of turbulence in the disk and the halo. However, there is no impact in the evolution of the thermal pressure or the maximum density (which are almost constant along the simulation), so that no star formation process, gas outflow or inflow occurs in this case (see also Fig. 7). We note that in Figure 8, the average velocity refers to the whole box and this average (performed over the volume and not over the mass) is strongly affected by the high velocities in the halo, above and below the disk. However, the halo (due to its very low density) does not contribute to the evolution of the disk gas and for this reason, despite the high average velocity, the system does not generate any significant outflow.
5.1.2 SyM-SNI-SB
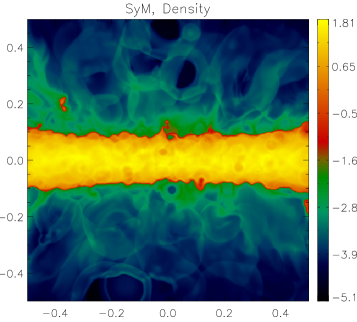
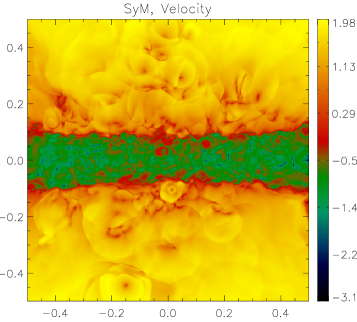
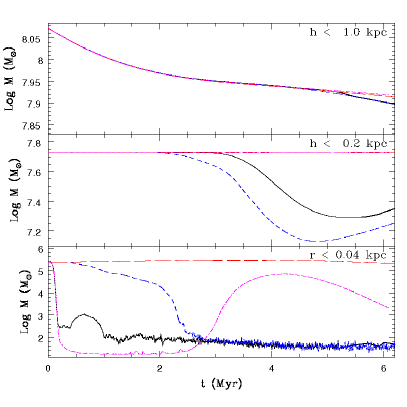
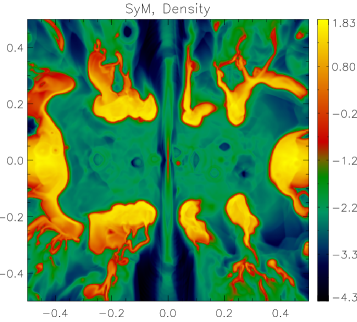
Also in this model the disk galaxy is built with the setup (see Table 1), but the energy sources now include both regular SNI explosions and those of a SB region characterized by a SFR of 1 M⊙ yr-1. We calculate the disk evolution over a time of 12 Myr (Fig. 9) and find that between 2 and 6 Myr an average gas outflow of about 15 M⊙ yr-1 is driven when the SB region is active (see Figures 6 and 7, dashed blue lines). The mass of the disk decreases by about 4.5 M⊙ in the first 5 Myr and then, since there is no gas infall coming from the external region of the galaxy (not considered in this study) the gas density drops to values of about cm-3 (see Fig. 8, dashed blue lines), and a fraction of the gas raised by the SN explosions falls back to the disk, leading to a final average density, after 12 Myr, of about 1 cm-3 (Fig. 9). After 2 Myr the gas in the core of the galaxy (within a radius of 40 pc) is completely removed, and globally the kpc3 volume here considered looses about 3.5 106 M⊙ of gas along 2 Myr, corresponding to a total mass transfer rate of 1.75 M⊙ yr-1.
Observing Fig. 9 we also see that between the hot low density gas outflow and the highly energized gas in the disk, there is a third warm phase characterized by a temperature of 104 K, the minimum allowed in our model. This gas, which enters in the hot wind and flows out of the system, far away from the ionizing sources of the galaxy may be able to cool to low temperatures and eventually, in presence of dust, may form molecular gas at few kpc above the disk, as it has been observed in some systems (e.g., Morganti et al., 2013, ; see also the discussion section 6.2).
5.1.3 SyM-SNI-SB-JET
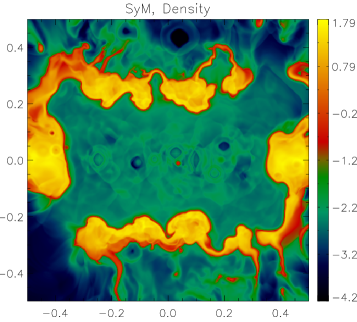
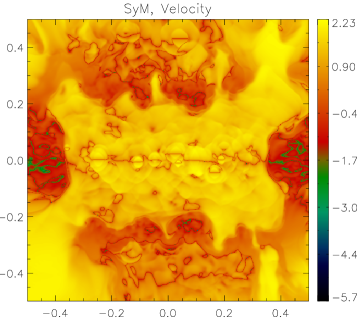
This model is equal to the previous one (SyM-SNI-SB), but in this case we considered also the presence of a highly collimated jet (Table 1) injected in a cylindrical volume characterized by a height of 1.9 pc above and below the midplane of the disk, a mass at a rate of about M⊙ yr-1, a (non-relativistic) velocity of about 2109 cm s-1 and a total kinetic luminosity of 1042 erg s-1. We calculated the evolution of the system over a time of 6 Myr. The results, shown in Figs. 6, 7 and 8 (solid-black lines) and Fig. 10, demonstrate that the overall gas evolution is basically the same obtained without the jet. The only significant difference is in the central core of the disk, within 40 pc, where the gas mass is removed faster, in about 105 yr. The jet at the beginning of its evolution generates a transverse shock wave that propagates radially until reaching an equilibrium position at about 30 pc from the galaxy center. This makes the gas in this region denser and less vulnerable to the action of the SN explosions, which reduces and delays the total gas outflow. The presence of the jet, as expected, also causes a higher mean velocity in the whole system and a very high velocity signature in the low density gas above the disk. However, the mass, density, pressure and temperature evolution of the disk are comparable with those of the model SyM-SNI-SB, and therefore we may conclude that in this case the jet does not affect significantly the global evolution of the system.
5.1.4 SyM-SNI-JET
In this model we consider a disk with a setup, the presence of SNI explosions in the bulge and a central highly collimated jet with a total kinetic luminosity of 1042 erg s-1. Differently from model SyM-SNI-SB-JET, in this case we do not consider a SB region. The results of the evolution of this model over 6 Myr (Figs. 6, 7 and 8, short-dashed purple lines) show, as in the previous case, that the jet alone is unable to remove from the system a significant amount of gas. Indeed, the fraction of gas shocked by the jet along the axis of propagation corresponds to about 2% of the gas in the nuclear region of the galaxy (within R 300 pc), but there is a higher increase in density and pressure in the galactic disk induced by the jet in its normal direction. As in the previous model, during the first 2 Myr only, the gas in the core of the galaxy (within R 40 pc) is swept away by the shock wave generated at the beginning of the jet propagation. However, this phenomenon is local and transient, and does not affect much the global evolution of the system. After 2 Myr, about 30% of the gas falls back into the nuclear region, and the evolution of the galaxy continues to be the same as in Model SyM-SNI.
5.2. Seyfert galaxy models with high column density (SyH)
5.2.1 SyH-SNI
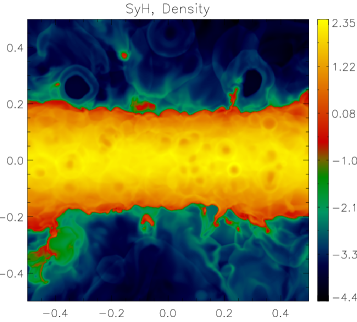
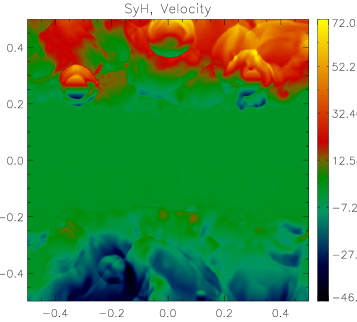
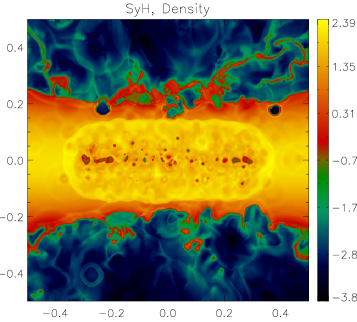
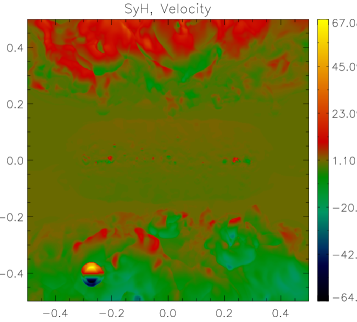
In this set of models we consider a disk galaxy with the setup (see Table 1), characterized by a total mass in the central half kpc3 of about 3 M⊙, a maximum density of 100 cm-3 and a column density = 2 cm-2. In this configuration the disk is thicker and more massive than in the previous setup, resembling the gas distribution observed in the nuclear region of Seyfert galaxies (Tombesi et al., 2013) and also of our own Galaxy (see, e.g., Vergani et al. 2004).
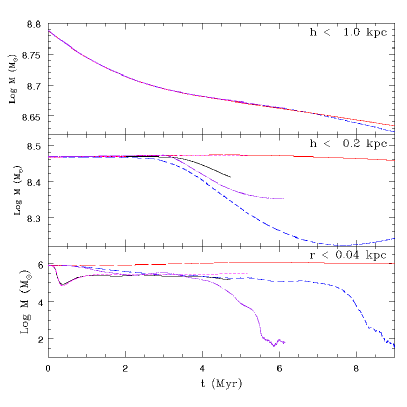
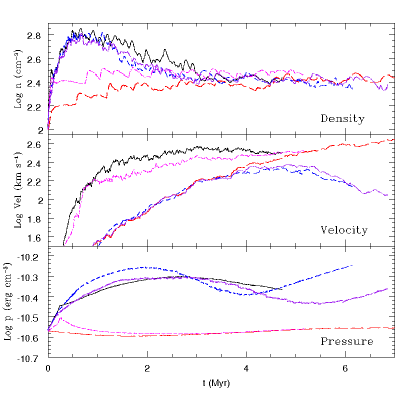
As in model SyM-SNI, in the model SyH-SNI the only energy source comes from the SNI explosions that alone are unable to remove the gas from the center of the galaxy (Fig. 11). The mass of the system is nearly constant over the maximum simulated time (9 Myr) and no significant mass transfer from the core of the galaxy to above the disk ( 200 pc) is detected, as depicted in Figures 12 and Fig. 13. Therefore, as expected, the thick disk in a nuclear region of a galaxy, even if completely photoionized by the central source (a SMBH in the case) and thus characterized by a minimum temperature of 104 K, is not destroyed or even partially removed by the SNI explosions, which however contribute for maintaining the turbulence of the ISM, mainly above the disk (Fig. 14).
5.2.2 SyH-SNI-SB
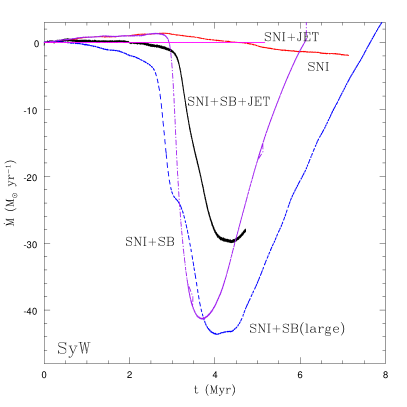
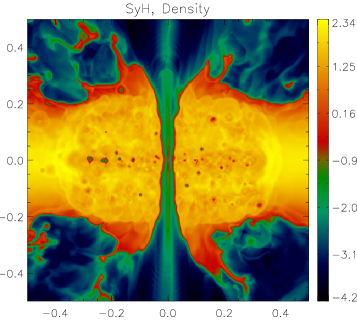
In this case the energy injected in the thick disk () comes from the SNI and SNII explosions associated to the bulge and to a SB region with a SFR of 1 M⊙ yr-1, respectively. Since the thick disk extends up to a height 180 pc, the stars within the SB region may be distributed in different ways. In this study we consider two different stellar distributions in a nuclear region with a radius = 300 pc. In one case they are uniformly distributed between a height -80 80 pc, while in the second case (here defined ) the stars are distributed with a power law between a height -160 160 pc and with = 160 pc, that is, the SB region is active throughout the thickness of the disk. We have calculated the disk evolution over a time of 9 Myr and we see that the global evolution is quite similar in both cases (Figs. 15 and 16). This means that the SNII vertical distribution, within the disk, is not so important as the total SNII number and/or the SNII density surface, and for this reason in the next models we will consider only the stellar distribution within the SB which is possibly a more realistic case.
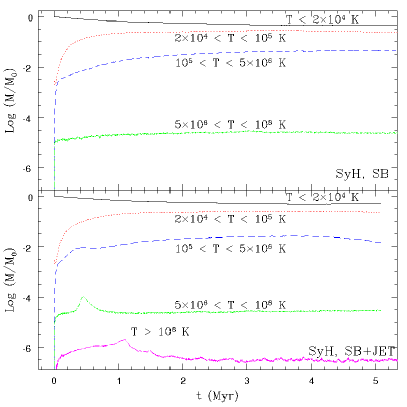
In both models above, after about 2.53 Myr, the gas energized by the SN explosions begins to rise from the disk to the halo at an average rate of 20 M⊙ yr-1, and a maximum rate of 45 M⊙ yr-1 at 4 Myr. Along 7 Myr the mass of the disk in the case decreases by about M⊙, that is, 30% of its initial mass is lifted above the denser disk to heights 200 pc. Similarly, when the SNII are uniformly distributed within a thinner region, the mass of the disk is reduced by 23%, with an active gas outflow starting at = 3 Myr and ending after 3 Myr (i.e., at = 6 Myr). Also the density, the pressure and the velocity evolutions are very similar in both cases (Fig. 14. The only difference is observed in the removal of gas from the nuclear region, clearly more efficient in model SyH-SNI-SB. In this case, all the gas is dispersed to larger radius, while in the case about 10% of the gas remains in the central 40 pc. However, these differences are not enough to affect the evolution of the system and we can state that the choice of the vertical distribution of the SNs does not seem to be so important in this study. Close to the midplane of the disk, the SB activity generates a 2-phase ISM characterized by a diffuse gas with density of cm-3 and temperature of about K, where dense clumps and filaments are embedded with a density of 10 cm-3 and temperature of 104 K.
Globally, the mass of the system here considered (with a kpc3 volume) decreases by about 107 M⊙ at an average rate of few M⊙ per year (top panel of Fig. 12), but since the region we have simulated extends only up to 500 pc (on each side of the disk), we are unable to predict the final fate of this gas, i.e., whether it will fall back to the disk or definitively leave the galaxy as a wind. An estimate of the inner galactic disk escape velocity () indicates that it is of the same order of the outflow velocity of part of the energized gas, so that both fates are possible.
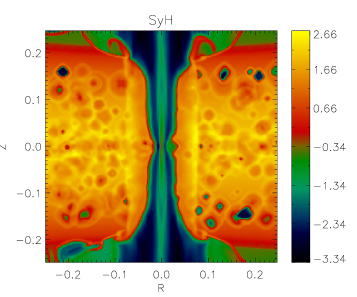
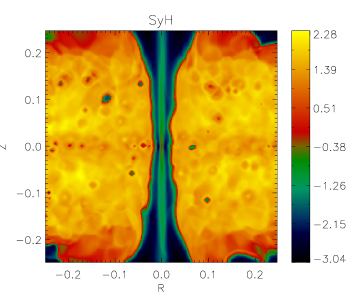
5.2.3 SyH-SNI-SB-JET
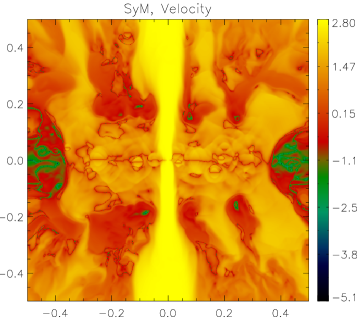
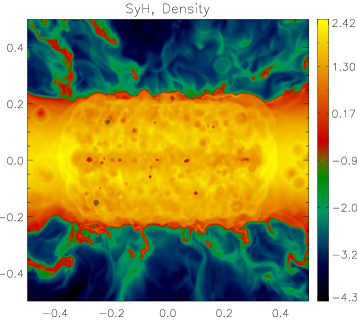
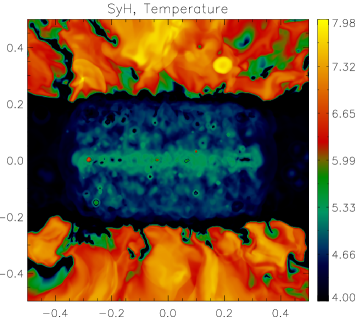
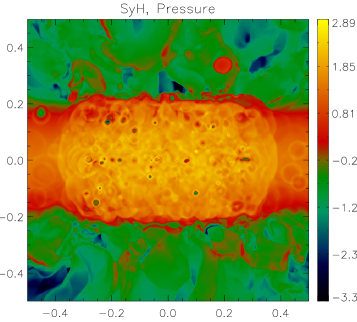
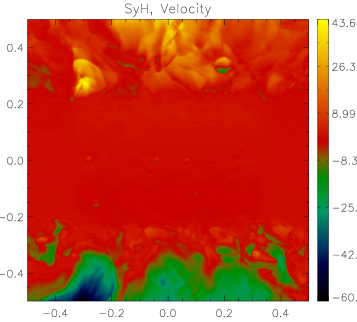
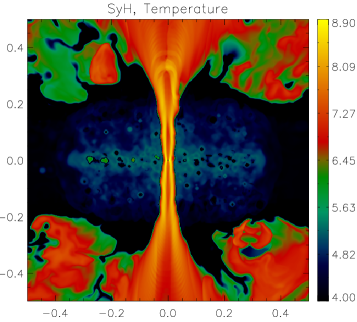
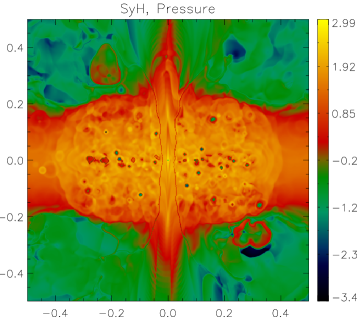
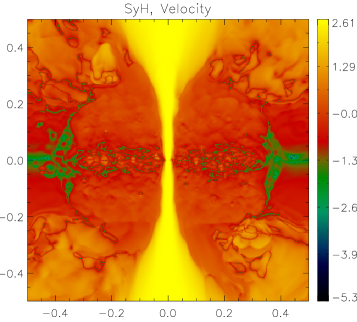
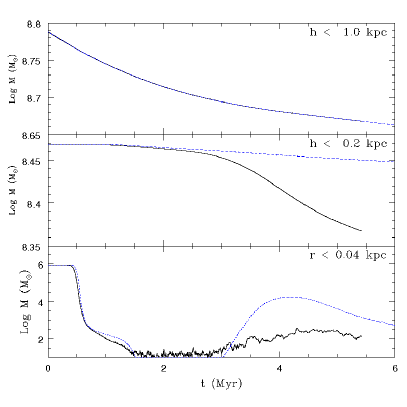
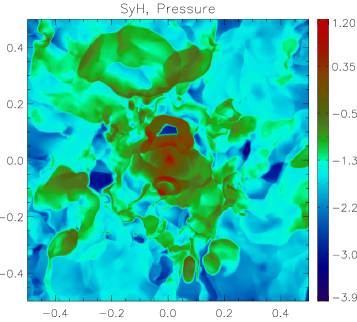
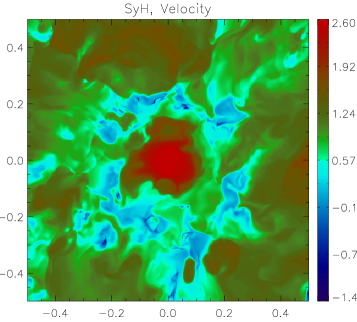
As in the study of the setup, this model has similar initial conditions to the previous one (SyH-SNI-SB), but includes also the presence of a highly collimated jet with the same characteristics described above (Table 1 and §4.2 4.2). We calculated the evolution of the system over a time of 6 Myr and the results are shown in Figures 12, 13, 14 (solid-black lines), and 17. Also in this case, the gas evolution does not differ much from the model above without the jet. The gas transport above the disk is somewhat less efficient than in the SyH-SNI-SB model, with a mean mass transfer rate of about 15 M⊙ yr-1 (and a maximum of 30 M⊙ yr-1), while in the central core of the disk, within 40 pc, about 90% of the gas is removed during the first 4 yr. due to the presence of the jet. However, this trend does not represent a steady state and we note that after 2 Myr the gas evolution is very similar to that of the previous model. Also the density, pressure and temperature evolution of the disk are comparable with those of the model SyH-SNI-SB , so that we may conclude that also in a system with properties that resemble those of a Seyfert galaxy with a thick disk, the SMBH jet is not expected to affect the global evolution of the gas in the inner regions, up to 500 pc.
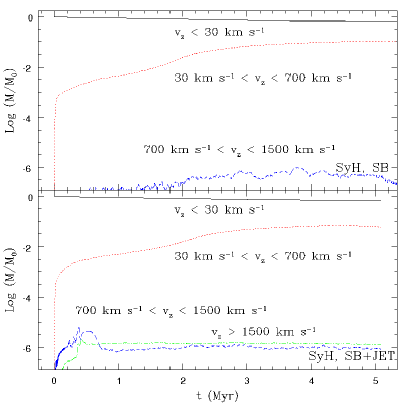
To understand better the evolution of this system SyH-SNI-SB-JET compared to the previous one without the jet (SyH-SNI-SB ), we have plotted in Figs. 18 and 19 the time evolution of the gas mass for different values of the vertical velocity and the temperature, respectively. We note that the gas mass related to a given velocity and temperature in the model including the jet represents only a few per cent of the total mass of the nuclear region. This explains why we see no significant differences in the gas evolution between the two models. In other words, though the presence of the jet may change a little the velocity and temperature profiles and thus the emission structure, it does not seem to be efficient enough to remove much gas at the galactic scales.
5.2.4 SyH-SNI-JET
To further stress the results and conclusions above and verify whether or not in the absence of a SB the remaining injecting mechanisms are still able to sweep large amounts of gas from the thick disk to the halo, we have also run a model including only the jet and the SNI. The magenta short-dashed lines of Figs. 12, 13 and 14 indicate that the only effect of the jet on the evolution of the system occurs in the nuclear region, within 40 pc, as in the previous model. No gas mass is transported to outside and no gas outflow from the disk to the halo is observed. The jet crosses the disk affecting it just in the very beginning of its evolution. After a few hundreds of thousands years the jet interaction with the disk ceases and it continues to flow freely through the low-density channel previously opened by it.
5.2.5 SyH-SNI-SB-JET-light
As remarked in §4.2, aiming at verifying how the characteristics of the jet can affect the evolution, we have also considered a jet with a relativistic velocity of 0.2 and a rate of injected matter of 5 M⊙ yr-1. In this case, though the jet speed, , is larger, the density contrast between the jet and the disk near the base is much smaller (=5.5) than in the previous model (SYH-SNI-SB-JET). Considering the momentum flux conservation at the shock that forms at the head of the jet, one can easily demonstrate that the jet propagation velocity into the disk, , depends both on the jet speed and the density contrast, i.e. (e.g. de Gouveia dal Pino & Benz, 1993). This indicates that the larger the density contrast and the jet speed the faster the jet propagates. For the model above with a light jet (SyH-SNI-SB-JET ), the much smaller density contrast gives a propagation velocity smaller than that of model SyH-SNI-SB-JET, in agreement with the results of the simulations (see Fig. 20). Thus the corresponding time scale to cross the disk, of about 0.4 Myr, is longer than in the previous model, during which a slow shock wave propagates into the disk transporting mass, momentum and heating to the ISM arising its temperature to about K (with peaks of 109 K).
However, after the jet breaks out into the halo the shock wave that propagates along the plane of the disk reaches a steady state, separating the low-density, high-temperature region where the jet propagates from the rest of the disk, within a distance of 80 pc from the center of the galaxy. This region is larger than that obtained in the previous simulation with a denser and slower jet (see Fig. 20), but this difference does not affect much the evolution of the disk and confirms the results obtained in the previous models, as we can see in Figures 21 and 22, where we compared the mass evolution and the mass loss rate of the models with (SyH-SNI-SB-JET ) and without (SyH-SNI-JET ) a SB region.
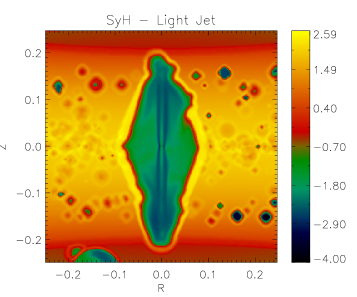
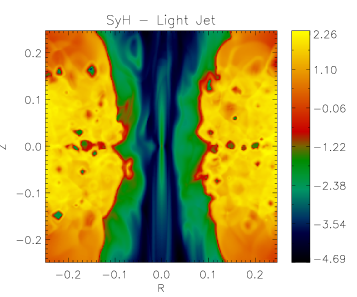
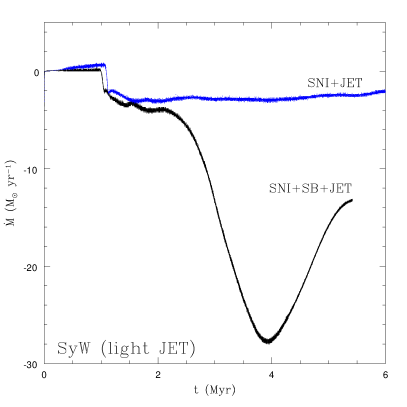
Furthermore, since the faster the jet crosses the disk less energy is deposited into the ISM of the host galaxy, the jet with the higher density contrast (SyH-SNI-SB-JET in Figure 20, right panels) produces a more collimated flow. On the other hand, the longer time of energy deposition into the disk by the lighter jet in SyH-SNI-SB-JET model due to the slower evolution, results a similar mass evolution to that of Model SyH-SNI-SB-JET, with differences of only a few M⊙ per year for the mass transfer rate of the thick disk and no significant differences in the mass loss rate of the whole system.
5.3. Seyfert galaxy models with higher SFR (10SB)
Finally, we have run models (not shown here) considering a SFR of the SB region 10 times higher than in the previous cases. We considered a setup with (SyH-SNI-10SB-JET model) and without (SyH-SNI-10SB model) the jet. These models were run either with higher or lower gas metallicity than the solar values666In the other models investigated here we employed solar metallicity. and with different SN distribution, considering both single and clustered SN explosions. We have found similar results between these tests, nearly independent of the metallicity (see, hoever, Melioli et al., 2009, 2013, 2015, for a more detail study on the effects of metalicity in galactic and SB winds), which are also consistent with those presented above. Of course, the mass transfer rate from the disk to the halo is higher and, almost insensitive to the presence of the jet, reaches a maximum value of 170 M⊙ yr-1 and a mean value of 90 M⊙ yr-1, resulting in a total mass exchange between the disk and the halo involving about 40% of the mass of the system. Moreover, the higher energy injected by the SB region increases the thermal pressure of the gas in the nuclear region and consequently, the channel dug by the jet is more confined and tighter. This result suggests that the higher the SFR and the column density of the disk, the greater is the collimation of the SMBH jet.
6. Discussion and conclusions
In this study our main goal was to understand the role of the collimated jet emerging from the center of a Seyfert-like galaxy in the development of a broader massive gas outflow in the nuclear region. In contrast to previous studies (e.g. Ciotti & Ostriker, 2007; Sijacki et al., 2007; Gaspari et al., 2011b; Fabian, 2012), we focused our attention on a small region of the host galaxy, characterized by a volume of 1 kpc3, and performed high resolution (1.9 pc) hydrodynamical simulations which helped us to distinguish the main driving mechanisms of the gas evolution.
It has long been recognized the importance of a SMBH jet in balancing cooling flows, inflating the X-ray cavities in the hot gas of galaxy cluster cores, or energizing the intergalactic medium (e.g., Boehringer et al., 1993; McNamara & Nulsen, 2007; Falceta-Gonçalves et al., 2010b, a; Gaspari et al., 2011b, a). However, all these processes act at large scales, from 10 kpc to 1 Mpc. Less explored is the importance of the jet feedback on the small scales of the host galaxy.
Considering a rotating disk gas distribution initially in equilibrium with the galaxy gravitational potential with a given column density, we explored the evolution of this distribution in the surrounds of the nuclear region over 10 Myr, taking into account, either separately or all together, the effects of star formation, SN explosions, and the jet. In general lines, we have found that the formation of turbulent and clumpy outflows in the nuclear region of Seyfert-like systems is mainly driven by intense star formation. The jet feedback at these scales is less relevant.
In the next paragraphs we discuss our main results and their implications for the evolution of the nuclear regions of Seyfert galaxies, the formation of a multiphase ISM, the gas outflow, and the jet feedback on the host galaxy.
6.1. Gas mass evolution and outflow collimation
In all models studied, the gas of the disk is carried out in an outflow only in presence of star formation activity, regardless of the column density of the host galaxy. Nor the regular activity in the bulge (mainly due to SNI explosions), nor the jet, or both together are able to drive gas outflow at the small scales, particularly after the first Myr, when the jet breaks through the disk and evolves along a low-density and high-temperature channel with a thickness of few tens of pc. We should stress, however, that we considered a radiative cooling optically thin gas and neglected the presence of dust and radiation pressure. Though this could be another driving mechanism, as remarked in §1 the typical gas column densities (between 1021 and cm−2) and the rapid destruction rate by SN shock waves make it unlikely the survival of substantial amounts of dust in Seyfert nuclear regions (see, e.g. McKee, 1989; Jones & Nuth, 2011). 777It is interesting to note that in a recent study, Gan et al. (2014) addressed the problem of the AGN feedback in the nuclear regions of elliptical galaxies, and argued that Compton scattering can heat the gas in the surroundings of the AGN to temperatures as high as K and for this reason have taken into account the effects of the AGN radiative feedback on the system. In their simulations (which are performed for two-dimensional flows that arise from the center with a large opening angle), they find that this heating process will dominate only in the central regions over radial extensions of about 10 to 30 pc. Similarly, in our simulations with AGN feedback, although we neglected explicitly the AGN Compton heating effect, we also find that the temperature grows to K within a radial extension up to 20-35 pc due to the AGN jet shock heating. Therefore, the extension of the influence of the AGN heating feedback found in both studies is essentially the same.
Though the analytical steady state approach indicates that the energy lost by radiative cooling in the denser regions of the disk would be high enough to balance the energy injected by the stellar feedback, thus preventing the formation of a galactic wind (see §3), the numerical hydrodynamical simulations have demonstrated that this steady state lasts only about 12 Myr, after which the gas begins to flow out of the disk. In fact, at the beginning of the simulations the gas in the disk remains unperturbed and homogeneous, and its behaviour follows the one described by the analytical solutions in §3. However, with the energy injection by the stellar feedback, shock waves propagate into the ISM and the system becomes highly non-steady. Shock heated, low density gas emerges from the disk and propagates into the stratified gas, transferring mass to heights greater than 200300 pc. The average mass transfer rate we obtained is between 3 and 25 M⊙ yr-1 for a SFR of 1 M⊙ yr-1 and a disk column density between and cm-2, and between 60 and 90 M⊙ yr-1 for a SFR of 10 M⊙ yr-1 and a disk column density between and cm-2. The gas outflow ends when about 5070% of the mass in the nuclear region (within a radius of 300 400 pc, is removed. At larger heights, the impact of the SN energy on the gas mass evolution is not so important. For instance, at a distance of 500 pc above the disk we find that the mass loss rate is only a few M⊙ yr-1 (for a SFR of 1 M⊙ yr-1) and this value is almost independent of the disk column density.
On the other hand, when considering only the propagation of the SMBH jet through the disk there is only a small fraction of gas removal from the core of the galaxy (within 40 pc), but no relevant amount is carried away by shock waves and/or by gas heating to generate a wind.
We have evaluated also the energy associated to the evolved outflow in the models and found that, in the cases without the AGN feedback, the kinetic power of the outflow increases to a value between (2 to 4) erg s-1, that is, about 6.5% to 13% of the stellar feedback luminosity. At the same time, the thermal (or internal) energy rate of the gas outflow increases to about erg s-1, that is, 3% of the stellar feedback luminosity. In other words, about 1520% of the stellar luminosity goes to the outflow, and the remaining 80% is radiated away. In the models where the jet feedback is included, we have obtained essentially the same luminosity values and for this reason we can conclude that we are observing a SF-driven wind.
The scenario would change completely in the case of an AGN outflow emerging with very large opening angles, as assumed, e.g., in Wagner et al. (2013). These authors (interested in exploring quasar-mode AGN feedback) have considered an AGN accretion disk outflow impinging into a very cloudy environment with a large opening angle of 30 degrees. In this case they find that the outflow can substantially affect the galactic ISM. Nevertheless, as in the present simulations, their AGN wind is injected within a scale of 2 pc. The only difference is that in our models the jet emerges very collimated, as expected, while in Wagner et al. (2013) the AGN disk wind is assumed to emerge largely uncollimated from the nuclear region. This lateral expansion may be due to the wind pressure (which in a quasar-mode AGN may be dominated by radiation) overcoming the external pressure (e.g., King, 2003; Crenshaw et al., 2003; Arav et al., 2005). However, as stressed, we expect that in the nuclear regions of the Seyferts this quasar-mode feedback and therefore, the development of strong AGN disk winds with large opening angles should be inoperative.
In summary, the nuclear galactic gas evolution of a Seyfert is almost insensitive to the passage of the AGN outflow and, as demonstrated above, it needs an intense and more widespread source of energy injection in the disk (as a high SFR) to increase the gas pressure and drive shock waves and turbulence that generate an expanding, multiphase ISM over 500 pc above the disk.
As discussed in §2, the soft X-ray emission in Seyferts is likely dominated by photoionized gas (e.g., Guainazzi et al., 2009). Its location, mass and momentum structure resembles a biconical outflow and it has been suggested that this might be an evidence of an AGN-driven wind (e.g., Longinotti et al., 2008; Evans et al., 2010). Nevertheless, a SB-driven outflow may also have a biconical shape above the disk (e.g. Melioli et al., 2013). Given the small scales here simulated it is difficult to reproduce the angle of gas escape, but the distribution of the kinetic energy that will be discussed in §6.3 provides useful information about the morphology of the gas outflow. We should also note that a new set of numerical simulations at intermediate scales ( 10 kpc) for these flows is in progress which will allow to identify more precisely these morphological features (Melioli et al. 2015, in prep.).
6.2. Multiphase ISM
The SN explosions and the development of shock waves into the ISM of the host galaxy determine the formation of a multiphase ambient where gas with different densities and temperatures coexists at a given pressure. Indeed, almost independently of the presence of a SMBH at the center of the galaxy, the stellar feedback generates naturally regions at high densities which cool fast, and regions where the passage of shock fronts leaves low density and very high temperature gas tracks. Thus a region characterized by a high SFR may inject enough energy to blow-out the gas from the disk and at the same time lead to the formation of clouds and clumps which can then be continuously generated and steadily carried away roughly preserving the total cloud number.
At the beginning of its evolution, right after launching, also the jet generates high density regions through a transverse shock wave that propagates radially until reaching an equilibrium position at about 2030 pc away from the galaxy center (see Figure 20, right panels). This shock wave initially induces some turbulence (as suggested by, e.g., Guillard et al., 2015; Alatalo et al., 2015) that may trigger either star formation or quenching depending on the shock strength and the ISM conditions (see, e.g., Melioli et al., 2006; Leão et al., 2009), but compared to the dynamical time scales of the system this strong interaction lasts too little (about 0.3 Myr) in our simulations and it is hard to predict whether or not it may have a major impact over the star formation history of the inner region of the galaxy. 888We should note that, in the case (not considered here) of an intermittent jet, this would naturally allow for a continuous repetition of events such as those described above, i.e., every time that the jet would resume, the digging of a new tunnel into the ISM would induce a new shock wave, turbulence and the boosting or the quenching of star formation, over the whole evolution of the galaxy or as long as the intermittent jet would survive.
Clouds and clumps are therefore continuously and mostly formed in the nuclear region of the galaxy by the fragmentation of the shocked gas compressed by the supernova shock fronts, and we verify that in our simulations about 30% of the gas mass goes to clouds characterized by high density, between 100 and 1000 cm-3. These clouds, that are photoionized by the central source (and by the stellar feedback too) and radially dragged out of the nuclear region mainly via ram-pressure, could be identified with the NLR observed in the Seyfert galaxy. On the other hand, we have found that the jet feedback alone is unable to produce a multiphase ambient and the dense clouds in the nuclear region of the host galaxy.
At a given distance from the source of high energy photons, these clouds may cool very fast to a temperature of few tens of K, since the cooling time is yr, where is the value of the cooling function in units of erg cm3 s-1 and is the gas density of the clouds in units of 103 cm-3. From our simulations we note that these clouds are moving at velocities between -30 and 300 km s-1, relative to the galaxy disk, depending on the height above the disk, and are characterized by a density contrast between 100 and 104, as shown in Figure 23.
The fact that some clouds have negative velocities implies that they may eventually fall back into the disk in a process that may resemble that of the galactic fountains (e.g. Melioli et al., 2008, 2009), while the clouds with positive velocities larger than the escape velocity can continue their journey through the halo. If dust forms in the way, it may eventually also originate molecular clouds, as recently observed, for example, in the western radio lobe of the Seyfert galaxy IC 5063 (Morganti et al., 2013). We note however, that in this system they detected clouds with higher velocities than those found in our simulations (which are around 1200 km s-1). This may be an indication that the observed clouds in this case could be produced in the SB-driven wind, as described above, and then dragged by the much faster jet flow. Another possibility is that they result from direct interactions of the jet head front with the dense environment. We actually see this interaction in the very beggining of the simulations (in the first 105 yr) when the jet breaks into the ISM for the first time and sweeps the interstelar matter (see also, e.g., Falceta-Gonçalves et al., in prep.).
6.3. Velocity distribution
The velocity distributions depicted in Figures 18 clearly show that one of the main differences between models with and without a SMBH jet is the gas with velocity signatures larger than 1500 km s-1. Depending on the column density of the disk of the host galaxy, the amount of very high velocity gas when a jet is present is between 5 and 20 times larger than in models without a jet. However, the fastest moving gas is concentrated around the jet and the gas mass with these very high velocities corresponds to about 500 1000 M⊙ only, an amount too low to be able to modify the overall evolution of the system, though it may influence in the drag of high velocity clouds (Morganti et al., 2013; Tombesi et al., 2015), as remarked in §6.2.
Therefore, we may conclude that the jet plays an important role in producing the very high gas velocities observed in the expanding nuclear regions of the Seyfert galaxies, but at the same time these velocities involve such a negligible amount of gas mass compared to the total amount in the outflow that it is unable to drive the gas exchange between the disk and the halo within the kpc scale.
According to recent observations (see §. 2 and references therein), we note that our results basically reproduce the structures of the gas outflow, that is, an extended gas outflow with systemic velocity around the nucleus having a broader biconical component perpendicular to the disk and an inner component due to the interaction between the jet and the galactic disk material.
Our simulations suggest that in order to achieve this structure, three different contributing factors are necessary: ) a diffuse region characterized by high SFR (or by a SB) which is responsible for the increase of thermal pressure, the driving of shock waves and the formation and acceleration of the denser features; ) a SMBH jet, responsible for a little fraction of very high velocity clouds and for the gas at very high temperatures (see Fig. 19); and ) the presence of high density gas within the thin disk (of the order of 102 cm-3) in order to constrain most of the SB driven gas outflow to the inner radii (since the SB activity is smaller in the outer radii) and allow the formation of the biconical shape as observed.
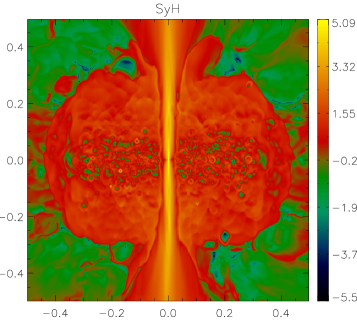
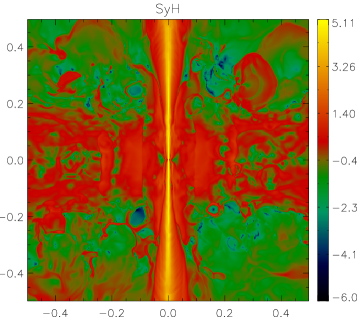
Figure 24 that depicts the edge-on logarithmic distribution of the kinetic energy of the gas for models SyH-SNI-JET and SyH-SNI-SB-JET (which differ only by the extension of the SB region), illustrates the scenario above. The gas along the jet is clearly at very high velocity, but its high collimation makes negligible the amount of kinetic energy that is transported from the disk to the halo at 500 pc. At the same time, the presence of a larger SB region causes an almost uniform expansion of the gas within 300500 pc from the center of the galaxy. In some regions the flow carries an amount of kinetic energy about 1000 times larger than that associated to the jet propagation only. This energy transfer causes the development of a nearly biconical gas outflow characterized by a width of 200 pc and an opening angle of 60∘ at = 400 pc.
We should also notice that several earlier studies have ruled out completely SF, or more specifically, SNe as the main source of wind feedback based on the high observed outflow speeds, larger than or around 600 km/s (e.g Maiolino et al., 2012; Fabian, 2012). However, our simulations indicate speeds between 700 and 1500 km/s even for models with no AGN feedback (see SyH-SNI-SB case in Fig. 18). As a matter of fact an individual SN-driven gas outflow is expected to have velocities of a few hundred km/s. However, these velocities are related to the colder, denser part the gas that is pushed by the external shock shell of the expanding bubble inflated by the SN itself. In a more complex system, like the one we are investigating here, the stellar feedback generates several SN bubbles that interact which each other giving rise to a complex multi-phase ambient formed by low velocity, high density gas mixed with low density, very high temperature gas moving at much higher speeds. The histogram of the gas density distribution versus velocity, in Figure 25, illustrates this point for the jetless model SyH-SNI-SB (upper diagram). We clearly see that the very small fraction of gas that is accelerated to velocities of about 1000 km/s has densities between 10-2 and 10-3 cm-3. In other words, the highest outflow speeds are related to a little fraction of gas at very low density and very high temperature. In the same Figure (bottom diagram), we see that the introduction of the jet increases a little the gas fraction in the high velocity tail (to values larger than km s-1), but the remainder of the gas behaves similarly as the jetless model (see also Figures 18 and 27, bottom-right panel).
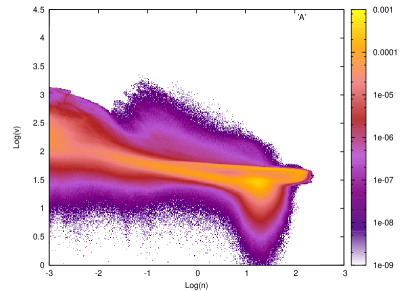
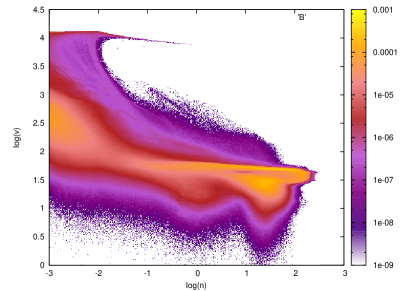
calculated considering every cell within the whole simulated system for the models SyH-SNI-SB (top panel) and SyH-SNI-SB-JET (bottom panel) at a time t=5 Myr. Velocities are in units of km s-1 (logarithmic scale) and densities are in units of cm-3 (logarithmic scale). The colour bar indicates the cell number normalized to their total number.
6.4. Conclusions
In summary our results indicate that:
-
•
The nuclear galactic gas evolution of a Seyfert is almost insensitive to the passage of the jet and it needs an intense and more widespread source of energy injection in the disk to increase the gas pressure and drive shock waves and turbulence;
-
•
The SN explosions and the development of shock waves into the ISM of the host galaxy determine the formation of a multiphase ambient, and therefore a SB and/or a region with high SFR may inject enough energy to blow-out the gas from the disk and at the same time lead to the formation of clouds and clumps which can be continuously generated and steadily carried away. Therefore, we may roughly expect a preservation of the total cloud number;
-
•
The fact that some clouds have negative velocities implies that they may eventually fall back into the disk, while the clouds with positive velocities larger than the escape velocity can continue their journey through the halo. If dust forms in the way, it may eventually also originate molecular clouds;
-
•
The velocity distribution reproduced by our simulations clearly show that one of the main differences between models with and without a SMBH jet is the presence of gas with velocity signatures larger than 1500 km s-1. Depending on the column density of the disk of the host galaxy, the amount of very high velocity gas when a jet is present is between 5 and 20 times larger than in models without a jet;
-
•
The jet plays an important role in producing the very high gas velocities observed in the expanding nuclear regions of the Seyfert galaxies, but at the same time these velocities involve such a negligible amount of gas mass (compared to the total amount in the outflow) that it is unable to drive the gas evolution within the kpc scale. Nevertheless, they may be responsible for recent observed high velocity features in Seyfert and ULIRGs (e.g. Morganti et al., 2013; Tombesi et al., 2015);
-
•
Our results basically reproduce the structures of the gas outflow, that is, an extended gas outflow with systemic velocity around the nucleus having a broader biconical component perpendicular to the disk and an inner component due to the interaction between the jet and the galactic disk material.
Finally, we should remark that we have neglected the effects of magnetic fields in the present study. Although they are known to be particularly important in the formation and propagation of the jet outflow, we have neglected their effects here for simplicity. Nevertheless, we may expect that its presence would not affect much the overall conclusions of this work. In fact, the inclusion of magnetic fields in the shaping of the jet would help on one side to confine the beam even more in the central narrow channel, therefore further constraining its interaction with the surroundings. On the other side, the enhanced collimation and magneto-centrifugal acceleration implied by the presence of magnetic fields in the jet would help to push captured clumps from the underlying star-formation driven wind to much higher speeds as those suggested by the recent observations mentioned above.
Acknowledgements
This work has been partially supported by the Brazilian Funding Agencies FAPESP (CM grant 2011/22078-6, and EMGDP grant 2013/10559-5) and CNPq (EMGDP grant 300083/94 − 7). The authors also acknowledge useful comments and advices of G. Kowal on the numerical code. We are also indebted to an (anonymous) referee and to R. Morganti and F. Tombesi for their profitable comments and insightful suggestions that have greatly helped to improve this manuscript. The numerical simulations were performed in the cluster of the Laboratory of Astro-informatics of the Astronomy Department of IAG-USP (FAPESP (grant 2009/54006-4) and the cluster GAAE of the High Energy and Plasma Astrophysics group of IAG-USP.
Appendix A Seyfert galaxy models with low column density (SyL)
We have also run numerical models considering the presence (or not) of SNI, SB and JET in a disk galaxy characterized by lower values of the column density (SyL). The results are consistent with those presented above, and the gas evolution in the disk is completely driven by the SB, as can be seen in Fig. 26, where the gas density evolution for each model (SyL-SNI, SyL-SNI-SB, SyL-SNI-SB-JET and SyL-SNI-JET) at =1.5 Myr is shown.
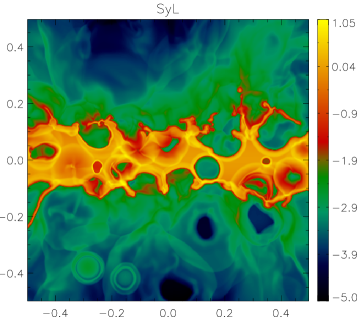
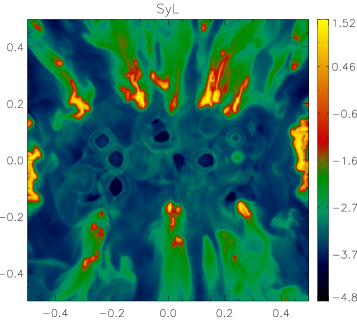
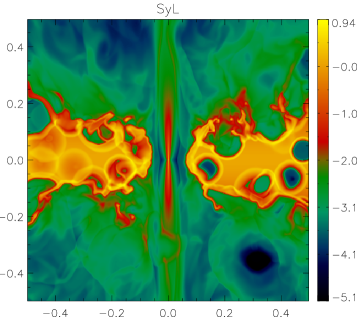
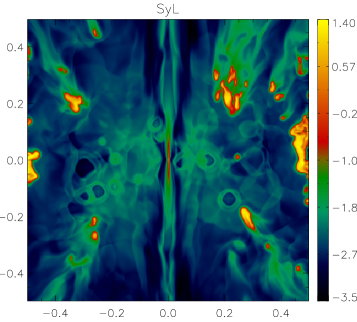
Examining Figure 27 we note that when a SB region is active, regardless of the presence of a SMBH jet, the mean mass transfer rate from the the disk is about 3 M⊙ yr-1 over a time of 2 Myr, resulting in a net total gas mass lost by the system of about 2 M⊙. Also the velocity distribution, shown in bottom-right panel of Fig. 27, confirms the great similarity between the two models with and without the SMBH jet. Both models lost about 40% of their mass, and have about 95% of the remaining mass characterized by the same velocity profile.
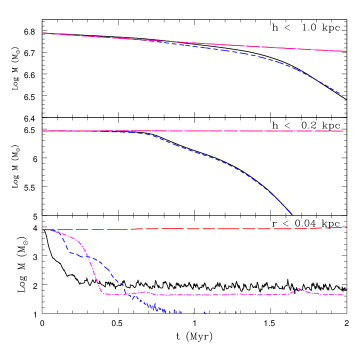
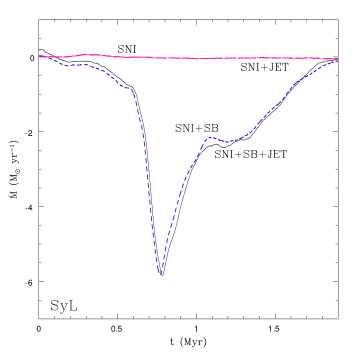
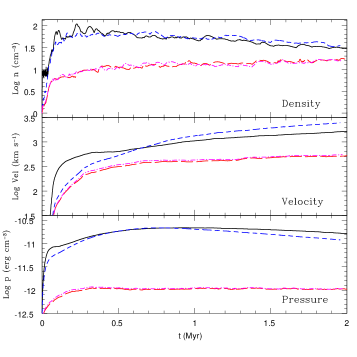
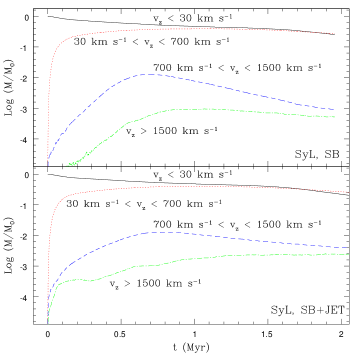
References
- Aalto et al. (2012) Aalto, S., Muller, S., Sakamoto, K., et al. 2012, A&A, 546, A68
- Alatalo et al. (2015) Alatalo, K., Lacy, M., Lanz, L., et al. 2015, ApJ, 798, 31
- Arav et al. (2005) Arav, N., Kaastra, J., Kriss, G. A., et al. 2005, ApJ, 620, 665
- Axon et al. (1998) Axon, D. J., Marconi, A., Capetti, A., et al. 1998, ApJ, 496, L75
- Bennert et al. (2006a) Bennert, N., Jungwiert, B., Komossa, S., Haas, M., & Chini, R. 2006a, A&A, 459, 55
- Bennert et al. (2006b) —. 2006b, A&A, 456, 953
- Binney (2004) Binney, J. 2004, MNRAS, 347, 1093
- Boehringer et al. (1993) Boehringer, H., Voges, W., Fabian, A. C., Edge, A. C., & Neumann, D. M. 1993, MNRAS, 264, L25
- Booth et al. (2013) Booth, C. M., Agertz, O., Kravtsov, A. V., & Gnedin, N. Y. 2013, ApJ, 777, L16
- Cicone et al. (2014) Cicone, C., Maiolino, R., Sturm, E., et al. 2014, A&A, 562, A21
- Ciotti & Ostriker (2001) Ciotti, L., & Ostriker, J. P. 2001, ApJ, 551, 131
- Ciotti & Ostriker (2007) —. 2007, ApJ, 665, 1038
- Ciotti et al. (2010) Ciotti, L., Ostriker, J. P., & Proga, D. 2010, ApJ, 717, 708
- Crenshaw et al. (2003) Crenshaw, D. M., Kraemer, S. B., & George, I. M. 2003, ARA&A, 41, 117
- Croton et al. (2006) Croton, D. J., Springel, V., White, S. D. M., et al. 2006, MNRAS, 365, 11
- de Gouveia dal Pino & Benz (1993) de Gouveia dal Pino, E. M., & Benz, W. 1993, ApJ, 410, 686
- Dettmar (1990) Dettmar, R.-J. 1990, A&A, 232, L15
- Di Matteo et al. (2005) Di Matteo, T., Springel, V., & Hernquist, L. 2005, Nature, 433, 604
- Dopita et al. (2002) Dopita, M. A., Groves, B. A., Sutherland, R. S., Binette, L., & Cecil, G. 2002, ApJ, 572, 753
- Erwin & Sparke (1999) Erwin, P., & Sparke, L. S. 1999, ApJ, 521, L37
- Evans et al. (2010) Evans, D. A., Ogle, P. M., Marshall, H. L., et al. 2010, in Astronomical Society of the Pacific Conference Series, Vol. 427, Accretion and Ejection in AGN: a Global View, ed. L. Maraschi, G. Ghisellini, R. Della Ceca, & F. Tavecchio, 97
- Everett et al. (2008) Everett, J. E., Zweibel, E. G., Benjamin, R. A., et al. 2008, ApJ, 674, 258
- Fabian (2012) Fabian, A. C. 2012, ARA&A, 50, 455
- Falceta-Gonçalves et al. (2010a) Falceta-Gonçalves, D., Caproni, A., Abraham, Z., Teixeira, D. M., & de Gouveia Dal Pino, E. M. 2010a, ApJ, 713, L74
- Falceta-Gonçalves et al. (2010b) Falceta-Gonçalves, D., de Gouveia Dal Pino, E. M., Gallagher, J. S., & Lazarian, A. 2010b, ApJ, 708, L57
- Falceta-Gonçalves et al. (2008) Falceta-Gonçalves, D., Lazarian, A., & Kowal, G. 2008, ApJ, 679, 537
- Faucher-Giguère & Quataert (2012) Faucher-Giguère, C.-A., & Quataert, E. 2012, MNRAS, 425, 605
- Fischer et al. (2010) Fischer, T. C., Crenshaw, D. M., Kraemer, S. B., Schmitt, H. R., & Trippe, M. L. 2010, AJ, 140, 577
- Forbes & Norris (1998) Forbes, D. A., & Norris, R. P. 1998, MNRAS, 300, 757
- Fraquelli et al. (2000) Fraquelli, H. A., Storchi-Bergmann, T., & Binette, L. 2000, ApJ, 532, 867
- Fraquelli et al. (2003) Fraquelli, H. A., Storchi-Bergmann, T., & Levenson, N. A. 2003, MNRAS, 341, 449
- Gan et al. (2014) Gan, Z., Yuan, F., Ostriker, J. P., Ciotti, L., & Novak, G. S. 2014, ApJ, 789, 150
- García-Lorenzo et al. (2001) García-Lorenzo, B., Arribas, S., & Mediavilla, E. 2001, A&A, 378, 787
- Gaspari et al. (2011a) Gaspari, M., Brighenti, F., D’Ercole, A., & Melioli, C. 2011a, MNRAS, 415, 1549
- Gaspari et al. (2012) Gaspari, M., Brighenti, F., & Temi, P. 2012, MNRAS, 424, 190
- Gaspari et al. (2011b) Gaspari, M., Melioli, C., Brighenti, F., & D’Ercole, A. 2011b, MNRAS, 411, 349
- Genzel et al. (2014) Genzel, R., Förster Schreiber, N. M., Rosario, D., et al. 2014, ApJ, 796, 7
- Groves et al. (2004) Groves, B. A., Dopita, M. A., & Sutherland, R. S. 2004, ApJS, 153, 9
- Guainazzi et al. (2009) Guainazzi, M., Risaliti, G., Nucita, A., et al. 2009, A&A, 505, 589
- Guillard et al. (2015) Guillard, P., Boulanger, F., Lehnert, M. D., et al. 2015, A&A, 574, A32
- Haehnelt (1995) Haehnelt, M. G. 1995, MNRAS, 273, 249
- Häring & Rix (2004) Häring, N., & Rix, H.-W. 2004, ApJ, 604, L89
- Heckman et al. (1990) Heckman, T. M., Armus, L., & Miley, G. K. 1990, ApJS, 74, 833
- Hill et al. (2014) Hill, A. S., Benjamin, R. A., Haffner, L. M., Gostisha, M. C., & Barger, K. A. 2014, ApJ, 787, 106
- Hopkins et al. (2011) Hopkins, P. F., Quataert, E., & Murray, N. 2011, MNRAS, 417, 950
- Hopkins et al. (2012) —. 2012, MNRAS, 421, 3522
- Johansson et al. (2009) Johansson, P. H., Naab, T., & Burkert, A. 2009, ApJ, 690, 802
- Jones & Nuth (2011) Jones, A. P., & Nuth, J. A. 2011, A&A, 530, A44
- Kennicutt (1998) Kennicutt, Jr., R. C. 1998, ApJ, 498, 541
- Khachikian & Weedman (1974) Khachikian, E. Y., & Weedman, D. W. 1974, ApJ, 192, 581
- King (2003) King, A. 2003, ApJ, 596, L27
- Kowal et al. (2007) Kowal, G., Lazarian, A., & Beresnyak, A. 2007, ApJ, 658, 423
- Kraemer & Crenshaw (2000a) Kraemer, S. B., & Crenshaw, D. M. 2000a, ApJ, 532, 256
- Kraemer & Crenshaw (2000b) —. 2000b, ApJ, 544, 763
- Kraemer et al. (2000) Kraemer, S. B., Crenshaw, D. M., Hutchings, J. B., et al. 2000, ApJ, 531, 278
- Laine et al. (2003) Laine, S., van der Marel, R. P., Rossa, J., et al. 2003, AJ, 126, 2717
- Leão et al. (2009) Leão, M. R. M., de Gouveia Dal Pino, E. M., Falceta-Gonçalves, D., Melioli, C., & Geraissate, F. G. 2009, MNRAS, 394, 157
- Leão et al. (2013) Leão, M. R. M., de Gouveia Dal Pino, E. M., Santos-Lima, R., & Lazarian, A. 2013, ApJ, 777, 46
- Longinotti et al. (2008) Longinotti, A. L., Nucita, A., Santos-Lleo, M., & Guainazzi, M. 2008, A&A, 484, 311
- Mac Low & Klessen (2004) Mac Low, M.-M., & Klessen, R. S. 2004, Reviews of Modern Physics, 76, 125
- Maiolino et al. (2012) Maiolino, R., Gallerani, S., Neri, R., et al. 2012, MNRAS, 425, L66
- Martin (2005) Martin, C. L. 2005, ApJ, 621, 227
- McKee (1989) McKee, C. 1989, in IAU Symposium, Vol. 135, Interstellar Dust, ed. L. J. Allamandola & A. G. G. M. Tielens, 431
- McKee (1995) McKee, C. F. 1995, in Astronomical Society of the Pacific Conference Series, Vol. 80, The Physics of the Interstellar Medium and Intergalactic Medium, ed. A. Ferrara, C. F. McKee, C. Heiles, & P. R. Shapiro, 292
- McKee & Ostriker (1977) McKee, C. F., & Ostriker, J. P. 1977, ApJ, 218, 148
- McNamara & Nulsen (2007) McNamara, B. R., & Nulsen, P. E. J. 2007, ARA&A, 45, 117
- Melioli et al. (2015) Melioli, C., Brighenti, F., & D’Ercole, A. 2015, MNRAS, 446, 299
- Melioli et al. (2008) Melioli, C., Brighenti, F., D’Ercole, A., & de Gouveia Dal Pino, E. M. 2008, MNRAS, 388, 573
- Melioli et al. (2009) —. 2009, MNRAS, 399, 1089
- Melioli & de Gouveia Dal Pino (2004) Melioli, C., & de Gouveia Dal Pino, E. M. 2004, A&A, 424, 817
- Melioli et al. (2006) Melioli, C., de Gouveia Dal Pino, E. M., de La Reza, R., & Raga, A. 2006, MNRAS, 373, 811
- Melioli et al. (2013) Melioli, C., de Gouveia Dal Pino, E. M., & Geraissate, F. G. 2013, MNRAS, 430, 3235
- Melioli et al. (2005) Melioli, C., de Gouveia dal Pino, E. M., & Raga, A. 2005, A&A, 443, 495
- Miyamoto & Nagai (1975) Miyamoto, M., & Nagai, R. 1975, PASJ, 27, 533
- Morganti et al. (2013) Morganti, R., Frieswijk, W., Oonk, R. J. B., Oosterloo, T., & Tadhunter, C. 2013, A&A, 552, L4
- Müller-Sánchez et al. (2011) Müller-Sánchez, F., Prieto, M. A., Hicks, E. K. S., et al. 2011, ApJ, 739, 69
- Murray et al. (2005) Murray, N., Quataert, E., & Thompson, T. A. 2005, ApJ, 618, 569
- Navarro et al. (1996) Navarro, J. F., Frenk, C. S., & White, S. D. M. 1996, ApJ, 462, 563
- Novak et al. (2011) Novak, G. S., Ostriker, J. P., & Ciotti, L. 2011, ApJ, 737, 26
- Nugis & Lamers (2000) Nugis, T., & Lamers, H. J. G. L. M. 2000, A&A, 360, 227
- Ostriker et al. (2010) Ostriker, J. P., Choi, E., Ciotti, L., Novak, G. S., & Proga, D. 2010, ApJ, 722, 642
- Pain et al. (1996) Pain, R., Hook, I. M., Deustua, S., et al. 1996, ApJ, 473, 356
- Plummer (1911) Plummer, H. C. 1911, MNRAS, 71, 460
- Pogge & Martini (2002) Pogge, R. W., & Martini, P. 2002, ApJ, 569, 624
- Raga et al. (2002) Raga, A. C., de Gouveia Dal Pino, E. M., Noriega-Crespo, A., Mininni, P. D., & Velázquez, P. F. 2002, A&A, 392, 267
- Raga et al. (2000) Raga, A. C., Navarro-González, R., & Villagrán-Muniz, M. 2000, Rev. Mexicana Astron. Astrofis., 36, 67
- Santos-Lima et al. (2010) Santos-Lima, R., Lazarian, A., de Gouveia Dal Pino, E. M., & Cho, J. 2010, ApJ, 714, 442
- Schawinski et al. (2007) Schawinski, K., Thomas, D., Sarzi, M., et al. 2007, MNRAS, 382, 1415
- Seyfert (1943) Seyfert, C. K. 1943, ApJ, 97, 28
- Shapley et al. (2003) Shapley, A. E., Steidel, C. C., Pettini, M., & Adelberger, K. L. 2003, ApJ, 588, 65
- Sharma et al. (2011) Sharma, M., Nath, B. B., & Shchekinov, Y. 2011, ApJ, 736, L27
- Sijacki et al. (2007) Sijacki, D., Springel, V., Di Matteo, T., & Hernquist, L. 2007, MNRAS, 380, 877
- Simões Lopes et al. (2007) Simões Lopes, R. D., Storchi-Bergmann, T., de Fátima Saraiva, M., & Martini, P. 2007, ApJ, 655, 718
- Springel et al. (2005) Springel, V., Di Matteo, T., & Hernquist, L. 2005, MNRAS, 361, 776
- Storchi-Bergmann et al. (2010) Storchi-Bergmann, T., Lopes, R. D. S., McGregor, P. J., et al. 2010, MNRAS, 402, 819
- Storchi-Bergmann et al. (2009) Storchi-Bergmann, T., McGregor, P. J., Riffel, R. A., et al. 2009, MNRAS, 394, 1148
- Thompson et al. (2005) Thompson, T. A., Quataert, E., & Murray, N. 2005, ApJ, 630, 167
- Tombesi et al. (2013) Tombesi, F., Cappi, M., Reeves, J. N., et al. 2013, MNRAS, 430, 1102
- Tombesi et al. (2015) Tombesi, F., Melendez, M., Veilleux, S., et al. 2015, ArXiv e-prints, arXiv:1501.07664
- Veilleux (1991) Veilleux, S. 1991, ApJ, 369, 331
- Wagner et al. (2012) Wagner, A. Y., Bicknell, G. V., & Umemura, M. 2012, ApJ, 757, 136
- Wagner et al. (2013) Wagner, A. Y., Umemura, M., & Bicknell, G. V. 2013, ApJ, 763, L18
- Winge et al. (1997) Winge, C., Axon, D. J., Macchetto, F. D., & Capetti, A. 1997, ApJ, 487, L121
- Zubovas & King (2012) Zubovas, K., & King, A. 2012, ApJ, 745, L34