SF2A 2015
Transit-Depth Metallicity Correlation: A Bayesian Approach
Abstract
A negative correlation was previously reported between the transit depth of Kepler’s Q1-Q12 gas giant candidates and the stellar metallicity. In this present work, we revisit this correlation to better understand the role of the stellar metallicity in the formation of giant planets, in particular, to investigate the effect of the metallicity on the transit depth. We selected the 82 confirmed giant planets from the cumulative catalogue. This is the first large and homogenous sample of confirmed giant planets used to study this correlation. Such samples are suitable to perform robust statistical analysis. We present the first hierarchical Bayesian linear regression model to revise this correlation. The advantages of using a Bayesian framework are to incorporate measurement errors in the model and to quantify both the intrinsic scatter and the uncertainties on the parameters of the model. Our statistical analysis reveals no correlation between the transit depth of confirmed giant planets and the stellar metallicity.
keywords:
planets and satellites: gaseous planets, stars: solar-type, methods: statistical1 Introduction
NASA’s Kepler mission has revolutionized the field of extrasolar planets and now, more than ever, it is possible to put statistical constraints on the observed planet properties and on the theories of planet formation. Thousands of exoplanets have been discovered by Kepler which allows one to look at the planets as a population and not as single planets. Clues on the nature of giant planet formation might be revealed from observational trends. With such large and homogenous samples, it is now possible to compare observed correlations to theories. Dodson-Robinson (2012, hereafter DR12) reported a negative correlation between the transit depth of Kepler’s gas giant planets and the metallicity of the host star. DR12’s sample consisted of 213 giant candidates with estimated radii of . The author argued that her sample may be contaminated by false positives and interpreted the result as evidence that metal-rich planets of a given mass are denser than their metal-poor counterparts, leading to smaller radii (Fortney & Nettelmann 2010). DR12 did not include in her statistical analysis the uncertainties on the transit depth and on the stellar metallicity although they are very important and could bias the result. In this present work and in order not to contaminate our sample with false positives, we revise the transit depth - metallicity correlation for all the confirmed giant planets detected by Kepler. Moreover, we use Bayesian statistics to incorporate the measurement uncertainties in our analysis.
2 Sample Selection
For this study we used the cumulative catalog of planets detected by the NASA Kepler mission which, as of April 2015, consisted of the latest Q1-Q16 catalog (Mullally et al. 2015). Following Dodson-Robinson (2012), we define gas giant planets as planets that have a radius between . We selected only the planets with a SNR to avoid KOIs (or Kepler Objects of Interest) with noisy lightcurves. The stellar parameters were taken from the Kepler stellar Q1-Q16 database (Huber et al. 2014). We ended up with a sample of 373 giant planets of which 82 are confirmed gas giant exoplanets. Note that the stellar and the planetary parameters provided by Kepler’s catalog have asymmetric upper and lower uncertainties. To get the 1 error bar we calculated their average.
3 The Method: Hierarchical Bayesian Modeling
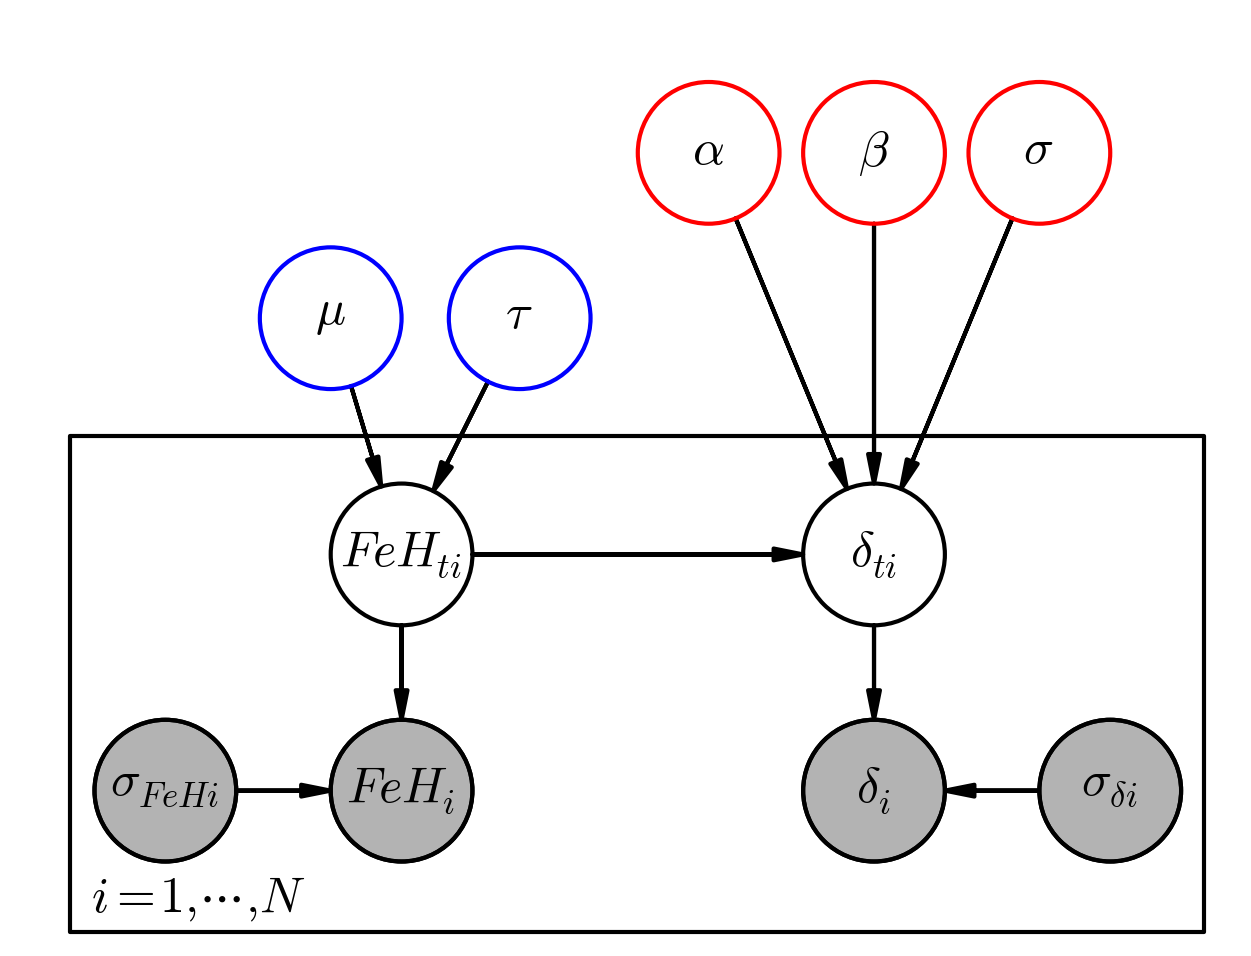
Hierarchical Bayesian Modeling (hereafter HBM) allows us to derive the uncertainties on the model parameters and to relate the observed data to the true unobserved data. Following Kelly (2007), we constructed the likelihood function in a simple way to relate the parameters of interest to the observed data taking into account the measurement uncertainties. We used this method to study the correlation between the transit depth () and the metallicity () of the host star. A graphical model of our hierarchical model is given in Fig. 1. Markov Chain Monte Carlo (hereafter MCMC) was performed using the python package PySTAN***http://mc-stan.org/, a package for Bayesian inference. We ran the model with 4 Markov Chains, each of 5,000 iterations. The first 50% of each chain were discarded as “burn-in” and the remaining samples were combined ending up with 10,000 samples.
4 Results
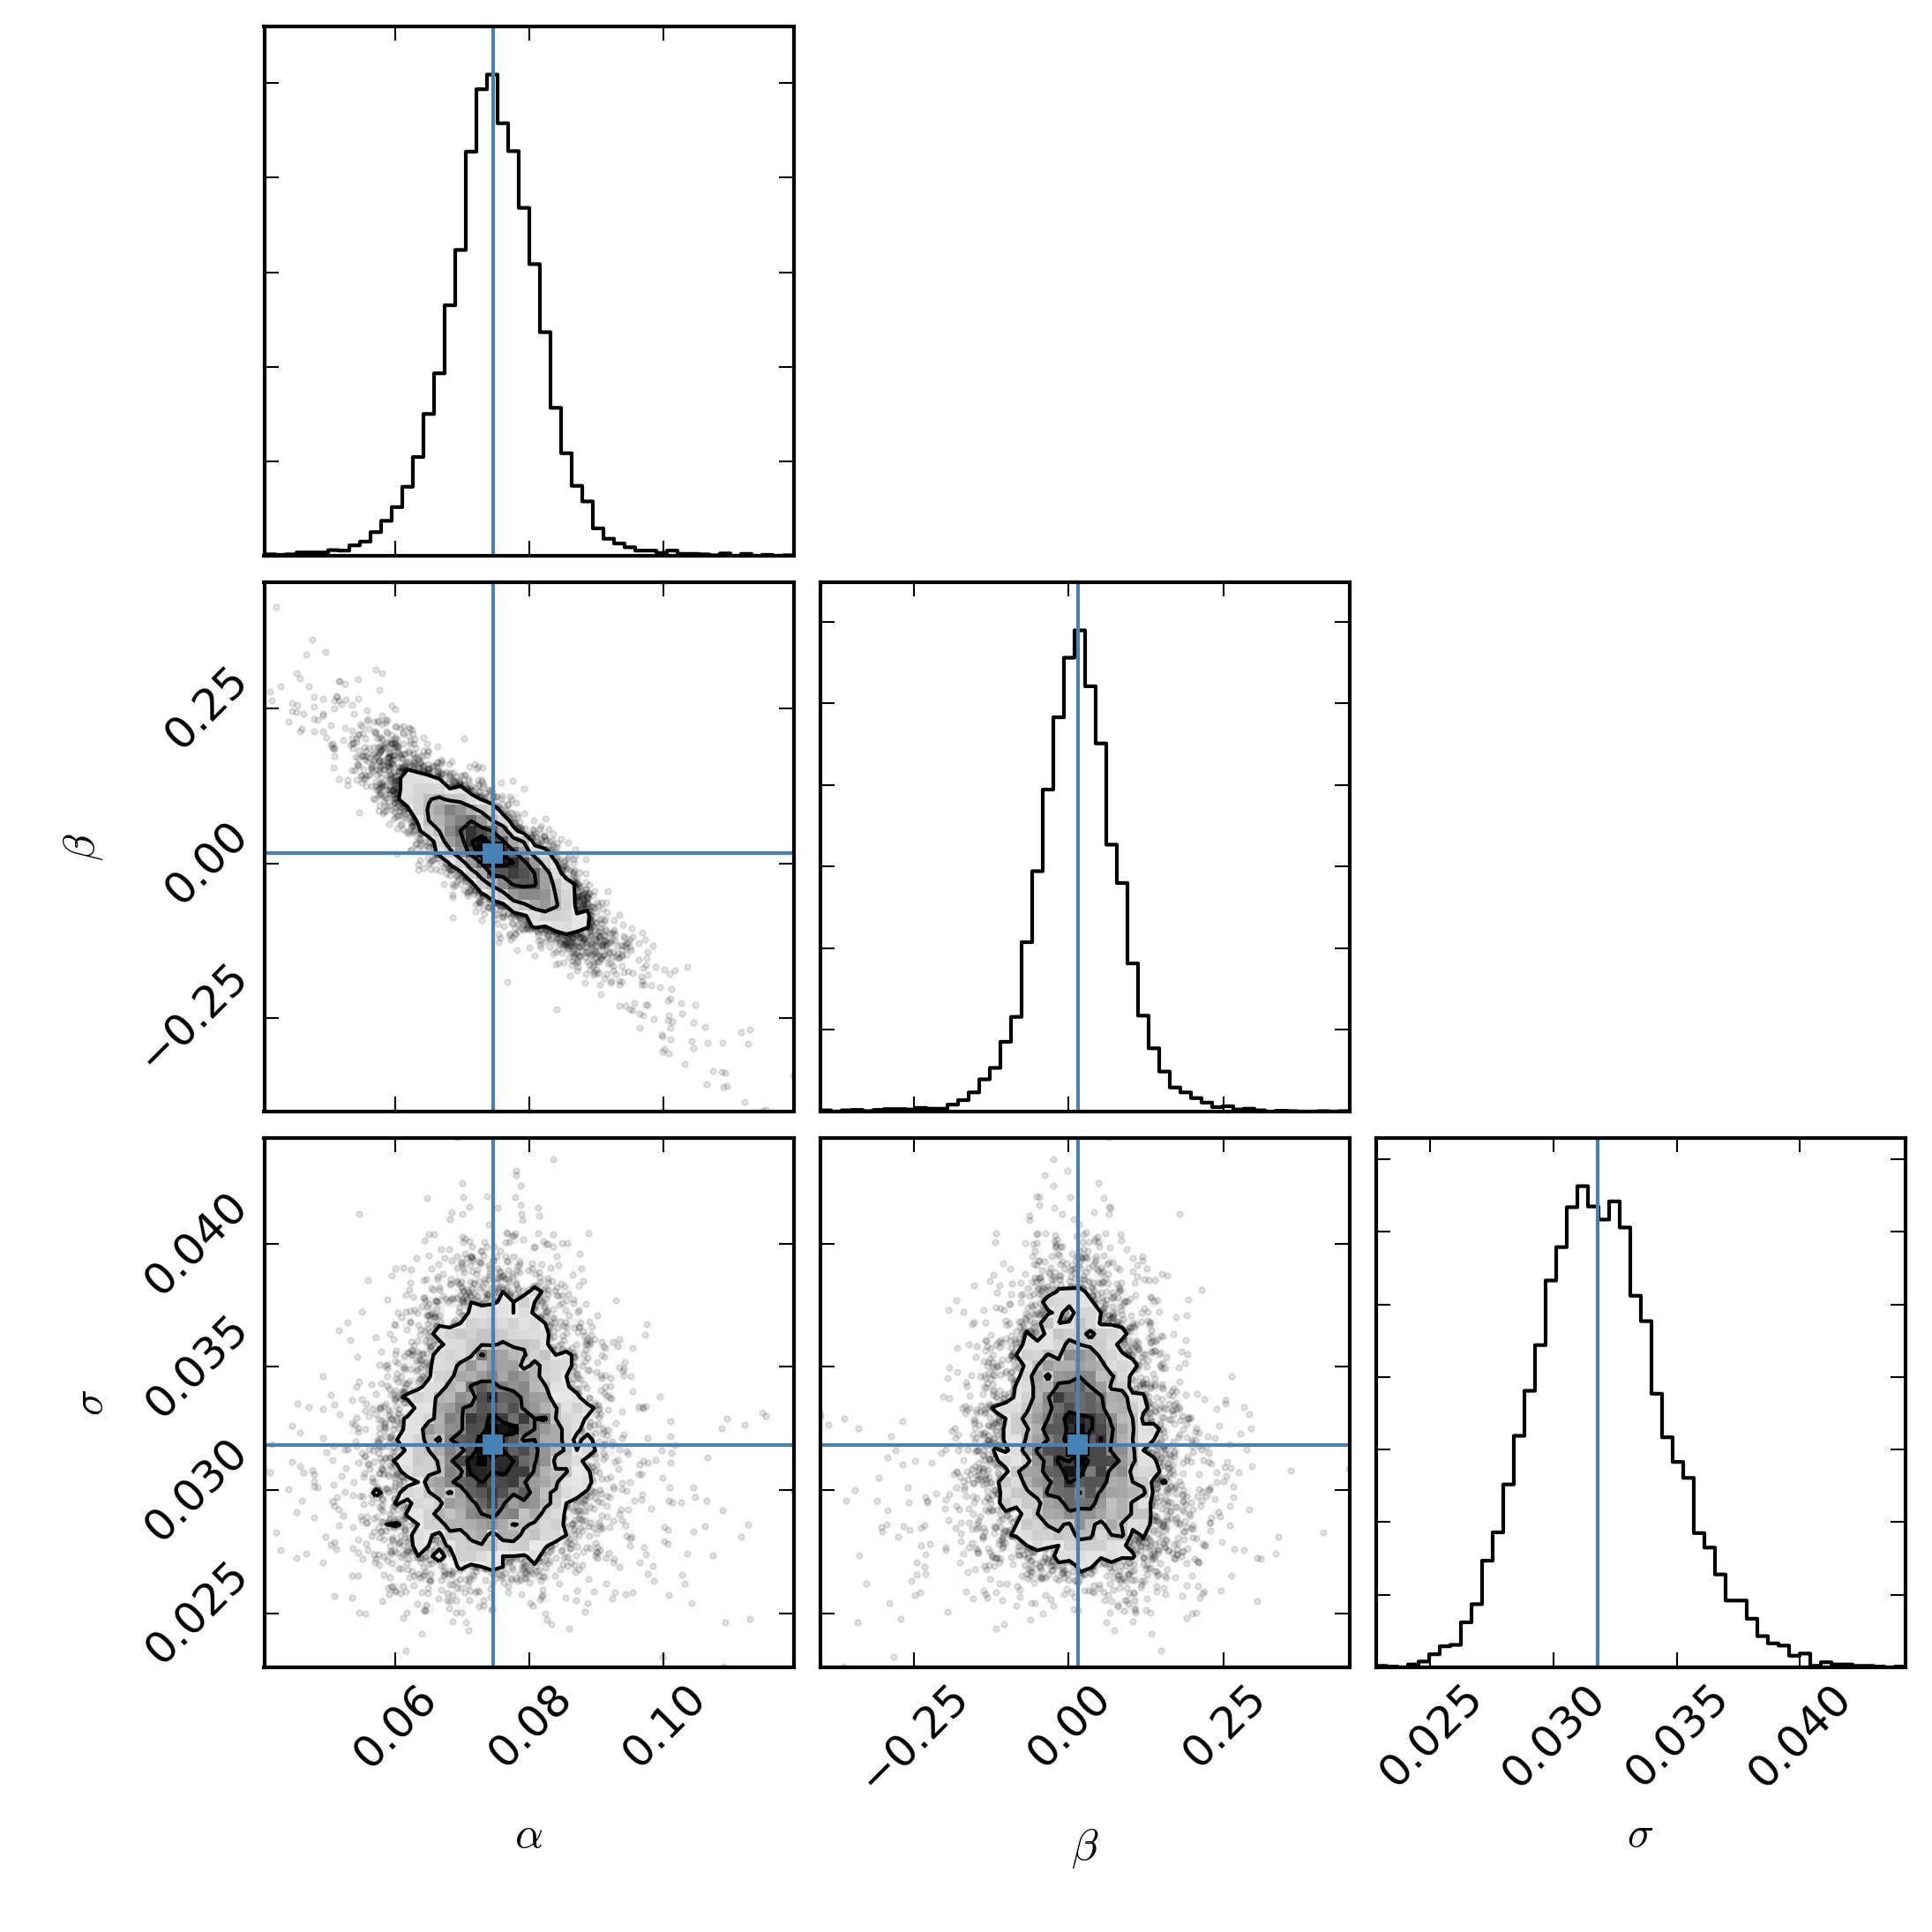
The posterior distributions for each of the parameters of interest () produced by running MCMC are shown in the left panel of Fig. 2. The equation of the “best-fit” linear model is
| (1) |
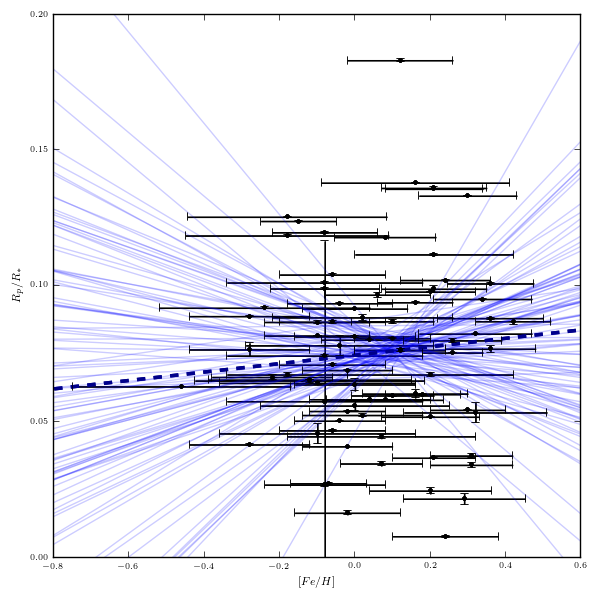
with an intrinsic scatter of . The transit depth of each confirmed exoplanet is plotted against the metallicity of the host star along with their uncertainties in the right panel of Fig. 2. The “best-fit” linear model (blue dotted line) is shown along with 100 random samples from the MCMC chain (light blue). It is clear that there is a large intrinsic scatter which leads to the conclusion that there is no correlation between the transit depth and the stellar metallicity.
5 Discussion
In this work, we showed that there is no correlation between the transit depth of Kepler’s giant exoplanets and the metallicity of the host star. In particular, we demonstrated that there is a relatively large intrinsic scatter in the relation. This result shows how crucial understanding those discrepancies. Thus, they are directly related to the models of planetary structure and formation.
For future work, this analysis should account for the selection effects and biases present in the Kepler survey. Gaidos & Mann (2013) reported the importance of including these effects in any statistical study. The authors also showed that these selection effects lead to biases in the properties of transiting planets and their host stars, hence biasing the correlation.
Acknowledgements.
This research has made use of the data collected by the Kepler mission and the NASA Exoplanet Archive, which is operated by the California Institute of Technology, under contract with the National Aeronautics and Space Administration under the Exoplanet Exploration Program.References
- Dodson-Robinson (2012) Dodson-Robinson, S. E. 2012, ApJ, 752, 72
- Fortney & Nettelmann (2010) Fortney, J. J. & Nettelmann, N. 2010, Space Sci. Rev., 152, 423
- Gaidos & Mann (2013) Gaidos, E. & Mann, A. 2013, ApJ, 762, 41
- Huber et al. (2014) Huber, D., Silva Aguirre, V., Mathews, J. M., et al. 2014, ApJS, 211, 2
- Kelly (2007) Kelly, B. C. 2007, ApJ, 665, 1489
- Mullally et al. (2015) Mullally, F., Coughlin, J. L., Thompson, S. E., et al. 2015, ApJS, 217, 31