SIGNIFICANCE: Using a massive quantitative analysis of Facebook, we show that information related to very specific narratives – conspiracy theories and scientific news – generates homogeneous and polarized communities that have similar information consumption patterns. To account for these features we derive a data-driven percolation model of rumor spreading that demonstrates that homogeneity and polarization are the main determinants for predicting cascade size.
Echo chambers in the age of misinformation
Abstract
The wide availability of user-provided content in online social media facilitates the aggregation of people around common interests, worldviews, and narratives. Despite the enthusiastic rhetoric on the part of some that this process generates “collective intelligence”, the WWW also allows the rapid dissemination of unsubstantiated conspiracy theories that often elicite rapid, large, but naive social responses such as the recent case of Jade Helm 15 – where a simple military exercise turned out to be perceived as the beginning of the civil war in the US. We study how Facebook users consume information related to two different kinds of narrative: scientific and conspiracy news. We find that although consumers of scientific and conspiracy stories present similar consumption patterns with respect to content, the sizes of the spreading cascades differ. Homogeneity appears to be the primary driver for the diffusion of contents, but each echo chamber has its own cascade dynamics. To mimic these dynamics, we introduce a data-driven percolation model on signed networks.
keywords:
misinformation — rumor spreading — collective narratives — crowd dynamics — online social mediaThe massive diffusion of socio-technical systems and microblogging platforms on the WWW creates a direct path from producers to consumers of content, i.e., allows disintermediation, and changes the way users become informed, debate, and form their opinions [1, 2, 3, 4, 5]. This disintermediated environment can foster confusion about causation, and thus encourage speculation, rumors, and mistrust [6]. In 2011 a blogger claimed that global warming was a fraud designed to diminish liberty and weaken democracy [7]. Misinformation about the Ebola epidemic has caused confusion among health-care workers [8]. Recent research [9, 10, 11] has shown that increasing the exposure of users to unsubstantiated rumors increases their tendency to be credulous.
According to Ref. [12], beliefs formation and revision is influenced by the way communities attempt to make sense to events or facts. Such a phenomenon is particularly evident on the WWW where users, embedded in homogeneous clusters [13, 14, 15], process information through a shared system of meaning [9, 10].
Here we analyze the cascade dynamics of Facebook users when the content is (i) conspiracy theories and (ii) scientific information. Conspiracy theories simplify causation, reduce the complexity of reality, and contain uncertainty [16, 17, 18]. Scientific information disseminates scientific advances and exhibits the process of scientific thinking. The main difference between the two is content verifiability. The generators of scientific information and their data, methods, and outcomes are readily identifiable and available. The origins of conspiracy theories are often unknown and the content of the theories is strongly disengaged from mainstream society and sharply divergent from recommended practices [19], e.g., belief that vaccinations cause autism.
Massive digital misinformation is becoming pervasive in online social media to the extent that it has been listed by the World Economic Forum (WEF) as one of the main threats to our society [20]. To counteract this trend, algorithmic-driven solutions have been proposed [21, 22, 23, 24, 25, 26], e.g., Google [27] is developing a trustworthiness score to rank the results of queries. Similarly, Facebook has proposed a community-driven approach where users can flag false contents to correct the news-feed algorithm. This issue is controversial, however, because it raises fears that the free circulation of content may be threatened and the proposed algorithms not be accurate or effective [9, 10, 28]. Often conspiracists will denounce attempts to debunk false information, e.g., the link between vaccination and autism, as acts of misinformation.
Whether a claim (either substantiated or not) is accepted by an individual is strongly influenced by social norms and the claim’s coherence with the individual’s belief system [29, 30]. Despite some enthusiastic claims about the growth of a collective intelligence [31], many mechanisms animate the flow of false information that generates false beliefs in an individual, which, once adopted, are rarely corrected [32, 33, 34, 35].
We use quantitative analysis to show that homogeneity is the primary driver of content diffusion and generates the formation of homogeneous, polarized clusters, i.e., “echo chambers” [9, 10, 36, 37]. We also find that although consumers of scientific information and conspiracy theories exhibit similar consumption patterns with respect to content, the cascade patterns of the two differ. Homogeneity appears to be the preferential driver for the diffusion of content, yet each echo chamber has its own cascade dynamics.
The paper is structured as follows. First we provide the preliminary definitions and details concerning data collection. We then do a comparative analysis and characterize the statistical signatures of the cascades of the different kinds of content. Finally, we introduce a data-driven model that replicates the analyzed cascade dynamics.
Methods
Ethics Statement.
The data collection process has been carried out using the Facebook Graph API [38], which is publicly available. For the analysis (according to the specification settings of the API) we only used publicly available data (thus users with privacy restrictions are not included in the dataset). The pages from which we download data are public Facebook entities and can be accessed by anyone. User content contributing to these pages is also public unless the user’s privacy settings specify otherwise, and in that case it is not available to us.
Data collection.
Debate about social issues continues to expand across the Web, and unprecedented social phenomena such as the massive recruitment of people around common interests, ideas, and political visions are emerging. Using the approach described in Ref. [9], we define the space of our investigation with the support of diverse Facebook groups that are active in the debunking of conspiracy theories.
The resulting dataset is composed of 67 public pages divided between conspiracy and science news. A second set, composed of two troll pages, is used as a benchmark to fit our data-driven model. The first category (conspiracy theories) includes the pages that disseminate alternative, controversial information, often lacking supporting evidence and frequently advancing conspiracy theories. The second category (science news) includes the pages that disseminate scientific information. The third category (trolls) includes those pages that intentionally disseminate sarcastic false information on the Web.
For the three sets of pages we download all the posts (and their respective user interactions) across a five-year timespan (2010 to 2014). We perform the data collection process by using the Facebook Graph API [38], which is publicly available and accessible through any personal Facebook user account. The exact breakdown of the data is presented in the Supporting Information (SI) Section 1.
Preliminaries and Definitions.
A tree is an undirected simple graph that is connected and has no simple cycles. An oriented tree is a directed acyclic graph whose underlying undirected graph is a tree. A sharing tree in the context of our research is an oriented tree made up of the successive sharing of a news item through the Facebook system. The root of the sharing tree is the node that performs the first temporal share. We define the size of the sharing tree as the number of nodes (and hence the number of news sharers) in the tree and the height of the sharing tree as the maximum path length distant from the root.
We define the user polarization , where is the fraction of “Likes” a user executes on conspiracy related content, and hence . From user polarization, we define the edge homogeneity, for any edge between nodes and , as
with . Edge homogeneity reflects the similarity level between the polarization of the two sharing nodes. A link in the sharing tree is homogeneous if its edge homogeneity is positive, otherwise it is non homogeneous. We then define a sharing path to be any path from the root to one of the leaves of the sharing tree. A homogeneous path is a sharing path for which the edge homogeneity of each edge is positive, i.e., a sharing path whose edges are all homogeneous links.
Wald Test.
We use the Wald test to compare the scaling parameters of two power law distributions. We define it as
where and are the estimated scaling parameters. The Wald statistic:
follows a distribution with one degree of freedom. We reject the null hypothesis and conclude that there is a significant difference between the two scaling parameters if the -value of is below a given significance level .
Kolmogorov-Smirnov Test.
We use the Kolmogorov-Smirnov test to compare the empirical distribution functions of two samples. The Kolmogorov-Smirnov statistic for two given cumulative distribution functions and is
which measures the maximum punctual distance between the two sample distributions. If is bigger than a given critical value 111The critical value depends on the sample sizes and on the considered significance level , it can be computed as where and are the respective sample sizes and is a fixed value associated with the significance level . we reject the null hypothesis and conclude that there is a significant difference between the two sample distributions.
Results and discussion
Anatomy of Cascades.
We begin our analysis by characterizing the statistical signature of cascades as they relate to information type. We analyze the three types—science news, conspiracy rumors, and trolling—and find that size and maximum degree are power-law distributed for all three. The maximum cascade size values are 952 for science news, 2422 for conspiracy news, and 3945 for trolling, and the estimated exponents for the power law distributions are 2.21 for science news, 2.47 for conspiracy theories, and 2.44 for trolling. Tree height values range from 1 to 5, with a maximum height of 5 for science news and conspiracy theories and a maximum height of 4 for trolling. For further information see SI Section 2.1.
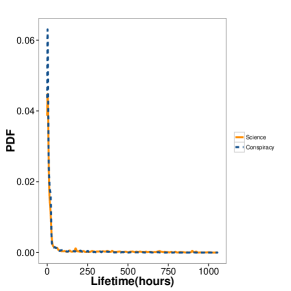
Figure 1 shows the probability density function (PDF) of the cascade lifetime (using hours as time units) for science and conspiracy. We compute the lifetime as the length of time between the first user and the last user sharing a post. In both categories we find a first peak at approximately 1–2 hours and a second at approximately 20 hours, indicating that the temporal sharing patterns are similar irrespective of the difference in topic. We also find that a significant percentage of the information diffuses rapidly (24.42% of the science news and 20.76% of the conspiracy rumors diffuse in less than two hours, and 39.45% of science news and 40.78% of conspiracy theories in less than five hours). Only 26.82% of the diffusion of science news and 17.79% of conspiracy lasts more than one day. Kolmogorov-Smirnov test made us reject the hypothesis that the two distributions are equal.
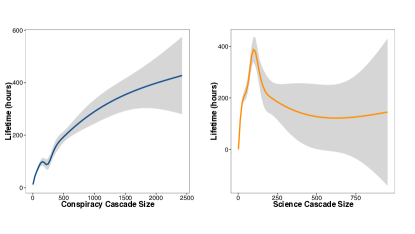
Figure 2 shows lifetime as a function of cascade size. For science news we have a peak in the lifetime corresponding to a cascade size value of , and higher cascade size values correspond to high lifetime variability. For conspiracy related content the lifetime increases with cascade size.
These results suggest that news assimilation differs according to category. Science news is usually assimilated, i.e., it reaches a higher level of diffusion, quickly, and a longer lifetime does not correspond to a higher level of interest. Conversely, conspiracy rumors are assimilated more slowly and show a positive relation between lifetime and size. For both science and conspiracy news, we compute size as a function of lifetime and confirm that differentiation in the sharing patterns is content-driven, and that for conspiracy there is a positive relation between size and lifetime. For a more detailed explanation, see SI Section 2.1.
Homogeneous Clusters.
We next examine the social determinants that drive sharing patterns and we focus on the role of homogeneity in friendship networks.
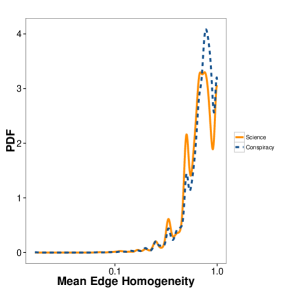
Figure 3 shows the PDF of the mean edge homogeneity, computed for all cascades of science news and conspiracy theories. It shows that there are homogeneous links between consecutively sharing users. In particular, the average edge homogeneity value of the entire sharing cascade is always greater or equal to zero, indicating that either the information transmission occurs inside homogeneous clusters in which all links are homogeneous or it occurs inside mixed neighborhoods in which the balance between homogeneous and non homogeneous links is favorable towards the former ones. However, the probability of close to zero mean edge homogeneity is really small.
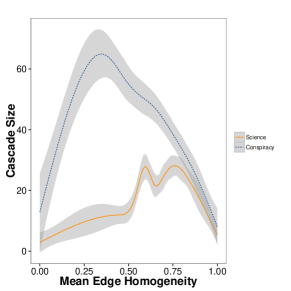
To further characterize the role of homogeneity in shaping sharing cascades, we compute cascade size as a function of mean edge homogeneity for both science and conspiracy news, see Figure 4. In science news, higher levels of mean edge homogeneity in the interval (0.5, 0.8) correspond to larger cascades, but in conspiracy theories lower levels of mean edge homogeneity () correspond to larger cascades. Notice that, although viral patterns related to distinct contents differ, homogeneity is clearly the driver of information diffusion. In other words, different contents generate different echo chambers, characterized by the high level of homogeneity inside them.
The probability density function (PDF) of the edge homogeneity, computed for science and conspiracy news as well as the two taken together—both in the unconditional case and in the conditional case (in the event that the user that made the first share in the couple has a positive or negative polarization)—confirms the roughly null probability of a negative edge homogeneity (see SI Section 2.1).
We record the CCDF of the number of all sharing paths222Recall that a sharing path is here defined as any path from the root to one of the leaves of the sharing tree. A homogeneous path is a sharing path for which the edge homogeneity of each edge is positive on each tree compared with the CCDF of the number of homogeneous paths for science and conspiracy news, and the two together. A Kolmogorov-Smirnov test and Q-Q plots confirm that for all three pairs of distributions considered there is no significant statistical difference (see SI Section 2.2 for a more detailed analysis). In SI Section 2.2 we report also the frequency of maximum length for all sharing paths and homogeneous paths, for both categories of content.
We confirm the pervasiveness of homogeneous paths, but we also find homogeneous paths in which there is a shift of in the path length (with respect to the total path length ). Notice that the first publisher of a news is generally a page, hence the -homogeneous paths are due to a discordant sharing in the first step (i.e., when the product of the first sharer’s user polarization and the sharer page category is negative).
Cascade lifetimes of science and conspiracy news exhibit a probability peak in the first two hours, and that in the following hours they rapidly decrease. Despite the similar consumption patterns, cascade lifetime expressed as a function of cascade size differs greatly for the different content sets. The PDF of the mean edge homogeneity indicates that there is homogeneity in the linking step of sharing cascades. The distribution of the number of total and homogeneous sharing paths are very similar for both content categories.
Viral patterns related to contents belonging to different narratives differ, but homogeneity is clearly the driver of content diffusion.
The Model.
We now introduce a percolation model of rumor spreading to account for homogeneity and polarization. We consider users connected by a small-world network [39]. The model parameter space varies on a rewiring probability , mimicking the network density, and a news set of size .
Every node has an opinion , uniformly distributed in . Every news item has a fitness (degree of interest) uniformly distributed in . At each step the news items are diffused and initially shared by a group of first sharers. After the first step, the news recursively passes to the neighborhoods of previous step sharers, e.g., those of the first sharers during the second step. If a friend of the previous step sharers has an opinion close to the fitness of the news, then she shares the news again.
In particular, when
user shares news ; is the sharing threshold.
Because by itself cannot capture the homogeneous clusters observed in the data, we model the connectivity pattern as a signed network [4, 40] considering different fractions of homogeneous links and hence restricting diffusion of news only to homogeneous links. We define as the fraction of homogeneous links in the network, as the number of total links, and as the number of homogeneous links, thus we have:
Notice that and that , the fraction of non homogeneous links, is complementary to . In particular, we can reduce the parameters space to as we would restrict our attention to either one of the two complementary clusters.
The model can be seen as a branching process where the sharing threshold and neighborhood dimension are the key parameters. More formally, let the fitness of the news and the opinion of a the user be uniformly i.i.d. between . Then the probability that a user shares a post is defined by a probability , since and are uniformly i.i.d. In general, if and have distributions and , then will depend on ,
If we are on a tree of degree (or on a sparse lattice of degree ), the average number of sharers (the branching ratio) is defined by
with a critical cascade size . If we assume that the distribution of the number of the first sharers is , then the average cascade size is
where is the average with respect to . In the simulations we fixed neighborhood dimension since the branching ratio depends upon the product of and and, without loss of generality, we can consider the variation of just one of them.
If we allow a probability that a neighbor of a user has a different polarization, then the branching ratio becomes . If a lattice has a degree distribution (), we can then assume a usual percolation process that provides a critical branching ratio and that is linear in ().
Simulation Results.
We explore the model parameters space using nodes and news items with the number of first sharers distributed as an (i) inverse Gaussian, (ii) log normal, (iii) Poisson, (iv) uniform distribution, and as the real data distribution (from the science and conspiracy news sample). Parameters are chosen to fit the real data distribution (for details see SI Section 3.1, 3.2). In Table 1 we show a summary of relevant statistics (min value, first quantile, median, mean, third quantile, and max value) to compare the real data first sharers distribution with the fitted distributions333For details on the parameters of the fitted distributions used see SI Section 3.2.. The inverse Gaussian (), shows the best fit for the distribution of first sharers with respect to all the considered statistics.
Along with the first sharers distribution, we vary the sharing threshold in the interval and the fraction of homogeneous links in the interval . To avoid biases induced by statistical fluctuations in the stochastic process, each point of the parameter space is averaged over 100 iterations. provides a good estimate of real data values. In particular, consistently with the division of in two echo chambers (science and conspiracy), the network is divided into two clusters in which news items remain inside and are transmitted solely within each community’s echo chamber (see SI Section 3.2 for the details of the simulation results).
In addition to the science and conspiracy content sharing trees, we downloaded a set of 1,072 sharing trees of intentionally false information from troll pages. Frequently troll information, e.g., parodies of conspiracy theories such as chem-trails containing the active principle of Viagra, is picked up by habitual conspiracy theory consumers. In SI Section 3.2 we report the same information as Table 1 for trolling category. Also in this case we notice that the best fit is obtained by the inverse Gaussian distribution.
We computed the mean and standard deviation of size and height of all trolling sharing trees, and reproduced the data using our model444Note that the real data values for the mean (and standard deviation) of size and height on the troll posts are respectively: and .. We used fixed parameters from trolling messages sample (the number of nodes in the system and the number of news items) and varied the fraction of homogeneous links , the rewiring probability , and sharing threshold . See SI Section 3.2 for the distribution of first sharers used and for additional simulation results of the fit on trolling messages.
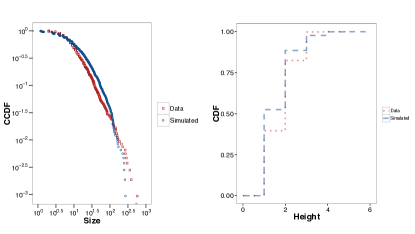
We simulated the model dynamics with the best combination of parameters obtained from the simulations and the number first sharers distributed as an inverse Gaussian, figure 5 shows the CCDF of size and the CDF of height. A summary of relevant statistics (min value, first quantile, median, mean, third quantile, and max value) to compare the real data size and height distributions with the fitted ones is reported in SI Section 3.2. We notice that the fit is good for all the statistics, with the exception of min and max value of size. For the min value, the presence of a zero is due to the fact that the inverse Gaussian is a real valued distribution function and in the simulations we considered the integer part of the number of first sharers, thus producing a number of never shared pieces of information. On the other hand, the high difference in the max value is probably due to the long tail of the data size distribution.
We find that the inverse Gaussian is the distribution that best fits the data results both for science and conspiracy news, and for troll messages. For this reason, we performed one more simulation using the inverse Gaussian as distribution of the number of first sharers, 1,072 news items, 16,889 users, and the best parameters combination obtained in the simulations 555The best parameters combinations is , in this case we have a mean size equal to and a mean height , and it is indeed a good approximation, see Section 3.2.. The CCDF of size and the CDF of height for the above parameters combination, as well as basic statistics considered, fit the real data ones from the trolling category.
Conclusions
Digital misinformation has become so pervasive in online social media that it has been listed by the World Economic Forum (WEF) as one of the main threats to human society. Whether a news item, either substantiated or not, is accepted as true by a user may be strongly affected by social norms or by how much it coheres with the user’s system of beliefs [29, 30]. Despite enthusiastic claims that social media is generating a vast “collective intelligence” available to all [31], many mechanisms cause false information to gain acceptance, which in turn generate false beliefs that, once adopted by an individual, are highly resistant to correction [32, 33, 34, 35]. Using extensive quantitative analysis we show that social homogeneity is the primary driver of content diffusion, and one frequent result is the formation of homogeneous, polarized clusters (often called “echo chambers”). We also find that although consumers of science news and conspiracy theories show similar consumption patterns with respect to content, their cascades differ. Social homogeneity appears to be the primary driver of content diffusion, and each echo chamber has its own cascade dynamics. To mimic these dynamics, we introduce a data-driven percolation model of signed networks, i.e., networks composed of signed edges. Our analysis shows that for science and conspiracy news a cascade’s lifetime has a probability peak in the first two hours followed by a rapid decrease. Although the consumption patterns are similar, cascade lifetime as a function of the size differs greatly. The PDF of the mean edge homogeneity indicates that homogeneity is present in the linking step of sharing cascades. The distribution of the number of total sharing paths and homogeneous sharing paths are similar in both content categories. Viral patterns related to distinct contents are different but homogeneity drives content diffusion. We simulate our data-driven percolation model by fixing the number of users and news items downloaded from troll pages and varying the other parameters. We compare the simulated results with the data and find a high level of similarity.
Acknowledgements.
Funding for this work was provided by the EU FET project MULTIPLEX, no. 317532, SIMPOL, no. 610704, the FET project DOLFINS 640772 (H2020), SoBigData 654024 (H2020), and CoeGSS 676547 (H2020). The funders had no role in study design, data collection and analysis, decision to publish, or preparation of the manuscript. Special thanks go to Delia Mocanu,”Protesi di Protesi di Complotto”, ”Che vuol dire reale”, ”La menzogna diventa verita e passa alla storia”, ”Simply Humans”, ”Semplicemente me”, Salvatore Previti, Brain Keegan, Dino Ballerini, Elio Gabalo and ”The rooster on the trash” for their precious suggestions and discussions.References
- [1] Jo Brown, Amanda J Broderick, and Nick Lee. Word of mouth communication within online communities: Conceptualizing the online social network. Journal of interactive marketing, 21(3):2–20, 2007.
- [2] R. Kahn and D. Kellner. New media and internet activism: from the ‘battle of seattle’ to blogging. new media and society, 6(1):87–95, 2004.
- [3] W. Quattrociocchi, R. Conte, and E. Lodi. Opinions manipulation: Media, power and gossip. Advances in Complex Systems, 14(4):567–586, 2011.
- [4] W. Quattrociocchi, G. Caldarelli, and A. Scala. Opinion dynamics on interacting networks: media competition and social influence. Scientific Reports, 4, 2014.
- [5] R. Kumar, M. Mahdian, and M. McGlohon. Dynamics of conversations. In Proceedings of the 16th ACM SIGKDD International Conference on Knowledge Discovery and Data Mining, KDD ’10, pages 553–562, New York, NY, USA, 2010. ACM.
- [6] Cass R Sunstein and Adrian Vermeule. Conspiracy theories: Causes and cures*. Journal of Political Philosophy, 17(2):202–227, 2009.
- [7] The goal is power: The global warming conspiracy. Forbes, November 2011.
- [8] The inevitable rise of ebola conspiracy theories, March 2014.
- [9] A. Bessi, M. Coletto, G.A. Davidescu, A. Scala, G. Caldarelli, and W. Quattrociocchi. Science vs conspiracy: collective narratives in the age of (mis)information. Plos ONE, 2015.
- [10] D. Mocanu, L. Rossi, Q. Zhang, M. Karsai, and W. Quattrociocchi. Collective attention in the age of (mis)information. Computers in Human Behavior, abs/1403.3344, accepted.
- [11] Alessandro Bessi, Antonio Scala, Luca Rossi, Qian Zhang, and Walter Quattrociocchi. The economy of attention in the age of (mis) information. 2014.
- [12] F. Furedi. Culture of Fear Revisited. Bloomsbury Publishing, 2006.
- [13] Luca Maria Aiello, Alain Barrat, Rossano Schifanella, Ciro Cattuto, Benjamin Markines, and Filippo Menczer. Friendship prediction and homophily in social media. ACM Transactions on the Web (TWEB), 6(2):9, 2012.
- [14] Bin Gu, Prabhudev Konana, Rajagopal Raghunathan, and Hsuanwei Michelle Chen. Research note—the allure of homophily in social media: Evidence from investor responses on virtual communities. Information Systems Research, 25(3):604–617, 2014.
- [15] Aris Anagnostopoulos, Alessandro Bessi, Guido Caldarelli, Michela Del Vicario, Fabio Petroni, Antonio Scala, Fabiana Zollo, and Walter Quattrociocchi. Viral misinformation: the role of homophily and polarization. arXiv preprint arXiv:1411.2893, 2014.
- [16] J. Byford. Conspiracy Theories: A Critical Introduction. Palgrave Macmillan, 2011.
- [17] G.A. Fine, V. Campion-Vincent, and C. Heath. Rumor Mills: The Social Impact of Rumor and Legend. Social problems and social issues. Transaction Publishers.
- [18] M.A. Hogg and D.L. Blaylock. Extremism and the Psychology of Uncertainty. Blackwell/Claremont Applied Social Psychology Series. Wiley, 2011.
- [19] Cornelia Betsch and Katharina Sachse. Debunking vaccination myths: Strong risk negations can increase perceived vaccination risks. Health psychology, 32(2):146, 2013.
- [20] L. Howell. Digital wildfires in a hyperconnected world. In WEF Report 2013. World Economic Forum, 2013.
- [21] Vahed Qazvinian, Emily Rosengren, Dragomir R Radev, and Qiaozhu Mei. Rumor has it: Identifying misinformation in microblogs. In Proceedings of the Conference on Empirical Methods in Natural Language Processing, pages 1589–1599. Association for Computational Linguistics, 2011.
- [22] Giovanni Luca Ciampaglia, Prashant Shiralkar, Luis M Rocha, Johan Bollen, Filippo Menczer, and Alessandro Flammini. Computational fact checking from knowledge networks. arXiv preprint arXiv:1501.03471, 2015.
- [23] Paul Resnick, Samuel Carton, Souneil Park, Yuncheng Shen, and Nicole Zeffer. Rumorlens: A system for analyzing the impact of rumors and corrections in social media. In Proc. Computational Journalism Conference, 2014.
- [24] Aditi Gupta, Ponnurangam Kumaraguru, Carlos Castillo, and Patrick Meier. Tweetcred: Real-time credibility assessment of content on twitter. In Social Informatics, pages 228–243. Springer, 2014.
- [25] Amal Abdullah AlMansour, Ljiljana Brankovic, and Costas S Iliopoulos. A model for recalibrating credibility in different contexts and languages-a twitter case study. International Journal of Digital Information and Wireless Communications (IJDIWC), 4(1):53–62, 2014.
- [26] Jacob Ratkiewicz, Michael Conover, Mark Meiss, Bruno Gonçalves, Alessandro Flammini, and Filippo Menczer. Detecting and tracking political abuse in social media. In ICWSM, 2011.
- [27] Xin Luna Dong, Evgeniy Gabrilovich, Kevin Murphy, Van Dang, Wilko Horn, Camillo Lugaresi, Shaohua Sun, and Wei Zhang. Knowledge-based trust: Estimating the trustworthiness of web sources. arXiv preprint arXiv:1502.03519, 2015.
- [28] Brendan Nyhan, Jason Reifler, Sean Richey, and Gary L. Freed. Effective messages in vaccine promotion: A randomized trial. Pediatrics, 133(4):e835–e842, 2014.
- [29] Bi Zhu, Chuansheng Chen, Elizabeth F. Loftus, Chongde Lin, Qinghua He, Chunhui Chen, He Li, Robert K. Moyzis, Jared Lessard, and Qi Dong. Individual differences in false memory from misinformation: Personality characteristics and their interactions with cognitive abilities. Personality and Individual Differences, 48(8):889 – 894, 2010.
- [30] Steven J. Frenda, Rebecca M. Nichols, and Elizabeth F. Loftus. Current Issues and Advances in Misinformation Research. Current Directions in Psychological Science, 20:20–23, 2011.
- [31] J. Surowiecki. The Wisdom of Crowds: Why the Many Are Smarter Than the Few. Abacus, 2005.
- [32] R. Kelly Garrett and Brian E. Weeks. The promise and peril of real-time corrections to political misperceptions. In Proceedings of the 2013 conference on Computer supported cooperative work, CSCW ’13, pages 1047–1058, New York, NY, USA, 2013. ACM.
- [33] MichelleL. Meade and HenryL. Roediger. Explorations in the social contagion of memory. Memory & Cognition, 30(7):995–1009, 2002.
- [34] A. Koriat, M. Goldsmith, and A. Pansky. Toward a psychology of memory accuracy. Annu Rev Psychol, 51:481–537, 2000.
- [35] Michael Ayers and Lynne Reder. A theoretical review of the misinformation effect: Predictions from an activation-based memory model. Psychonomic Bulletin & Review, 5(1):1–21, March 1998.
- [36] Cass Sunstein. Echo chambers, 2001.
- [37] R Kelly Garrett. Echo chambers online?: Politically motivated selective exposure among internet news users1. Journal of Computer-Mediated Communication, 14(2):265–285, 2009.
- [38] Facebook. Using the graph api. Website, 8 2013. last checked: 19.01.2014.
- [39] Duncan J Watts and Steven H Strogatz. Collective dynamics of ‘small-world’networks. nature, 393(6684):440–442, 1998.
- [40] Jure Leskovec, Daniel Huttenlocher, and Jon Kleinberg. Signed networks in social media. In Proceedings of the SIGCHI Conference on Human Factors in Computing Systems, pages 1361–1370. ACM, 2010.
| Data | IG | LN | Poi | |
|---|---|---|---|---|
| Min | 1 | 0.36 | 0.10 | 20 |
| 1st Qu. | 5 | 4.16 | 3.16 | 35 |
| Median | 10 | 10.45 | 6.99 | 39 |
| Mean | 39.34 | 39.28 | 13.04 | 39.24 |
| 3rd Qu. | 27 | 31.59 | 14.85 | 43 |
| Max | 3033 | 1814 | 486.10 | 66 |