xxx–xxx
Accretion, disks, and magnetic activity in the TW Hya association
Abstract
We present new photometric and spectroscopic data for the M-type members of the TW Hya association with the aim of a comprehensive study of accretion, disks and magnetic activity at the critical age of Myr where circumstellar matter disappears.
keywords:
stars: low-mass, brown dwarfs, stars: chromospheres, accretion, accretion disks1 Introduction
Accretion, outflows and magnetic activity are key features driving young stellar evolution. All these phenomena are linked in a complex feedback mechanism where the activity from the stellar chromosphere and corona influences the evolution of disks and planet formation while mass accretion from the disk to the star in turn may act as a heating agent on the structure of the outer stellar atmosphere. The details of this mechanism, how it depends on stellar mass, and how it evolves with time is, thus, of utmost importance for an understanding of pre-main sequence evolution.
At a distance of pc the TW Hya association (TWA) represents one of the most easily accessible laboratories for low-mass star formation. Moreover, its age of Myr places the TWA at a crucial evolutionary phase where disks dissipate and the accretion/outflow process comes to a halt.
We are performing a broad-band (350-2500nm) mid-resolution spectroscopic survey with X-Shooter@VLT. These observations give access to a rich database of emission lines which probe accretion, outflows and magnetic activity. In addition, we have carried out a optical/near-infrared (NIR) monitoring campaign of both stars in the wide binary system TWA 30 to study photometric variability related to their circumstellar environments.
2 Chromospheric properties of TWA stars
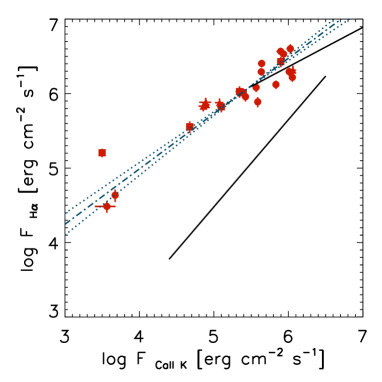
We have analyzed X-Shooter/VLT spectra of non-accreting pre-main sequence stars, so-called Class III sources, from three nearby star-forming regions ( Orionis, Lupus III, and the TWA). Of particular interest here are flux-flux relations between activity diagnostics that probe different atmospheric layers (from the lower chromosphere to the corona). We examine such relations for the first time for pre-main sequence stars. For main-sequence late-type stars the fluxes of chromospheric emission lines follow power-law relations, with the exception of a subgroup of M-type stars which define a separate “active” branch ([Martínez-Arnáiz et al. (2010), Martinez-Arnáiz et al. 2010]). Fig. 1 (left) shows that all the Class III stars from our sample lie on this “active” branch, and – spanning a range of masses throughout the full M spectral sequence – they extend it to lower fluxes. We conclude that chromospheric flux-flux relations can serve as a tool for confirming the youth of low-mass stars. More detailed investigations covering ages between the Myr of TWA and the Gyr of main-sequence field stars are required to explore this new age diagnostic.
Flux ratios between individual emission lines of the Class III sources show a smooth dependence on the effective temperature. [Meunier & Delfosse (2009)] found that in the solar chromosphere the different behavior of H and Ca II H&K is due to their link to different structures, so-called filaments and plages. However, the observed spread in Fig. 1 and in the H/Ca II K flux ratio for given suggests that a third parameter, in addition to age and , determines the chromospheric structure of late-type stars.
H and Ca II H&K are the best-studied emission lines in chromospheres of late-type stars. Our knowledge on the whole emission line spectrum is more elusive as a result of limited spectral range and sensitivity of most available spectrographs. This gap can be closed with wide-band spectroscopic studies, such as our comprehensive X-Shooter study of Class III sources (see [Stelzer et al. (2013), Stelzer et al. 2013]).
3 Accretion measurements for TWA members
We have obtained X-Shooter spectra for “potentially accreting” TWA members. Here we concentrate on measurements of mass accretion rates (). We consider as “potential accretors” all TWA stars previously known to be accreting and further TWA members with evidence of IR (disk) excess in published photometry or a Balmer jump in the X-Shooter spectra. This sample excludes the Class III stars discussed in Sect. 2.
Two methods are used to measure mass accretion rates from the X-Shooter spectra. First, we determine the Balmer jump – if any – by modelling the UVB spectrum with a combination of a non-accreting Class III template and a hydrogen slab model representing emission from the accretion column as described by [Manara et al. (2013)]. This yields the accretion luminosity, . Secondly, we use the empirical calibrations between fluxes of individual emission lines and the values measured with the slab modelling derived by [Alcalá et al. (2014)] to obtain from observed line fluxes.
We compare our preliminary results for as a function of stellar mass () to the analogous study for the Lupus star forming region by [Alcalá et al. (2014)], and find that the TWA stars display smaller at given mass. However, the slope in the diagram is the same as for Lupus. This indicates that the TWA disks represent an evolved version of the same type of disks that are present in Lupus.
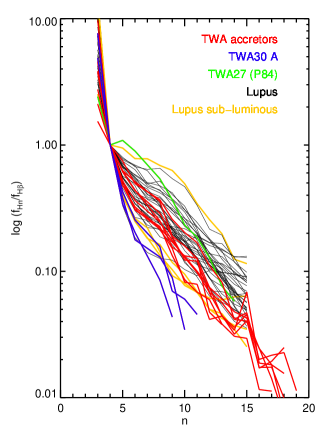
In Fig. 1 (right) we compare the Balmer decrements of the TWA accretor sample to those of the accretors in Lupus (see Antoniucci et al. 2015, in prep.). The TWA stars tend to have slightly steeper decrements than the younger stars in Lupus. The physical conditions determining the shape of the decrements will be investigated by comparison to decrements predicted from the radiative transfer models by [Kwan & Fischer (2011)].
4 Multiband photometric monitoring of the TWA 30 binary
TWA 30A and 30B are nearly equal-mass components of a wide binary (spectral types M5 and M4; separation) discovered and confirmed as kinematic TWA members by [Looper et al. (2010a)] and [Looper et al. (2010b)]. They are among the nearest ( pc) stars with signatures of disks, mass accretion and outflow activity. The disks of both stars are likely seen (nearly) edge-on: (i) The forbidden emission lines (FELs) have only small radial velocity shifts indicating that their jets are oriented in the plane of the sky; (ii) the FELs are much stronger than the accretion signatures suggesting that the accretion columns are partially hidden by parts of the circumstellar disk.
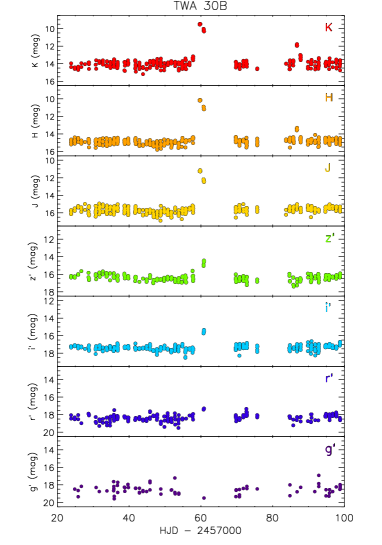
In the discovery papers, [Looper et al. (2010a)] and [Looper et al. (2010b)] showed with multi-epoch low-cadence spectroscopy that both stars have strongly variable NIR colors. To constrain the time-scales of the variability over its full optical/NIR spectral energy distribution we have carried out a photometric monitoring campaign with the robotic cm telescope REM on La Silla operated/owned by the Italian Istituto Nazionale di Astrofisica (INAF). The REM is equipped with a NIR camera, REMIR, and an optical camera, ROSS 2, fed by the same telescope and providing simultaneous photometry in seven filters, g’r’i’z’JHK’. The REM lightcurves of TWA 30A and 30B are shown in Fig. 2.
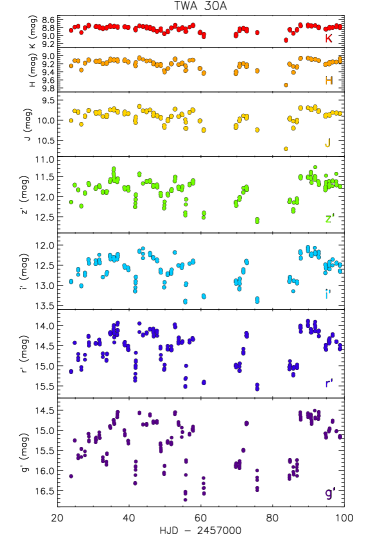
TWA 30A shows quasi-periodic dimmings throughout the monitoring. The lightcurves observed in the seven filters are highly correlated and the depth increases systematically for bluer bands. The NIR colors show that the data points are roughly aligned along the reddening vector. However, during the whole 3-month monitoring campaign the extinction did not reach the high ( mag) values inferred from previous spectroscopy. Similar lightcurves have been observed from stars in the NGC 2264 star forming region based on a long CoRoT and Spitzer monitoring campaign (Stauffer et al. 2015). The occurrence of such periodic dimmings can be interpreted as dust structures levitated above the disk and temporarily occulting the star light as they pass in front of the line of sight.
TWA 30B was for most of the time during our REM monitoring observed in a faint state with occasional “bursts” of several magnitudes. Contrary to TWA 30A, the brightness variations of TWA 30B are much stronger in the NIR than at optical bands. The “bursts” observed in the REM lightcurve are likely responsible for the NIR excess seen in the previous spectroscopic data, which was modelled by Looper et al. (2010b) as cool ( K) blackbody emission. A physical interpretation for this excess NIR emission could be starlight reprocessed from a small portion of the disk that rotates in and out of the line-of-sight. For TWA 30B the NIR photometry has a much flatter slope in the vs diagram than TWA 30A, and NIR colors measured for the “bursts” seen during our REM monitoring are different from those inferred from previous spectrophotometry by [Looper et al. (2010b)].
References
- [Alcalá et al. (2014)] Alcalá, J.M., Natta, A., Manara, C.F., et al., 2014, A&A, 561A, 2
- [Kwan & Fischer (2011)] Kwan, J. & Fischer, W., 2011, MNRAS, 411, 2383
- [Looper et al. (2010a)] Looper, D.L., Mohanty, S., Bochanski, J.J., Burgasser, A.J., et al., 2010, ApJL, 714, 45
- [Looper et al. (2010b)] Looper, D.L., Bochanski, J.J., Burgasser, A.J., Mohanty, S., et al., 2010, ApJS, 140, 1486
- [Manara et al. (2013)] Manara, C.F., Beccari, G., Da Rio, N., et al., A&A, 558A, 114
- [Martínez-Arnáiz et al. (2010)] Martínez-Arnáiz, R., López-Santiago, J., Crespo-Chacón, I. & Montes, D., 2010, MNRAS, 414, 2629
- [Meunier & Delfosse (2009)] Meunier, N. & Delfosse, X., 2009, A&A 501, 1103
- [Stauffer et al. (2015)] Stauffer, J., Cody, A.M., McGinnis, P., et al., 2015, AJ, 149, 130
- [Stelzer et al. (2013)] Stelzer, B., Frasca, A., Alcalà, J.M., et al., 2013, A&A, 558A, 141
RodriguezDid you find periodicities in the REM lightcurves of TWA 30 ?
StelzerYes, indeed. The dips of TWA 30A are quasi-periodic with d. Assuming corotation, the observed period implies that the dust is located at a distance of AU from the star (i.e. in the inner disk) and that its azimuthal position is roughly consistent over time. The variable depth of the dips indicates that the amount or optical depth of the occulting material is changing in time.