Footprints in the sand: What can globular clusters tell us about NGC 4753 past?
Abstract
NGC 4753 is a bright () lenticular galaxy. It is a very interesting target to test different theories of formation of lenticular galaxies, due to its low-density environment and complex structure. We perform the first comprehensive study of NGC4753 globular cluster system (GCS), using Gemini/GMOS and CTIO/MosaicII images. Our results indicate a rather poor GCS of members. Its azimuthal distribution follows the shape of the galaxy bulge. The GC colour distribution is peculiar, presenting an intermediate subpopulation in addition to blue and red ones. This intermediate subgroup can be explained by a single stellar population with an age of Gyr and . The GC specific frequency is surprisingly low for a galaxy of its class. The GC luminosity function (GCLF) is also peculiar, with an excess of bright GCs compared to the expected gaussian distribution. The underlying galaxy body has significant substructure, with remnants of spiral arms, dust filaments, and isophote twisting. This, and the fact that NGC4753 hosted two type Ia SNe, support the possibility that the intermediate GC subpopulation may have originated during a recent merger, Gyr ago.
keywords:
galaxies: star clusters: individual: NGC 4753 - galaxies: elliptical and lenticular, cD1 Introduction
Despite that the fraction of lenticular galaxies (S0s) seems to increase with the number of neighbours (Wilman & Erwin 2012), the existence of S0s in low density environments poses questions about their origin. The physical processes involved in the evolution of lenticular galaxies (S0s) have been largely discussed in the literature (e.g. Spitzer & Baade 1951; Gunn & Gott 1972; van den Bergh 2009b). Ram pressure stripping (e.g. Moran et al. 2006) and galaxy harrassment (Moore et al. 1996) are currently considered as plausible explanations for the origin of S0s in high density environments. However, these processes are not expected to play a main role in low density environments. Alternative explanations are disk gas removal by an active galactic nucleus, or an inefficient inflow of external gas (e.g. Li et al. 2009; van den Bergh 2009a, and references therein). However, cases like NGC 404 (del Río et al. 2004; Thilker et al. 2010) and NGC 4460 (Moiseev et al. 2010) seem to present a steady, long term gas accretion, with current star formation, implying a complex evolutionary history.
NGC 4753 is an early-type galaxy (ETG) with prominent and twisted dust lanes. It is considered as the brightest galaxy of one of the MK-groups (Karachentsev & Nasonova 2013) that populate the Virgo Southern Extension, which is assigned 23 members. Alternatively, Garcia (1993) has included NGC 4753 in the one dozen-members’ group LGG 315 (or the ’NGC 4643 group’ according to NED, NASA/IPAC Extragalactic Database). Originally classified as a peculiar lenticular galaxy (Sandage 1961), it is now assigned an irregular de Vaucouleurs type I0 (e.g. NED). This latter classification points to a merger or a galaxy distorted by gravitational interaction with a close neighbor, though the existence of a neighbor is not evident. The apparently high type Ia Supernovae (SNIa) rate exhibited by this galaxy (NGC 4753 hosted SN 1965I and SN 1983G, Ciatti & Barbon 1971 and Kosai et al. 1983; Buta et al. 1985; Mueller & Hoeflich 1994, respectively) may be an indication of an intermediate-age population, a stellar population that may have formed in a merger a few Gyrs ago. However, this latter statement seems contradictory to the study performed by Navasardyan et al. (2001), who concluded that excepting strongly interacting systems, the SN production in isolated galaxies, galaxy pairs and groups does not depend on the environment. Or has NGC 4753 possibly suffered such a strong event?, we will come back to this issue in the Discussion.
Regarding the dust content, Steiman-Cameron et al. (1992) proposed a disk model that is fitted to the dust distribution, so that the intrincated lanes can be understood as the result of a disk that has been twisted deeply by differential precession. In this way, the original S0 turns into a peculiar galaxy after an accretion event. Moreover, Dewangan et al. (1999) have estimated photometrically the mass of cold dust with optical and far-infrared (FIR) data, and showed that it is about a factor 10 higher than that estimated by mass-loss from only red giant stars. More recently, Finkelman et al. (2012) studied the relation between dust and ionized gas in ETGs with dust lanes, including NGC 4753 in their sample. In order to explain the origin of the interstellar medium (ISM) detected in these ETGs, in addition to the internally-produced ISM, they stressed on the plausible capture of a gas-rich spiral or dwarf, or the collision between two gas-rich dwarfs with similar masses. Thus, we are again led to an accretion or merger event.
With the aim of disentangling the evolutionary story of NGC 4753 and getting a new and precise distance determination, we present a deep photometric study of its globular cluster (GC) system. It is well known that old globular cluster systems (GCS), i.e. with ages greater than 10 Gyr, carry a historical record of the star formation events and, more generally, of the evolution of their host galaxies (e.g. Brodie & Strader 2006; Tonini 2013; Kruijssen 2014, and references therein). The formation of massive star clusters happens during major star-bursts. Thus, the GC colour distribution can provide evidence of star-burst episodes or merger events, which can be associated with the presence of an intermediate-age population (e.g. Richtler et al. 2012; Caso et al. 2013b). For instance, Salinas et al. (2015) have indicated that low values of the specific frequency (Harris & van den Bergh 1981) or , being the number of GCs normalized by the stellar mass of the host galaxy (Zepf & Ashman 1993), are due to the paucity of red (bona fide high metal content) GCs. In the current scheme of GCs origin, blue (bona fide low metal content) GCs are formed at high-redshift, during the massive star formation episodes that follow the merging of the first building blocks of proto-galaxies. Subsequent merger events are responsible for the formation of red GCs, accompanied by another burst of few blue ones (Muratov & Gnedin 2010; Li & Gnedin 2014). Alternatively, Tonini (2013) presents a hierarchical clustering model where the metal-rich subpopulation is composed of globular clusters formed in the galaxy main progenitor around redshift , and the metal-poor subpopulation is composed of clusters accreted from satellites, and formed at redshifts . In this context, the study of GCSs will help to understand the origin and evolution of ETGs in low density environments.
Distance determinations for NGC 4753 range between 20 and 24 Mpc, including supernova light-curve analysis (Parodi et al. 2000; Reindl et al. 2005), Tully-Fisher relation (Theureau et al. 2007), and surface brightness fluctuations (Tonry et al. 2001). We will adopt a mean distance of Mpc (Tonry et al. 2001) in the rest of this paper, until we can compare it with the result obtained from the GC luminosity function (GCLF). There are no previous distance measurements using the turn-over of the GCLF. The information on NGC4753’s GCs is rather non-existent. Zaritsky et al. (2015) include NGC 4753 in their sample of 97 ETGs for which the number of GCs as well as radial profiles are estimated using Spitzer S4G data. However, as the authors indicate, these are rather crude estimates and focused on the central region.
This paper is organized as follows. The Observations are presented in Section 2, the Results are shown in Section 3, and the Section 4 is devoted to the Discussion.
2 Observations and reduction
2.1 Observational data
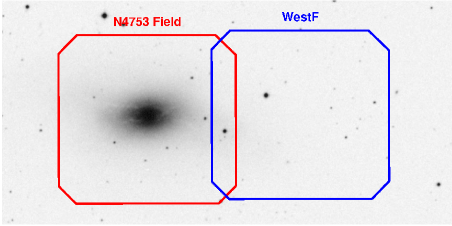
Our dataset consists of GMOS-Gemini-South images in , , and filters, observed during March/April 2014 (programme GS2014A-Q-67, PI: J.P. Caso). These images correspond to two fields, one of them centred on NGC 4753 (hereafter, N4753F), and the other was located to the West (hereafter, WestF). Both fields were slightly overimposed, in order to determine possible differences in the zero-magnitude (see Fig 1). The exposure times were in , in , and in . Each set of exposures were slightly dithered, in order to fill the gaps in the GMOS field, and to efficiently remove cosmic rays and bad pixels. The resulting seeing for the three filters was . The assumed absorptions come from NED (Schlafly & Finkbeiner 2011).
The foreground contamination by Galactic stars was estimated from the observations of the William Herschel Deep Field (WHDF). This was necessary bevause the GCS extended over the two science fields (see Section 3.3). The reduced observations of this field, part of the GMOS-N system verification observations (programme GN-2011B-SV-104), were downloaded from the Gemini Science Archive. This field had been observed in the same filters than our programme, with similar exposure times. According to its Galactic Latitude (), the foreground contamination would be similar to that of the N4753F (). The reduction was perfomed in the usual way, using the tasks from the GEMINI-GMOS package, within iraf. It was necessary to subtract the fringe pattern in the images from our programme. The bias, flatfield, and i’ blank sky images were obtained from the Gemini Science Archive.
This dataset is further enhanced by using images in Kron-Cousins filter, obtained with the MOSAIC II camera mounted at the 4-m Blanco telescope at the Cerro Tololo Inter-American Observatory (CTIO, Chile). The observations were carried out on March 25–26, 2004. The observation was split in four exposures of 720 s each. During these nights, one of the MOSAIC II CCDs was not working. To overcome this, individual images were taken with an appropiate dither to fill in the missing chip. Thus, the final image presents a field-of-view of arcmin2, i.e., at the assumed distance to NGC 4753.
2.2 Photometry and point source selection
First, the extended galaxy light was substracted from the GMOS observations of the N4753F and WestF, applying a ring median filter (Secker 1995) with an inner radius of 5 arcsec (35 px), and an outer radius of 6 arcsec (41 px). This procedure facilitates the point source detection, and is commonly used in GCs studies (e.g. Dirsch et al. 2003; Bassino et al. 2006a; Bassino et al. 2006b; Caso et al. 2013a, 2014). This procedure was not necessary in the case of the WHDF.
The software SExtractor (Bertin & Arnouts 1996) was applied to the image (because it presented the higher signal-to-noise ratio), in order to obtain an initial point source catalogue. The effective radii of clasical GCs is usually smaller than 10 pc (e.g. Brüns & Kroupa 2012). Considering that, at the assumed distance, corresponds to pc, the NGC 4753 GCs are seen as point sources on our images. Then, we used the SExtractor parameter CLASSSTAR to eliminate the extended sources from our catalogue.
The photometry was performed with the DAOPHOT package (Stetson 1987) within iraf. A second-order variable PSF was generated for each filter, employing a sample of bright stars, well distributed over the field. The final point source selection was made with the and sharpness parameters, from the ALLSTAR task.
2.3 Photometric calibration
During our programme, a well populated standard star field, from the list of Smith & et al. (2002) was observed during the same night than the N4753F. We obtained the standard stars aperture photometry for several aperture radii with task phot. We considered these measurements to derive the aperture correction by using a growth curve. After this correction, we fit transformation equations of the form:
where and are the standard and instrumental magnitudes, respectively, and are the photometric zero points. is the mean atmospheric extintion at Cerro Pachón, obtained from the Gemini Observatory Web Page111http://www.gemini.edu/sciops/instruments/gmos/calibration, and the airmass. is the coefficient of the color term, and its associated calibrated colour, for and , and for . The fitted zero points and colour terms were , and , and , and , respectively. The calibration equations for the WHDF were obtained from Faifer et al. (2011).
Afterwards, we applied the galactic extinction corrections from Schlafly & Finkbeiner (2011) to the calibrated magnitudes. Finally, from the objects in common between the N4753F and WestF we found small zero-point differences, , and . These offsets were applied to the WestF final catalogue, in order to refer its photometry to the N4753F one.
In the case of the MOSAIC II observations, 4 to 5 fields were observed in Kron-Cousins and Washington filters, containing about 10 standard stars from the list of Geisler et al. (1996). The observations spanned a large range in airmass, typically from 1.0 to 1.9. The coefficients fitted for each night were indistinguishable within the uncertainties. Considering that, it was possible to calculate a single set of transformation equations, which resulted
where and are the instrumental magnitudes, and and are the airmasses in and filters, respectively.
2.4 Completeness analysis
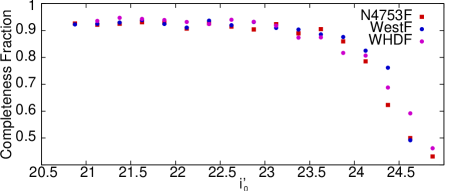
In order to estimate the photometric completeness for the three fields (our science fields plus the WHDF), we added 250 artificial stars in the images of the three filters. These stars were equally distributed over the entire GMOS-S fields, they presented colours in the expected ranges for GCs, and . This process was repeated 40 times, achieving a sample of 10 000 artificial stars. Their photometry was carried out in the same way as the science fields. The completeness curve, after the definite point source catalogue was generated, is shown for both fields in Figure 2. The completeness functions are very similar, achieving the at . This value was considered as the faint magnitude limit in the following analysis.
The comparison between the initial brightness of artificial stars and their subsequent photometry proved that the application of the median filter does not modify the point source photometry.
3 Results
3.1 GC candidates selection from colours
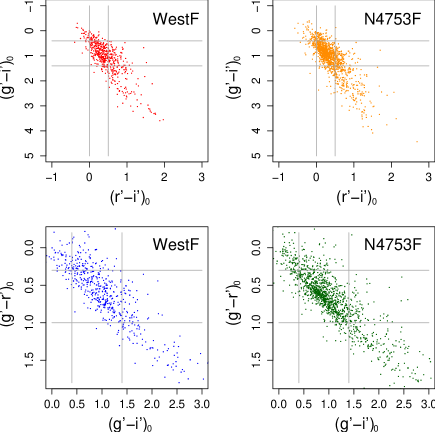
Figure 3 shows vs. and vs. colour-colour diagrams (CCD) for point sources in both fields. Old GCs present narrow colour ranges, which can be helpful to distinguish them from contamination in the CCDs (e.g. Faifer et al. 2011; Escudero et al. 2015). It is particularly evident in the N4753F, where it is expected to find the majority of the GCs belonging to NGC 4753 system. We selected as GC candidates the point sources ranging , and . These values are similar to those chosen by Faifer et al. (2011) and Escudero et al. (2015). The number of point sources brighter than (our 80% completeness limit, see above) that fulfill the colour criteria are 437 in the N4753F, 117 in the WestF, and 32 in the WHDF.
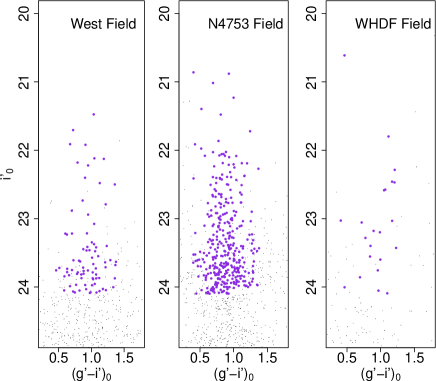
In Figure 4 we show the vs. colour-magnitude diagrams for the three fields. The black dots represent the point sources, after the and sharpness selection. The blueviolet filled circles highlight those objects that fulfill the colours and magnitude criteria indicated before. The CMD in the middle panel, corresponding to N4753F, shows that GC candidates span a rather large range, with a large fraction of blue GCs. Comparing the CMDs from the WestF and WHDF, it can be seen that some GC candidates are still present in the former one. If we assume that the brightness limit between ultra-compact dwarfs (UCDs) and ‘classical’ GCs is (e.g. Mieske et al. 2006; Hilker 2009; Caso et al. 2013a, 2014), at NGC 4753 distance implies . Hence, NGC 4753 does not seem to present any candidate to UCD.
3.2 Colour distribution
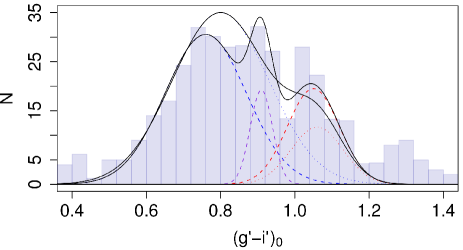
The Figure 5 shows the colour distribution for the GC candidates with , applying a binwidth of 0.04 mag. The colour distribution seems to deviates from the typical bimodal pattern, frequently seen in early-type galaxies (e.g. Forte et al. 2014; Brodie et al. 2014, and references there in). We fit means and dispersions for bimodal and trimodal distributions, using the Gaussian Mixture Method (GMM, Muratov & Gnedin 2010). The results are listed in Table 1, where we also include the fractions of each subpopulation as well as the DD parameter, that indicates whether an specific multimodal distribution provides a realistic fit (where the null hypothesis is accepted for DD). For the three components distribution, the single Gaussians are plotted with dashed lines. Doted lines represent the Gaussians for the bimodal distribution.
If we consider all GC candidates together (first and second rows in Table 1), we can see that for the trimodal distribution, the bluer and redder Gaussian means resemble those of blue and red GC (metal-poor and metal-rich) subpopulations, respectively (e.g. Faifer et al. 2011; Salinas et al. 2015). However, there is evidence of a third population, presenting intermediate colours. This may reflect a complex evolutionary history, similar to other early-type galaxies in low-density environments (e.g. Caso et al. 2013b; Escudero et al. 2015). The intermediate GC subpopulation presents mean in all cases (Table 1). We compare this colour with the theoretical models of single stellar populations (SSPs) by Bressan et al. (2012), using their web-based tool 222http://stev.oapd.inaf.it/cgi-bin/cmd. If we consider SSPs with metallicities and , a Chabrier (2001) lognormal IMF, and absorption (NED), the mean colour for the intermediate subpopulation corresponds to a population of Gyr. This age is consistent with the existence of SNIa in the galaxy population. The derived ages shoul be interpreted as raw estimations. The selection of these particular metallicities, as well as the IMF, might introduce systematic errors.
Another interesting issue is that if we consider the bimodal distribution, the mean value, dispersion and fraction of blue GCs are in agreement, within uncertainties, with the equivalent values of blue GCs from the trimodal distribution. However, the fraction of red GCs in the bimodal case, seems to include approximately the intermediate plus the red subpopulations of the trimodal case. That is, the blue subpopulation remains almost unchanged. This might be the reason for the overestimation of the red population in Figure 5.
In order to look for radial gradients, we separate the sample in two radial regimes. We assume an elliptical projected spatial distribution, with PA and ellipticity equal to and (see Section 3.3). The adopted radial galactocentric limit is taken as arcmin, which results in two samples with similar number of GC candidates. The results for both radial ranges are depicted in the four following rows of Table 1. In both cases, the values from GMM indicate that a trimodal profile could represent the colour distribution. The means and dispersions are similar, but the intermediate subpopulation dominates the distribution when we move towards larger galactocentric distances, at the expense of the blue subpopulation.
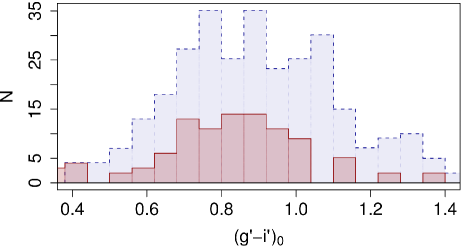
The comparison between faint and bright GCs also reveals different behaviours in the colour distribution. The selection of as the adopted magnitude limit to separate bright and faint GCs is based on the GCs CMD (Fig. 4), and luminosity function (GCLF) (see Section 3.4. Despite of the similarity in means and dispersions, the weight of the different populations in the colour distribution differs significantly. The faint GCs seem to present a trimodal distribution, as well as the entire sample. The presence of the red population in the bright sample seems marginal (lower panel of Fig 5).
| DD | ||||||||||
|---|---|---|---|---|---|---|---|---|---|---|
| All GC candidates | ||||||||||
| Trimodal | ||||||||||
| Bimodal | ||||||||||
| Trimodal | ||||||||||
| Bimodal | ||||||||||
| Trimodal | ||||||||||
| Bimodal | ||||||||||
| Trimodal | ||||||||||
| Bimodal | ||||||||||
| Trimodal | ||||||||||
| Bimodal | ||||||||||
Thus, both bimodal and trimodal distributions seem to represent the colour distribution with different degree of accuracy. However, the dependences of the distribution with galactocentric radius and brightness point to a GCS built with three different components.
3.3 Azimuthal and radial distributions
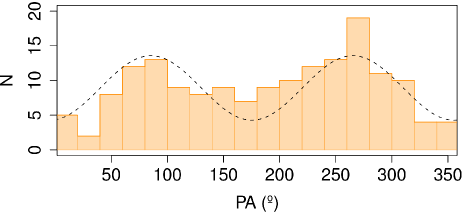
The upper panel of Figure 6 shows the azimuthal distribution for all the GC candidates at less than 2.5 arcmin from the galaxy centre. This limit is chosen to achieve an homogeneous azimuthal coverage, according to the field-of-view of the GMOS field. The position angle (PA) of the GCs projected distribution is measured from North through East, and the bin width is . Considering that an elliptical GCS causes a sinusoidal distribution in this diagram, we fit a cosine function to the histogram. The fitted PA is , which is in agreement with the galaxy light PA (see Section 3.5). The amplitude and the symmetry axis offset are and , respectively.
The lower panel of Figure 6 exhibits the logarithm of the background corrected radial distribution for the GC candidates. The population of the GCS is not large enough to discriminate between different subpopulations.
Due to the elongated spatial distribution of the GCS, we considere concetric ellipses instead of circles. The ellipses PA is the previously fitted one, while the ellipticity was assumed as , obtained from the galaxy diffuse light (see Section 3.5). The horizontal dashed line indicates the background level, while the dotted one is the of it. We propose this limit to define the GCS extension, which has been previously used in similar studies (e.g. Bassino et al. 2006a; Caso et al. 2013b). The background corrected distribution can be fit by a power-law, with slope . According to this, the total extension of the GCS is arcmin (i.e., kpc). The inner bin of the radial distribution seems to underestimate the GCs density. This is probably due to a higher imcompleteness, caused by the high surface brightness of the galaxy, plus its striking dust structure.

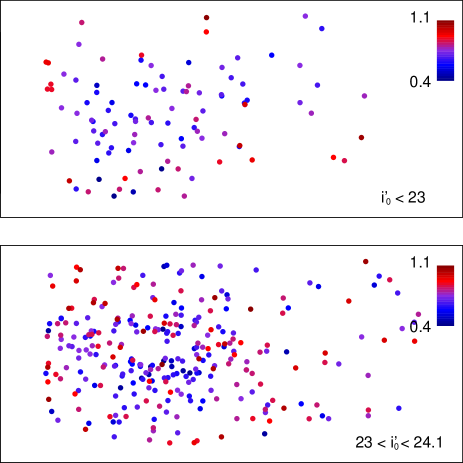
The projected spatial distribution for GC candidates for two different magnitude bins is shown in Figure 7. The colour gradient in both panels spans the range . North is up, and East to the left. It seems that GC candidates brighter than , mainly blue candidates, present inhomogeneities in their spatial distribution. In particular, there is a paucity of GCs to the North of NGC 4753. The faint GC candidates present a much homogeneus spatial distribution, although they follow the major axis of the galaxy (approximately in the East-West direction). It can be seen GCs from the three subpopulations at large projected distances from the the galaxy. This deviates from the usual scenario, where the blue GCs are more spread, following the X-ray gas emission (e.g. Forte et al. 2005; Forbes et al. 2012; Escudero et al. 2015), and the red ones are more concentrated, following the galaxy light (e.g. Bassino et al. 2006a).
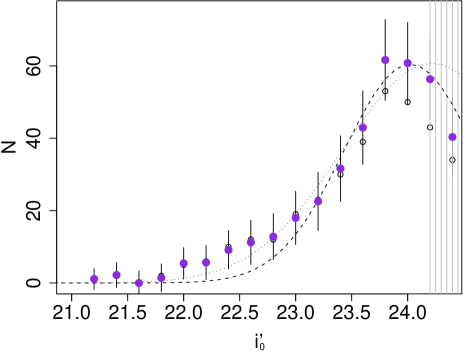
3.4 Luminosity function and total number of GCs
In order to facilitate the calculus of the total number of GCs, we obtain the GCLF for those GCs located within two concentric ellipses with the same PA and ellipticity, equal to and , respectively (see Section 3.3), and major semiaxes 1.25 and 3.6 arcmin. Figure 8 shows the raw GCLF with open circles, and the background and completeness corrected one with blueviolet filled circles. The errorbars assume Poisson uncertainties for science and background measurements, and the binwidth is 0.2. The vertical lines indicate the luminosity range that has not been considered in the GCLF fitting, due the declining completeness (we selected the limit in Section 2.4). It can be noticed a change in the GCLF behaviour around , showing an excess of bright GCs in comparison with faint ones. We fitted a Guassian profile to the entire GCLF, which is represented by the dotted curve. The resulting turn-over magnitude (TOM) and dispersion are and , where the second uncertainty comes from the binning considered here. If we fit just the GCLF bins with , we obtain a Gaussian profile slightly different, which is plotted with a dashed curve. Comparing both profiles, it is clear that the excess of bright GCs results in a higher dispersion for the fitted Gaussian, and consequently the TOM moves slightly towards fainter values. The TOM and dispersion in this latter case are and , respectively. In the following, we will assume that these parameters represent the GCLF for NGC 4753.
Usually, old GC populations present a Gaussian GCLF, with a TOM in the -band of (e.g. Richtler 2003; Jordán et al. 2007). The GC candidates fainter than present a mean colour , and then . Applying Equation 2 from Faifer et al. (2011), the TOM in the filter is , which implies that the distance moduli and metric distance result and Mpc, respectively. This distance is in agreement with previous measurements from SBF (Tonry et al. 2001) and SNIa light-curves (Parodi et al. 2000; Reindl et al. 2005). GCLF dispersion seem to be lower than expected.
The numerical integration of the Gaussian profile results in GCs. We have to consider that the GCLF was obtained from the GC candidates in a specific radial regime, that does not span the entire GCS extension. From the density profile derived in Section 3.3, we calculate the ratio of GCs in the radial regime arcmin to GCs in the radial regime arcmin, . Due to the incompleteness, we cannot derive the surface density of GCs in the inner arcmin. A common criterion in GC studies is to adopt for this region the same surface density as for the first bin (e.g. Bassino et al. 2006b; Caso et al. 2013b), and correct it for completeness. This can be done, assuming that the radial distribution of GCs flattens in the inner region of a galaxy (e.g. Elson et al. 1998). Hence, we obtain GCs. We have not considered yet the excess of bright GCs. We can do that subtracting to each GCLF bin the numerical integration of the Gaussian profile fitted to the GCs fainter than . The sum of this excess result in GCs. Then, the number of members of the NGC 4753 GCS is . Assuming the total magnitude obtained by the Carnegie-Irvine Galaxy Survey (Ho et al. 2011), , and the distance moduli previously derived, , the absolute magnitude of the galaxy is . Then, the specific frequency results .
3.5 NGC 4753 surface photometry
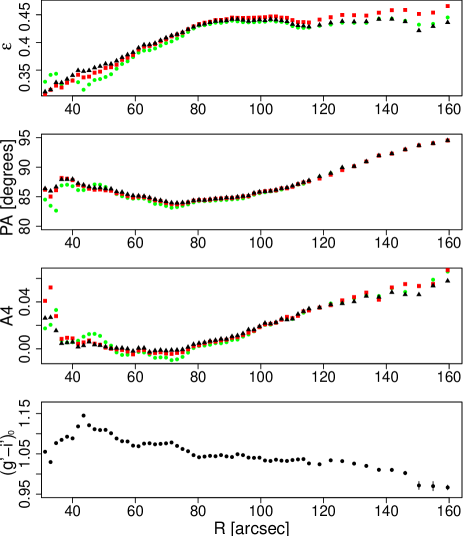
NGC 4753 presents several dust filaments crossing its centre, mainly in the East-West direction, as well as faint plums in the outskirts of the galaxy. Since their presence could point to a distorted structure, we obtained NGC 4753 surface brightness profiles in the Gemini GMOS-S , and exposures and the MOSAIC II image applying the task ELLIPSE, within iraf.
Figure 9 shows the radial dependence of some important morphological parameters, derived for , and filters. No striking difference is seen among them in ellipticity, position angle or the higher harmonic A4 associated to diskyness/boxyness. The strong isophote twisting which is present in the inner part of the galaxy (at radii smaller than 40 arcsec) is not shown since ellipses are not representative here. It is apparent that the variation in the PA at small radii is wider in than , as expected from dusty substructures. The parameter A4 is mainly positive, which is expected in disky isophotes, from rotationally supported galaxies. The colour profile presents a slight gradient, becoming bluer towards the outskirts.
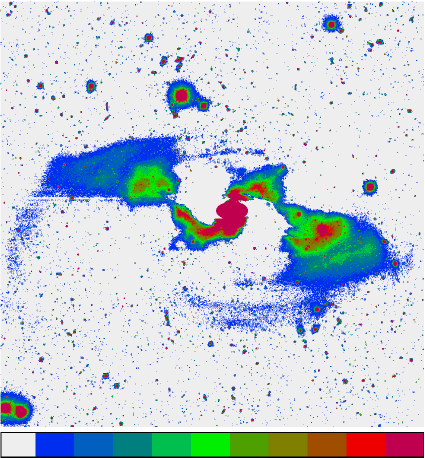
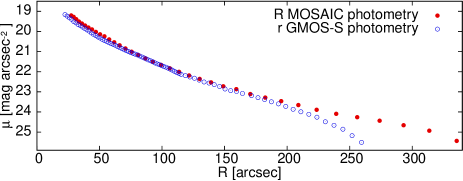
The filled circles in the lower panel of Figure 10 represent the profile in the filter. For comparison, the surface brightness profile in the filter was overimposed, assuming (Fukugita et al. 1995). Both profiles match within 200 arcsec. The differences for larger radii are due to the smaller GMOS field of view. The upper panel from Figure 10 shows the residual map obtained from the subtraction of the galaxy model to the original image. The image spans . There is clear evidence of underlying substructure. The most striking features are two opposite lobes, that seem to be connected to the galaxy centre by spiral remmants. Sparser spiral remmants are identified in the outskirts.
4 Discussion
4.1 The paucity of GCs in galaxies with Type Ia Supernovae
The work on Supernovae rates, specially over the last years has led to a current knowledge of this subject where star formation rates (hereafter SFR) are unarguably linked to SN rates (Cappellaro et al. 1999; Mannucci et al. 2005; Sullivan & et al. 2006).
While it is natural to understand the presence of core-collapse SNe in starburst galaxies, the case of type Ia SNe in early-type galaxies is particularly intriguing.
In their study of the correlation between age, metallicity and SNIa peak magnitude, Gallagher et al. (2008) find that the presence of SNIa in an elliptical galaxy is not dependent on its age or metallicity. They claim, however, that peak Ia luminosities are correlated with age, while the trend observed with metallicity is an artifact. In addition, they observe that the rate of Ia SNe is higher in E/S0 galaxies with spectroscopic ages younger than 3 Gyr than in their older counterparts.
Given the mounting evidence favouring the SFR-SNeIa connection, one would expect to see young or intermediate-age populations in E/S0 galaxies that hosted SNIa. Indeed, some striking examples exist of early-type galaxies hosting SNIa’s (NGC 1316 Stritzinger et al. 2010, NGC 4374 Cantiello et al. 2011, NGC 5128 Jha et al. 2007).
In NGC 1316, intermediate-age globular clusters have been spectroscopically suspected (Gómez et al. 2001) and spectroscopically confirmed (Goudfrooij et al. 2001). Also the kinematics of this GCS is particularly complex, probably as a consequence of the 2 Gyr merger event (Richtler et al. 2014). Moreover, the GCs colour distribution presents a distinctive composition, with a bright population in the bulge that might be dominated by young and intermediate age GCs (Richtler et al. 2012).
A common feature of these GCSs, which is observed in NGC 4753 as well, seems to be a low specific frequency (e.g. Gómez et al. 2001; Richtler et al. 2012). This could be explained by a dearth of globulars or by a luminosity excess caused, for instance, by the presence of younger stellar populations.
4.2 NGC 4753 and the general scheme of lenticulars evolution
In the current scheme, the evolution from spirals to lenticular galaxies in dense environments is due to their interaction with the media or with their close neighbours (Moore et al. 1999; Bekki et al. 2002; Sun et al. 2006; Barr et al. 2007; Wilman & Erwin 2012; Johnston et al. 2014). However, this mechanisms fail to explain the existence of S0s in low density environments, like the one where NGC 4753 is located in, and alternative origins should be considered (Stocke et al. 2004). Tal et al. (2009) studied a sample of bright field Es and considered that the tidal features found in the diffuse light distribution of most of them, are evidence of mostly recent mergers. In that sense, the tidal features in NGC 4753 could also be related to a past minor merger.
On the basis of a “mock” catalogue created from the Millennium Simulation, Niemi et al. (2010) have shown that almost all isolated E galaxies have undergone merging activity during their formation history. This is supported by the evidence of merger events in S0 galaxies in low density environments, e.g. the case of NGC 6861 which was identified by Escudero et al. (2015) by studying their GCs. Inhomogeneities in the projected spatial distribution of GCs, as spiral-like features, streams and/or arcs, have also been found in other early-type galaxies and interpreted as remnants of past mergers (D’Abrusco et al. 2013; D’Abrusco et al. 2014a, b). On the other side, several galaxies that are likely remnants of recent mergers have GCs of intermediate-age (about Gyr), as shown by means of combined optical and NIR photometry by Trancho et al. (2014). That is, in different ways, GCs may be part of such intermediate-age populations.
In the framework of the Project ATLAS3D (Cappellari et al. 2011), a study of the distribution and kinematics of CO gas in a sample of early-type galaxies (Alatalo et al. 2013) has been presented, being NGC 4753 one of their targets. According to the CO maps, this galaxy is assigned a morphological classification M (“Mildly disrupted”) due to the intrincated dust filaments. Although generally dust and CO have similar distributions, NGC 4753 is one of the clear cases in which dust is more extended than the detected CO (their Fig. 3). The CO velocity map of NGC 4753 is presented in their Fig. 2 and A20, showing that NGC 4753 is a massive regular rotator. On the basis of the firm statement f rom Steiman-Cameron et al. (1992), regarding that the dust distribution may be understood as a precessing disc, the molecular CO disc can be also considered unsettled, with an external origin (e.g. an accretion event).
Unusual behaviours in the colour distribution (e.g. Gómez et al. 2001; Richtler et al. 2012; Caso et al. 2013b; Escudero et al. 2015), or GCLF (e.g. Goudfrooij et al. 2007) have been considered evidence for GC subpopulations with intermediate ages, asociated with late mergers. In some cases, it has been spectroscopically confirmed (Goudfrooij et al. 2001; Strader et al. 2004). These features are also present in NGC 4753 GCS, pointing to the presence of GCs with intermediate ages, probably related to the same stellar population that produced the SNIa. In this sense, another hint in NGC 4753 is the spatial projected distribution of GCs, which differs from the usual scenario in early-type galaxies, with red GCs concentrated towards the galaxy, while blue ones form a more extended halo (e.g. Bassino et al. 2006a; Usher et al. 2013; Durrell et al. 2014).
5 Summary and Conclusions
In this work, the first detailed optical study of the GCS surrounding the galaxy NGC 4753 is presented. This bright galaxy (), classified as lenticular as well as irregular, presents a remarkable dust structure with large filaments and is located in a low-density environmet. All these characteristics make it a good target to study galaxy evolution in the context of the current galaxy formation theories.
On the basis of GMOS , , images obtained at Gemini-South Observatory, and Mosaic II images from the Blanco 4-m telescope at Cerro Tololo Interamerican Observatory, we performed the photometry of the GC candidates and surface photometry of the galaxy itself. As expected for this galaxy, several properties of the GCS are peculiar. The GC colour distribution can be well fitted by a trimodal set of blue/intermediate/red subpopulations, instead of just the common blue/red one. The fraction of blue GC candidates is similar to that of intermediate plus red ones. The intermediate-colour subpopulation can be explained as a SSP of an intermediate age, i.e. Gyr. The GCLF can be fitted by a Gaussian, but an excess of bright globulars is present for mag. If the projected distribution of such a bright subsample is analyzed, it shows inhomogeneities in their azimuthal distribution, with fewer candidates towards the North. Integrating the GCLF, an estimation of GC candidates is obtained for the whole GCS, which leads to a specific frequency of , also a quite low value for such a massive galaxy.
The surface photometry of the galaxy reveals a complex underlying substructure. In addition to the twisted dust lanes and filaments, a pair of inner distorted spiral arms linked to another pair of outer ones appear when a smoothed light model is subtracted from the image. Some plums in the outskirts are also visible in the residual map. Another peculiarity of NGC 4753 is that it hosted two SNIa (SN1965I and SN1983G), i.e. a high SNIa rate for a lenticular galaxy, that is usually related to the existence of intermediate-age population. We suggest that the intermediate-colour subpopulation of GCs is probably one of the components of that population.
All these properties of NGC 4753 and of its GCS, converge to a scenario of a quite recent accretion event or merger, that might have taken place Gyr ago. The intermediate-age population that might have formed then, may be identified by the intermediate colour GC subpopulation and the high SN rate of this galaxy.
Acknowledgments
This work was funded with grants from Consejo Nacional de Investigaciones
Científicas y Técnicas de la República Argentina, Agencia Nacional de
Promoción Científica y Tecnológica, and Universidad Nacional de La Plata
(Argentina). MG thanks UNAB/DGID for financial support.
Based on observations obtained at
the Gemini Observatory, which is operated by the Association of Universities
for Research in Astronomy, Inc., under a cooperative agreement with the NSF on
behalf of the Gemini partnership: the National Science Foundation (United
States), the National Research Council (Canada), CONICYT (Chile), the
Australian Research Council (Australia), Ministério da Ciência,
Tecnologia e Inovação (Brazil) and Ministerio de Ciencia,
Tecnología e Innovación Productiva (Argentina), and on observations
acquired through the Gemini Science Archive.
This research has made use of the NASA/IPAC Extragalactic Database (NED) which
is operated by the Jet Propulsion Laboratory, California Institute of Technology,
under contract with the National Aeronautics and Space Administration.
We thank the refereee for his/her suggestions which greatly improved this article.
References
- Alatalo et al. (2013) Alatalo K., Davis T. A., Bureau M., Young L. M., Blitz L., Crocker A. F., Bayet E., Bois M., Bournaud F., Cappellari M., Davies R. L., de Zeeuw P. T., Duc P.-A., Emsellem E., Khochfar S., 2013, MNRAS, 432, 1796
- Barr et al. (2007) Barr J. M., Bedregal A. G., Aragón-Salamanca A., Merrifield M. R., Bamford S. P., 2007, A&A, 470, 173
- Bassino et al. (2006a) Bassino L. P., Faifer F. R., Forte J. C., Dirsch B., Richtler T., Geisler D., Schuberth Y., 2006a, A&A, 451, 789
- Bassino et al. (2006b) Bassino L. P., Richtler T., Dirsch B., 2006b, MNRAS, 367, 156
- Bekki et al. (2002) Bekki K., Couch W. J., Shioya Y., 2002, ApJ, 577, 651
- Bertin & Arnouts (1996) Bertin E., Arnouts S., 1996, A&AS, 117, 393
- Bressan et al. (2012) Bressan A., Marigo P., Girardi L., Salasnich B., Dal Cero C., Rubele S., Nanni A., 2012, MNRAS, 427, 127
- Brodie et al. (2014) Brodie J. P., Romanowsky A. J., Strader J., Forbes D. A., Foster C., Jennings Z. G., Pastorello N., Pota V., Usher C., Blom C., Kader J., Roediger J. C., Spitler L. R., Villaume A., Arnold J. A., Kartha S. S., Woodley K. A., 2014, ApJ, 796, 52
- Brodie & Strader (2006) Brodie J. P., Strader J., 2006, ARA&A, 44, 193
- Brüns & Kroupa (2012) Brüns R. C., Kroupa P., 2012, A&A, 547, A65
- Buta et al. (1985) Buta R. J., Corwin Jr. H. G., Opal C. B., 1985, PASP, 97, 229
- Cantiello et al. (2011) Cantiello M., Biscardi I., Brocato E., Raimondo G., 2011, A&A, 532, A154
- Cappellari et al. (2011) Cappellari M., Emsellem E., Krajnović D., McDermid R. M., Scott N., Verdoes Kleijn G. A., Young L. M., Alatalo K., Bacon R., Blitz L., Bois M., Bournaud F., Bureau M., Davies R. L., 2011, MNRAS, 413, 813
- Cappellaro et al. (1999) Cappellaro E., Evans R., Turatto M., 1999, A&A, 351, 459
- Caso et al. (2014) Caso J. P., Bassino L. P., Richtler T., Calderón J. P., Smith Castelli A. V., 2014, MNRAS, 442, 891
- Caso et al. (2013a) Caso J. P., Bassino L. P., Richtler T., Smith Castelli A. V., Faifer F. R., 2013a, MNRAS, 430, 1088
- Caso et al. (2013b) Caso J. P., Richtler T., Bassino L. P., Salinas R., Lane R. R., Romanowsky A., 2013b, A&A, 555, A56
- Chabrier (2001) Chabrier G., 2001, ApJ, 554, 1274
- Ciatti & Barbon (1971) Ciatti F., Barbon R., 1971, MSAI, 42, 145
- D’Abrusco et al. (2014a) D’Abrusco R., Fabbiano G., Brassington N. J., 2014a, ApJ, 783, 19
- D’Abrusco et al. (2014b) D’Abrusco R., Fabbiano G., Mineo S., Strader J., Fragos T., Kim D.-W., Luo B., Zezas A., 2014b, ApJ, 783, 18
- D’Abrusco et al. (2013) D’Abrusco R., Fabbiano G., Strader J., Zezas A., Mineo S., Fragos T., Bonfini P., Luo B., Kim D.-W., King A., 2013, ApJ, 773, 87
- del Río et al. (2004) del Río M. S., Brinks E., Cepa J., 2004, AJ, 128, 89
- Dewangan et al. (1999) Dewangan G. C., Singh K. P., Bhat P. N., 1999, AJ, 118, 785
- Dirsch et al. (2003) Dirsch B., Richtler T., Geisler D., Forte J. C., Bassino L. P., Gieren W. P., 2003, AJ, 125, 1908
- Durrell et al. (2014) Durrell P. R., Côté P., Peng E. W., Blakeslee J. P., Ferrarese L., Mihos J. C., Puzia T. H., Lançon A., Liu C., Zhang H., Cuillandre J.-C., McConnachie A., Jordán A., Accetta K., Boissier S., Boselli A., Courteau S., 2014, ApJ, 794, 103
- Elson et al. (1998) Elson R. A. W., Grillmair C. J., Forbes D. A., Rabban M., Williger G. M., Brodie J. P., 1998, MNRAS, 295, 240
- Escudero et al. (2015) Escudero C. G., Faifer F. R., Bassino L. P., Calderón J. P., Caso J. P., 2015, MNRAS, 0, 0
- Faifer et al. (2011) Faifer F. R., Forte J. C., Norris M. A., Bridges T., Forbes D. A., Zepf S. E., Beasley M., Gebhardt K., Hanes D. A., Sharples R. M., 2011, MNRAS, 416, 155
- Finkelman et al. (2012) Finkelman I., Brosch N., Funes J. G., Barway S., Kniazev A., Väisänen P., 2012, MNRAS, 422, 1384
- Forbes et al. (2012) Forbes D. A., Ponman T., O’Sullivan E., 2012, MNRAS, 425, 66
- Forte et al. (2005) Forte J. C., Faifer F., Geisler D., 2005, MNRAS, 357, 56
- Forte et al. (2014) Forte J. C., Vega E. I., Faifer F. R., Smith Castelli A. V., Escudero C., González N. M., Sesto L., 2014, MNRAS, 441, 1391
- Fukugita et al. (1995) Fukugita M., Shimasaku K., Ichikawa T., 1995, PASP, 107, 945
- Gallagher et al. (2008) Gallagher J. S., Garnavich P. M., Caldwell N., Kirshner R. P., Jha S. W., Li W., Ganeshalingam M., Filippenko A. V., 2008, ApJ, 685, 752
- Garcia (1993) Garcia A. M., 1993, A&AS, 100, 47
- Geisler et al. (1996) Geisler D., Lee M. G., Kim E., 1996, AJ, 111, 1529
- Gómez et al. (2001) Gómez M., Richtler T., Infante L., Drenkhahn G., 2001, A&A, 371, 875
- Goudfrooij et al. (2001) Goudfrooij P., Alonso M. V., Maraston C., Minniti D., 2001, MNRAS, 328, 237
- Goudfrooij et al. (2007) Goudfrooij P., Schweizer F., Gilmore D., Whitmore B. C., 2007, AJ, 133, 2737
- Gunn & Gott (1972) Gunn J. E., Gott III J. R., 1972, ApJ, 176, 1
- Harris & van den Bergh (1981) Harris W. E., van den Bergh S., 1981, AJ, 86, 1627
- Hilker (2009) Hilker M., 2009, ArXiv e-prints
- Ho et al. (2011) Ho L. C., Li Z.-Y., Barth A. J., Seigar M. S., Peng C. Y., 2011, ApJS, 197, 21
- Jha et al. (2007) Jha S., Riess A. G., Kirshner R. P., 2007, ApJ, 659, 122
- Johnston et al. (2014) Johnston E. J., Aragón-Salamanca A., Merrifield M. R., Bedregal A. G., 2014, in Seigar M. S., Treuthardt P., eds, Structure and Dynamics of Disk Galaxies Vol. 480 of Astronomical Society of the Pacific Conference Series, Clues to the Formation of Lenticular Galaxies Using Spectroscopic Bulge-Disk Decomposition. p. 161
- Jordán et al. (2007) Jordán A., McLaughlin D. E., Côté P., Ferrarese L., Peng E. W., Mei S., Villegas D., Merritt D., Tonry J. L., West M. J., 2007, ApJs, 171, 101
- Karachentsev & Nasonova (2013) Karachentsev I. D., Nasonova O. G., 2013, MNRAS, 429, 2677
- Kosai et al. (1983) Kosai H., Kozai Y., Okazaki K., Evans R. O., Thompson G., Argyle R. W., Sinclair J. E., 1983, IAU circ., 3789, 1
- Kruijssen (2014) Kruijssen J. M. D., 2014, Classical and Quantum Gravity, 31, 244006
- Li & Gnedin (2014) Li H., Gnedin O. Y., 2014, ApJ, 796, 10
- Li et al. (2009) Li J.-T., Wang Q. D., Li Z., Chen Y., 2009, ApJ, 706, 693
- Mannucci et al. (2005) Mannucci F., Della Valle M., Panagia N., Cappellaro E., Cresci G., Maiolino R., Petrosian A., Turatto M., 2005, A&A, 433, 807
- Mieske et al. (2006) Mieske S., Hilker M., Infante L., Jordán A., 2006, AJ, 131, 2442
- Moiseev et al. (2010) Moiseev A., Karachentsev I., Kaisin S., 2010, MNRAS, 403, 1849
- Moore et al. (1996) Moore B., Katz N., Lake G., Dressler A., Oemler A., 1996, Nature, 379, 613
- Moore et al. (1999) Moore B., Lake G., Quinn T., Stadel J., 1999, MNRAS, 304, 465
- Moran et al. (2006) Moran S. M., Ellis R. S., Treu T., Salim S., Rich R. M., Smith G. P., Kneib J.-P., 2006, ApJL, 641, L97
- Mueller & Hoeflich (1994) Mueller E., Hoeflich P., 1994, A&A, 281, 51
- Muratov & Gnedin (2010) Muratov A. L., Gnedin O. Y., 2010, ApJ, 718, 1266
- Navasardyan et al. (2001) Navasardyan H., Petrosian A. R., Turatto M., Cappellaro E., Boulesteix J., 2001, MNRAS, 328, 1181
- Niemi et al. (2010) Niemi S.-M., Heinämäki P., Nurmi P., Saar E., 2010, MNRAS, 405, 477
- Parodi et al. (2000) Parodi B. R., Saha A., Sandage A., Tammann G. A., 2000, ApJ, 540, 634
- Reindl et al. (2005) Reindl B., Tammann G. A., Sandage A., Saha A., 2005, ApJ, 624, 532
- Richtler (2003) Richtler T., 2003, in Alloin D., Gieren W., eds, Stellar Candles for the Extragalactic Distance Scale Vol. 635 of Lecture Notes in Physics, Berlin Springer Verlag, The Globular Cluster Luminosity Function: New Progress in Understanding an Old Distance Indicator. pp 281–305
- Richtler et al. (2012) Richtler T., Bassino L. P., Dirsch B., Kumar B., 2012, A&A, 543, A131
- Richtler et al. (2014) Richtler T., Hilker M., Kumar B., Bassino L. P., Gómez M., Dirsch B., 2014, A&A, 569, A41
- Salinas et al. (2015) Salinas R., Alabi A., Richtler T., Lane R. R., 2015, A&A, 577, 59
- Sandage (1961) Sandage A., 1961, The Hubble atlas of galaxies
- Schlafly & Finkbeiner (2011) Schlafly E. F., Finkbeiner D. P., 2011, ApJ, 737, 103
- Secker (1995) Secker J., 1995, PASP, 107, 496
- Smith & et al. (2002) Smith J. A., et al. 2002, AJ, 123, 2121
- Spitzer & Baade (1951) Spitzer Jr. L., Baade W., 1951, ApJ, 113, 413
- Steiman-Cameron et al. (1992) Steiman-Cameron T. Y., Kormendy J., Durisen R. H., 1992, AJ, 104, 1339
- Stetson (1987) Stetson P. B., 1987, PASP, 99, 191
- Stocke et al. (2004) Stocke J. T., Keeney B. A., Lewis A. D., Epps H. W., Schild R. E., 2004, AJ, 127, 1336
- Strader et al. (2004) Strader J., Brodie J. P., Forbes D. A., 2004, AJ, 127, 295
- Stritzinger et al. (2010) Stritzinger M., Burns C. R., Phillips M. M., Folatelli G., Krisciunas K., Kattner S., Persson S. E., Boldt L., Campillay A., Contreras C., Krzeminski W., Morrell N., Salgado F., Freedman W. L., Hamuy M., 2010, AJ, 140, 2036
- Sullivan & et al. (2006) Sullivan M., et al. 2006, ApJ, 648, 868
- Sun et al. (2006) Sun M., Jones C., Forman W., Nulsen P. E. J., Donahue M., Voit G. M., 2006, ApJL, 637, L81
- Tal et al. (2009) Tal T., van Dokkum P. G., Nelan J., Bezanson R., 2009, AJ, 138, 1417
- Theureau et al. (2007) Theureau G., Hanski M. O., Coudreau N., Hallet N., Martin J.-M., 2007, A&A, 465, 71
- Thilker et al. (2010) Thilker D. A., Bianchi L., Schiminovich D., Gil de Paz A., Seibert M., Madore B. F., Wyder T., Rich R. M., Yi S., Barlow T., Conrow T., Forster K., Friedman P., Martin C., Morrissey P., Neff S., Small T., 2010, ApJL, 714, L171
- Tonini (2013) Tonini C., 2013, ApJ, 762, 39
- Tonry et al. (2001) Tonry J. L., Dressler A., Blakeslee J. P., Ajhar E. A., Fletcher A. B., Luppino G. A., Metzger M. R., Moore C. B., 2001, ApJ, 546, 681
- Trancho et al. (2014) Trancho G., Miller B. W., Schweizer F., Burdett D. P., Palamara D., 2014, ApJ, 790, 122
- Usher et al. (2013) Usher C., Forbes D. A., Spitler L. R., Brodie J. P., Romanowsky A. J., Strader J., Woodley K. A., 2013, MNRAS, 436, 1172
- van den Bergh (2009a) van den Bergh S., 2009a, ApJ, 702, 1502
- van den Bergh (2009b) van den Bergh S., 2009b, ApJL, 694, L120
- Wilman & Erwin (2012) Wilman D. J., Erwin P., 2012, ApJ, 746, 160
- Zaritsky et al. (2015) Zaritsky D., Aravena M., Athanassoula E., Bosma A., Comerón S., Elmegreen B. G., Erroz-Ferrer S., Gadotti D. A., Hinz J. L., Ho L. C., Holwerda B., Knapen J. H., Laine J., Laurikainen E., Muñoz-Mateos J. C., Salo H., Sheth K., 2015, ApJ, 799, 159
- Zepf & Ashman (1993) Zepf S. E., Ashman K. M., 1993, MNRAS, 264, 611