Spectroscopic studies of an ultraluminous supersoft X-ray source in M81
Abstract
Ultraluminous supersoft X-ray sources (ULS) exhibit supersoft X-ray spectra with blackbody temperatures below 0.1 keV and bolometric luminosities above 1039 ergs s-1. In this Letter we report the first optical spectroscopic observations of a ULS in M81 using the LRIS spectrograph on the Keck I telescope. The detected Balmer emission lines show the mean intrinsic velocity dispersion of 400 80 km s-1, which are consistent with from an accretion disk. The spectral index of the continuum on the blue side is also consistent with the multi-color disk model. The Hα emission line exhibits a velocity of 180 km/s relative to the local stellar environment, suggesting this ULS is possibly a halo system in M81 belonging to an old population. No significant shift is found for the Hα emission line between two observations separated by four nights.
Subject headings:
galaxies: individual (M81) — X-rays: binaries1. Introduction
Ultraluminous supersoft X-ray sources (ULSs) are pointlike, non-nuclear X-ray sources having extremely soft spectra with equivalent blackbody temperatures below 0.1 keV and bolometric luminosities above 1039 ergs s-1. They are thought to be massive white dwarfs (WDs) burning accreted material on their surface or intermediate-mass black holes (IMBHs; 10104 ) with sub-Eddington accretion (Liu & Di Stefano, 2008).
Swartz et al. (2002) observed the nearby spiral galaxy M81 with Chandra ACIS, and discovered an intriguing ULS in the bulge, R.A. = 09h55m42.2s, dec. = 69°03′36.5″ (J2000.0) (heareafter M81 ULS1). Its spectrum can be fitted by a blackbody model with a temperature of 70 eV. The bolometric luminosity calculated with the distance of M81 is 1039 ergs s-1. The follow-up X-ray study reveals that its spectrum can be described by either a blackbody for a WD or a multi-color accretion disk for an IMBH (Liu, 2008).
Its optical counterpart was detected by Hubble Space Telescope (; Liu & Di Stefano 2008). The spectral energy distribution (SED) from broad-bands photometry exhibits a blue and a red component. The spectral index of the blue component is consistent with a geometrically thin accretion disk, and the red component could be described by an AGB star. The SED also shows excessive Hα emission which is probably originated from the accretion disk or surrounding material photo-ionized by the soft X-ray emission of M81 ULS1, but the band photometry results cannot provide the width of the emission line known as an indicator of physical process.
The SED measurements, however, suffer from the intrinsic variabilities of ULS1, since a flux decrease by a factor of 2.4, as Tao et al. (2011) presented, occurred in less than a week in optical wavelength. Spectral observations, on the other hand, are independent of the variabilities. The expected Balmer emission lines in the spectrum will enable us not only to characterize its physical conditions but also to probe its local environments (Moon et al., 2011). This information is essential for us to understand the nature of M81 ULS1.
2. Data Analysis and Results
The observations of M81 ULS1 occurred on 2010 April 13 and 2010 April 17 during its expected X-ray-low state (Wang et al., 2015) using the Low Resolution Imaging Spectrograph (LRIS) on the Keck I 10m telescope. Three exposures of 1000 s were taken in the first night and two of 1200 s in the second night. The mean seeings in band were 0.6 and 0.8 respectively. The light of the counterpart was masked with a 0.7″ wide slit and split with a beam dichroic to the blue and red sides followed by a 300 lines mm-1 and a 400 lines mm-1 grating.
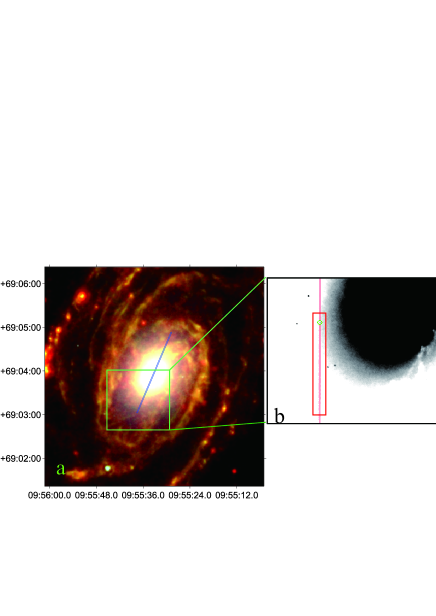
The spectra were reduced in a standard way with IRAF. First of all, raw FITS files were bias-subtracted, flat-corrected, and combined. On the blue side of the spectra, the position of the optical counterpart along the slit was verified by comparing its position in the target acquisition image (Figure 1b) with an HST ACS F606W image (Liu & Di Stefano, 2008). On the red side, since the counterpart was not obvious along the slit, an offset between the counterpart and the WD (PG) was used to verify the position of the counterpart.
Subsequently, raw spectra of the counterpart were extracted with an aperture size of 1″. The wavelength calibration was then carried out based on the line lists given in the manual of Keck111http://www2.keck.hawaii.edu/inst/lris/.. The precision of the calibration is 0.2 Å which is obtained from RMS (root mean square) of arc-lamp fitting.
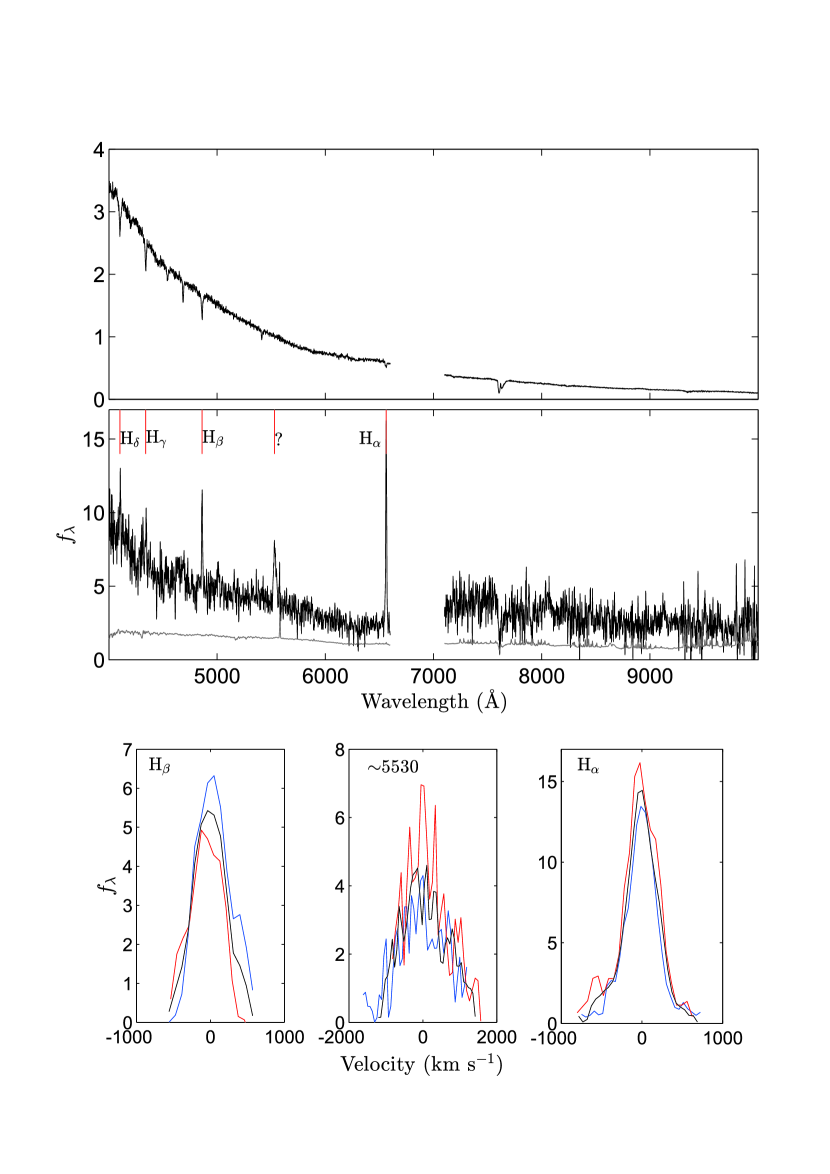
Finally, PG was used as the standard star to calibrate the flux by applying the standard flux given by Massey & Strobel (1990). Since the standard flux of PG covered the wavelength from 3126 Å to 8004 Å, we had to extend the tabulated values to 10000 Å for the calibration on the red side (the upper panel in Figure 2).
| Center (Å) | FWHM (Å) | |||||
|---|---|---|---|---|---|---|
| 4.13 | 4.17 | Combined | 4.13 | 4.17 | Combined | |
| Hβ | 4861.41.1 | 4861.20.3 | 4861.30.6 | 8.82.7 | 8.20.7 | 8.61.3 |
| 5530Å | 5532.31.5 | 5543.11.6 | 5536.61.6 | 32.53.5 | 32.94.0 | 32.23.8 |
| Hα | 6562.90.2 | 6562.80.2 | 6562.80.2 | 10.80.5 | 9.40.3 | 10.20.4 |
| Hα,ab∗ | 6558.80.5 | 6558.90.3 | ||||
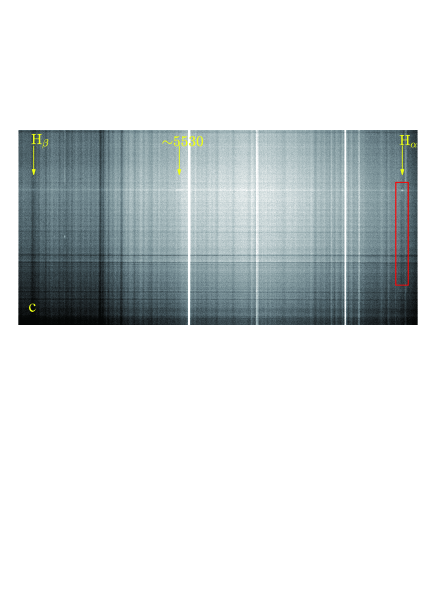
Note. — ∗Calculated for the Hα absorption as marked by the red rectangle in Fig1c.
| Tile | Band | Effective | Exptime | Min | Max | Inner | Outer | AB Mag. |
|---|---|---|---|---|---|---|---|---|
| Wavelength | ObsDate | ObsDate | Radius | Radius | ||||
| (1) | (2) | (3) | (4) | (5) | (6) | (7) | (8) | (9) |
| GI1_071001_M81 | FUV | 1538.6 | 14706.7 | 2006-01-05 | 2007-03-31 | 6.3 | 10.5 | 22.270.10 |
| NUV | 2315.7 | 29421.5 | 2005-01-12 | 2007-03-31 | 7.9 | 13.2 | 21.360.17 |
Note. — Col. (1): Tile name. Col. (2): Band name. Col. (3): Effective wavelength in angstrom. Col. (4): Total exposure time in seconds. Col. (5): Earliest observation UT date for visits which make up the coadd. Col. (6): Latest observation UT date. Col. (7): Inner radius in arcsecond for signal integration Morrissey et al. (2007). Col. (8): Outer radius in arcsecond for background substraction. Col. (9): Magnitudes in AB system without correction of Galactic extinction.
2.1. Balmer Emission Lines
As shown in Figure 2, the Balmer emission lines are notable features in the spectra. Here we used minimization to fit the centers and FWHMs (full width at half-maximum) of Hβ, Hα and another notable emission line around 5530Å. The results with 1 errors are listed in Table 1. The mean FWHM of Hβ and Hα emission lines derived from the fitting is 490 80 km s-1, which is significantly larger than the spectral resolution, 280 10 km s-1measured from Hg I 5461 in the arc lamp spectrum. The intrinsic dispersion is 400 80 km s-1for the Balmer emission lines. The radial velocity of ULS1 is consistent with zero (an average of 2 23 km s-1) within the precision of wavelength calibration, which implies that M81 ULS1 is unlikely a distant AGN with a large receding velocity.
The Balmer emission lines are mainly seen in spectra of H II regions, planetary nebulae and accretion disks around compact objects. The line dispersions for H II regions and planetary nebulae should be comparable to instrumental dispersions (Fang et al., 2013; Nicholls et al., 2014), while for accretion disks the line dispersions range from a few hundreds to thousands of kilo meters per second. The detected Balmer emission lines of M81 ULS1 are significantly broader than the instrumental dispersion, and are consistent with from an accretion disk around a compact object.
The observations in two nights enable us to measure the shift of Hα related to the binary motion. We used the technology of the cross-correlation phasor to estimate the relative velocity. The technology is based on the correlation in the wave-number space and it can provide more information than the normal cross-correlation, such as the significant level (see Misra et al. 2010 for detail). The shifts of Hα and sky emission lines are measured in the pixel space to avoid the uncertainty of the wavelength calibration. The relative shift of Hα to the sky line is 0.430.19 pixel, corresponding to 0.610.38 Å toward short wavelength. Then we used -square minimization to check the relative shift and the result is 0.420.36 pixel. No shift is found for Hα emission line at high significant level in the two nights observations with a span of 4 nights.
2.2. Balmer absorption lines
Hα absorption features are detected in a specific region along the slit as illustrated in Figure 1c. The regions with absorption features are located in the same area of the sky but different parts of the CCD in two nights observations, so these absorption features are unlikely artifacts of the CCD. The same features were also found near Hβ, but the signal is too low to derive reliable velocity.
In order to investigate the association between the Balmer absorption lines and the environment of M81 ULS1, false-color maps were constructed in optical (HST), UV (GALEX) and IR (Spitzer) wavelengths. Only the map of Spitzer exhibits obvious structures along the slit (Figure 1a). The region with the absorption features is correlated with the dark area in the map of 8 m, and the absorption features disappear when the 8 m emission is strong. Note that there is a positive correlation between 8 m surface brightness and Hα emission powered by star forming activity (Young et al., 2014). The observed absorption features appear in the non-star-forming regions, and likely come from the local stellar environments in the M81 bulge.
The absorption features in the background exhibit high velocities, 180 25 km s-1at 52″ from the nucleus. The stellar kinematics studies (Vega Beltrán et al., 2001) show that the bulge of M81 is rotating and the south-east side is approaching with velocities around 180 km s-1at 45″ from the nucleus. The similar velocity (180 km s-1) suggests that the observed Hα absorption lines come from stars in the bulge of M81. In comparison, the systemic velocity of M81 is 34 km s-1(obtained from NED).
The Hα emission line ( km s-1) exhibits a receding velocity of 178 35 km s-1relative to the Hα absorption line from the stellar environment. This suggests that ULS1 is not a system comoving with stars in the bulge of M81. Such a relative velocity can come from an object in the halo of M81 projected onto its bulge, which is receding along the line of sight. Here we rule out the possibility that the system is located in the Milky Way, since the column density of neutral hydrogen atoms at the location of ULS1 is 5.4 0.5 1020 cm-2 in the Milky Way (Güver & Özel, 2009), smaller than that derived from the X-ray spectrum fitting by a factor of 2 (Liu, 2008).
2.3. SED Construction
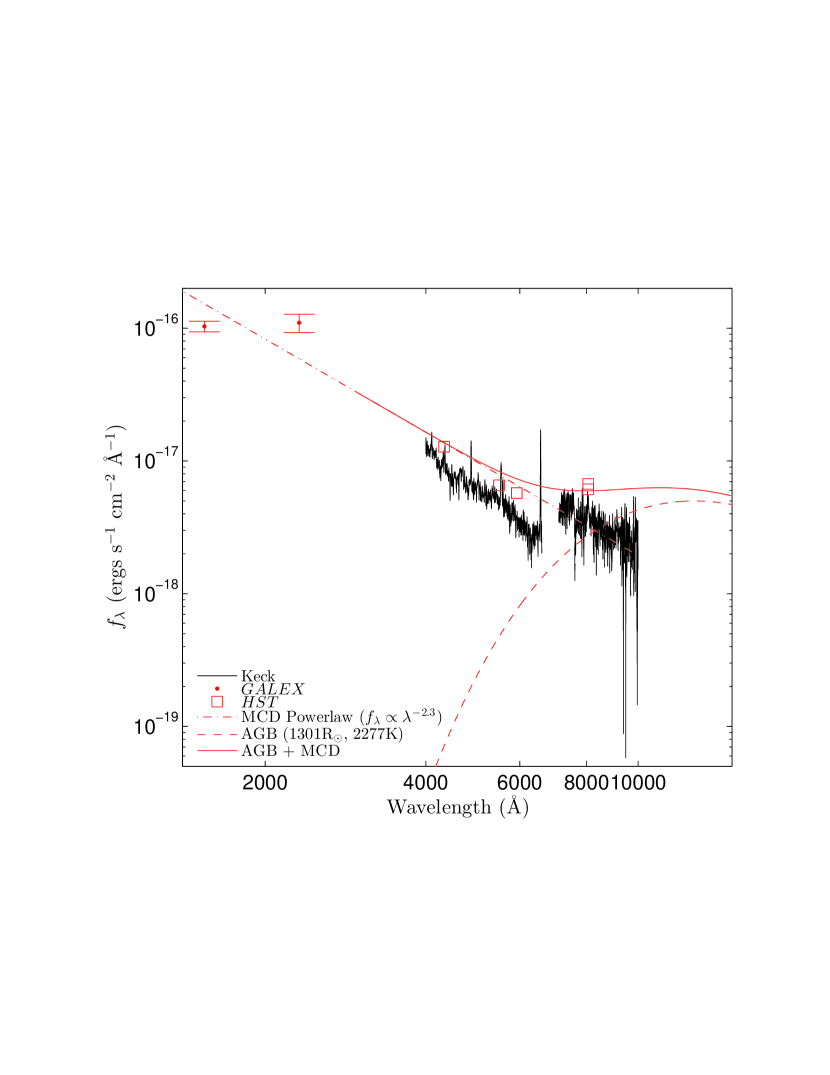
The spectral observations of M81 ULS1 enable us to obtain SED uncontaminated by its intrinsic variabilities. Here we removed all the emission lines and used a power-law function, , to fit the continuum of 45006000 Å, the high response wavelength range, in order to estimate the spectral index on the blue side. The derived from the best fitting is 2.36 0.02, which corresponds to 0.36 0.02 for . The continuum on the blue side is consistent with the relation expected for the multi-color disk (MCD) model. On the red side, the spectrum of an AGB star modeled with a temperature of 2277 K and a radius of 1301 R⊙, as suggested by Liu & Di Stefano (2008), is presented in Figure 3. The combined SED is not consistent with the red-side spectrum, which suggests that the AGB model may be not a good explanation of the red component.
As a connection of X-ray and optical wavebands, the UV emission is important to understand the SED of M81 ULS1. In order to probe the UV emission of M81 ULS1, we used the archive data of the Galaxy Evolution Explorer (GALEX; Martin et al. 2005). M81 have been observed with three different tiles, and here we used the tile with exposure time over 105 s to do accurate photometry. All the sub-exposures of the tile were taken during the expected low state of M81 ULS1 (Liu, 2008; Wang et al., 2015). The photometric results are listed in Table 2 and also shown in Figure 3. Although with dispersions, the UV fluxes are lying along the MCD powerlaw.
3. Discussion
In this letter we report the first optical spectroscopic confirmation of an accretion disk around a ULS. The broad Balmer emission lines of M81 ULS1 revealed by the Keck/LRIS observations are consistent with from an accretion disk around a compact object. The spectral index of the continuum on the blue side is also consistent with the relation expected by MCD model. The velocity of the Hα emission line relative to its local stellar environments suggests that M81 ULS1 is possibly a halo system in M81 belonging to an old population. Careful analysis shows no significant shift of Hα emission line with a span of 4 days. This might suggest a small inclination angle or a small velocity of the compact object. The latter can come from a long orbital period, or a very massive compact object such as an IMBH. However, the exact nature of the compact object is still unknown without monitoring of the long-term motion of the system.
Besides emission lines of Balmer series, an emission line arises around 5530 Å on the blue side with an FWHM of 1700 200 km s-1, larger than that of Hα by a factor of 4 (the lower panel in Figure 2). All exposures obtained in two nights show the same emission feature and similar velocity dispersions, so it is unlikely an artifact or cosmic rays. This emission line is too broad to be a nebular line, and it is probably not an Fe II emission line because Fe+ ion emits through a huge number of multiplets scattered across the blue side of the spectrum (Baldwin et al., 2004; Shapovalova et al., 2012). Since the relative shift is 10 Å 2 Å between two nights observations, the emission line is unlikely related to the accretion disk. It is reported that N II 5530 and 5535 emission lines have been detected for Ae/Be stars (Mathew & Bhavya, 2010; Mathew & Subramaniam, 2011). However, no other features are found to support the existence of an Ae/Be star, such as Fe II or O I emission lines. More spectra with high signal-to-noise ratio are needed to draw a conclusive result.
The spectrum of M81 ULS1 shows a gap between the red and blue sides due to the low response on the edges of CCDs, and signal-to-noise ratio on the red side is very low. Further deeper spectroscopic observations with the coverage of 50009000 Å could present the complete spectrum with high signal-to-noise ratio on the red side, which will enable us to characterize the secondary.
References
- Baldwin et al. (2004) Baldwin, J. A., Ferland, G. J., Korista, K. T., Hamann, F., & LaCluyzé, A. 2004, ApJ, 615, 610
- Cardelli et al. (1989) Cardelli, J. A., Clayton, G. C., Mathis, J. S., 1989, ApJ, 345, 245
- Fang et al. (2013) Fang, X., Zhang, Y., García-Benito, R., Liu, X.-W., & Yuan, H.-B. 2013, ApJ, 774, 138
- Güver & Özel (2009) Güver, T., & Özel, F. 2009, MNRAS, 400, 2050
- Liu & Di Stefano (2008) Liu, J. F. & Di Stefano, R., 2008, ApJ, 674, L73
- Liu (2008) Liu, J. F. 2008, ApJS, 177, 181
- Martin et al. (2005) Martin, D. C., Fanson, J., Schiminovich, D., et al. 2005, ApJ, 619, L1
- Massey & Strobel (1990) Massey, P. & Strobel, K., 1988, ApJ, 328, 315
- Mathew & Bhavya (2010) Mathew, B., Subramaniam, A., & Bhavya, B. 2010, Bulletin of the Astronomical Society of India, 38, 35
- Mathew & Subramaniam (2011) Mathew, B., & Subramaniam, A. 2011, Bulletin of the Astronomical Society of India, 39, 517
- Misra et al. (2010) Misra, R., Bora, A., & Dewangan, G. 2010, arXiv:1006.4069
- Moon et al. (2011) Moon, D.-S., Harrison, F. A., Cenko, S. B., & Shariff, J. A. 2011, ApJ, 731, L32
- Morrissey et al. (2007) Morrissey, P., Conrow, T., Barlow, T. A. et al. 2007, ApJS, 173, 682
- Nicholls et al. (2014) Nicholls, D. C., Dopita, M. A., Sutherland, R. S., et al. 2014, ApJ, 786, 155
- Schlegel et al. (1998) Schlegel, D. J., Finkbeiner, D. P., Davis, M. 1998, ApJ, 500, 525
- Shapovalova et al. (2012) Shapovalova, A. I., Popović, L. Č., Burenkov, A. N., et al. 2012, ApJS, 202, 10
- Swartz et al. (2002) Swartz, D. A., Ghosh, K. K., Suleimanov, V., Tennant, A. F., & Wu, K. 2002, ApJ, 574, 382
- Tao et al. (2011) Tao, L., Feng, H., Grisé, F., & Kaaret, P. 2011, ApJ, 737, 81
- Vega Beltrán et al. (2001) Vega Beltrán, J. C., Pizzella, A., Corsini, E. M., et al. 2001, A&A, 374, 394
- Wang et al. (2015) Wang, S. et al. 2015, in preparation
- Young et al. (2014) Young, J. E., Gronwall, C., Salzer, J. J., & Rosenberg, J. L. 2014, MNRAS, 443, 2711