CoRoT space photometry of seven Cepheids††thanks: Partially based on observations collected at La Silla Observatory, ESO (Chile) with the HARPS spectrograph at the 3.6-m telescope under programme LP185.D-0056
Abstract
A few Galactic classical Cepheids were observed in the programmes of space missions as Coriolis, MOST and Kepler. An appealing opportunity was to detect additional nonradial modes, thus opening the possibility to perform asteroseismic studies and making the pulsational content of Galactic Cepheids more similar to that of Magellanic Clouds ones. However, only hints of cycle-to-cycle variations were found, without any strict periodicity. In this context the potential of the CoRoT exoplanetary data base was not fully exploited despite the wide area covered on the Galactic plane. Therefore, we investigated all the candidate Cepheids pointed out by the automatic classification of the CoRoT curves. At the end we could identify seven bona-fide Cepheids. The light curves were investigated to remove some instrumental effects. The frequency analysis was particularly delicate since these small effects can be enhanced by the large amplitude, resulting in the presence of significant, but spurious, peaks in the power spectrum. Indeed, the careful evaluation of a very attracting peak in the spectra of CoRoT 0102618121 allowed us to certify its spurious origin. Once that the instrumental effects were properly removed, no additional mode was detected. On the other hand, cycle-to-cycle variations of the Fourier parameters were observed, but very small and always within . Among the seven Cepheids, there are two Pop. I first-overtone pulsators, four Pop. I fundamental mode pulsators, and one Pop. II star. The CoRoT colours allowed us to measure that times of maximum brightness occur a little earlier (about 0.01 period) at short wavelengths than at long ones.
keywords:
methods: data analysis – stars: individual: V376 Mon – stars: individual: DP Mon – stars: interiors – stars: oscillations – stars: variables: Cepheids1 Introduction
The use of Cepheids as stellar candles requires a deep knowledge of their pulsational characteristics. The separation between fundamental (-mode) and first-overtone (-mode) radial pulsators (Antonello, Poretti & Reduzzi 1990) is still the most relevant distinction to be taken into account to calibrate the period-luminosity relations. About the regularity of their variations, ground-based photometry of V473 Lyr (Burki, Mayor & Benz 1982) and Polaris (Evans, Sasselov & Short 2002) showed continuous changes in amplitude and phase. Molnár & Szabados (2014) established that V473 Lyr pulsates in the second radial overtone and shows strong amplitude and phase modulations on two long periods (12053 and 5300150 d). The slow changes in the light curve of Polaris on a time baseline of 4.5 yr were precisely recorded by space photometry using the Coriolis spacecraft. Spreckley & Stevens (2008) connected them to a quite fast evolutionary phase. However, Bruntt et al. (2008) proposed a different interpretation pointing out how the amplitude change is cyclic rather than monotonic and also suggesting an excess of power in the 2-6 d range due to the granulation.
The situation was expected to change with the advent of high-precision space mission. A detailed analysis of the MOST observations of SZ Tau and RT Aur revealed variations from cycle to cycle as a function of the pulsation phase (Evans et al. 2015). The stars were both monitored for less than seven consecutive cycles: the -Cepheid SZ Tau showed a pulsation less stable than the -Cepheid RT Aur. The historical analysis of the times of maximum brightness proved that both stars experienced period variations on a time-scale of decades and that those of the overtone mode resulted to be more erratic than the ones.
In the case of Kepler, there was only one Cepheid in the field-of-view, i.e., V1154 Cyg. Derekas et al. (2012) provided a very detailed analysis of the data acquired in the first 600 d (i.e., about 120 cycles) of the mission, detecting significant cycle-to-cycle fluctuations. A very slight correlation was also found between the Fourier parameters and the O-C values, i.e., the difference between the observed and calculated times of maximum brightness (Tmax). This suggested that the O-C variations (up to 30 min) might be due to instabilities in the light curve shape. On the basis of these observational results, Neilson & Ignace (2014) suggested that convection and hot spots can explain the observed period jitter, thus supporting the Bruntt et al. (2008) interpretation of the Polaris changes. The clues about the changes in the light curve of V1154 Cyg were strengthened by the analysis of new Kepler measurements (up to Q17 quarter): the analysis of the Fourier parameters supplied a robust determination of a periodicity of 158.6 d (Kanev, Savanov & Sackhov 2015).
About ground-based observations, Anderson (2014) discovered significant modulations in the radial velocity curves of some Cepheids. These modulations appear to be different from those reported on V1154 Cyg, since they manifest as shape and amplitude variations on time-scales of years for short-period Cepheids (like V1154 Cyg) and cycle-to-cycle variations in the long-period Cepheids.
A common result among all these investigations is that no nonradial mode was identified in the light or radial velocity curves of Galactic Cepheids. Hence the counterparts of the subclasses detected in the Large Magellanic Cloud (LMC; for a review see Moskalik 2014) are still missing. However, an important player has not yet contributed, i.e., the CoRoT data base of the light curves collected in the exoplanetary fields. Such data base already proved to be a real treasure allowing the discovery of a unique triple-mode Cepheid in the outskirts of the Milky Way (Poretti, Baglin, & Weiss 2014). In this paper we describe the new elements brought by the CoRoT photometry to the hot topic of the stability of the Cepheid light curves.
2 CoRoT data and spectroscopic follow-up
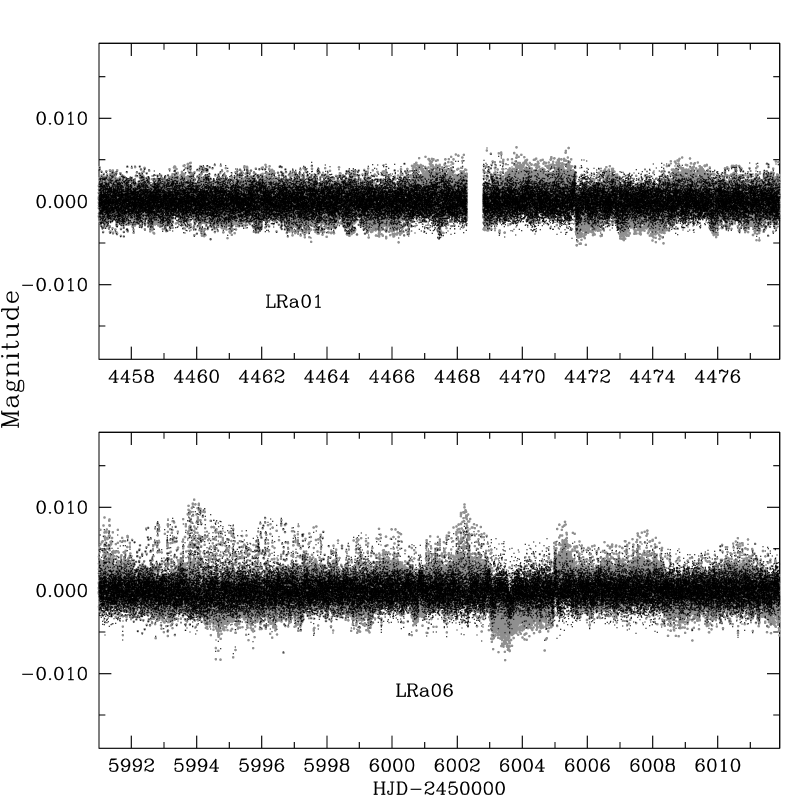
The first new Cepheid discovered by CoRoT was 2MASS J06415168-0120059CoRoT 0102618121, a 12th-mag star located at = , = –01° 20′ 05960 (J2000). It was observed during the first Long Run in the Anticentre direction (LRa01) and then in the LRa06 four years later (Table LABEL:runs). The classification of the type of variability was a little troublesome. The star was assigned to the RR Lyr Working Group, but the preliminary analysis immediately pointed out that the star was not a RR Lyr variable since the period was too long. The Cepheid variability was much more probable, but some doubts still remained, based on the classification as M1V type reported in the header of the FITS file of the LRa01 data. Indeed, the “CoRoT Variability Classifier" automated supervised method (CVC; Debosscher et al. 2009) suggested an active, rotational variable as first hypothesis and a classical Cepheid as a second one. The spectral classification of CoRoT 0102618121 was revised as A5V in the current version of the Exo-Dat (Deleuil et al. 2009) catalogue and consequently reported in the header of the more recent LRa06 data.
While the analysis of CoRoT 0102618121 was in progress, we proposed known Cepheids as CoRoT targets by answering the Announcements of Opportunity regularly issued before any run. In such a way V376 MonCoRoT 0300003751 and DP MonCoRoT 0221644967 were monitored in the LRa02 and SRa02 runs, respectively (Table LABEL:runs). However, it should be expected that other Cepheids would be discovered thanks to the deep survey performed by CoRoT on the Galactic plane.
To search for these new Cepheids, we first scrutinized all the new variables discovered with the Berlin Exoplanet Search Telescope (BEST) that have been classified as candidate Cepheids (Karoff et al. 2007; Kabath et al. 2007, 2008, 2009a, 2009b; Fruth et al. 2012) and actually observed with CoRoT. We noticed that the variability of V376 Mon was recorded (Kabath et al. 2009b) with the correct period, i.e., 1.652 d (Berdnikov et al. 2014), not the 0.623 d reported in the discovery paper (Wachmann 1964). Unfortunately none of other BEST candidates were confirmed as a new Cepheid, since they turned out to be rotational variables. The misclassification is probably due to the too relaxed criterion used to classify a new variable as Cepheid, i.e., a periodic variability with an amplitude larger than 0.10 mag. Indeed, such an amplitude threshold can be reached by active spotted stars.
As a second step in the data mining of the CoRoT data base, we selected all the variables for which the CVC method proposed a classification as Cepheid, independently from rank and probability. The full light curves of about 250 candidates thus selected were inspected by eye. Eclipsing variables, RR Lyr and high-amplitude Sct stars were found and not considered furthermore. We remained with a sample where the dichotomy was again between Cepheid and rotational variables. The stars characterized by very large cycle-to-cycle variations were immediately considered as rotational variables. The stars showing more stable light curves were analysed in frequency and least-squares solutions of the mean light curves were obtained. We note that in this process the small amplitude was not considered as a rule of thumb since it could be reduced by an unresolved, blended star. On the other hand, a large amplitude (say, greater than 0.20 mag) was recognized as the signature of a pulsational mechanism. Most of the stars were considered as rotational variables after that an ensemble of several parameters (period, amplitude, stability of the light-curve shape, Fourier parameters, …) was taken into account. However, we cannot rule out that a few of them are actually Cepheids, whose regular curve is perturbed by that of a blended irregular variable. We could identify some borderline cases (e.g. CoRoT 0102635101, 0102640143, 0605539616, 0223971984, 0102578739, 0110827792, and, overall, 0223971984) where the distinction between activity and pulsation was very difficult. New spectroscopic observations are necessary to establish the nature of these problematic stars in an unambiguous way.
During the screening procedure we discovered the unique Galactic triple-mode Cepheid CoRoT 0223989566 (Poretti et al. 2014) and at the end we could count seven bona-fide Cepheids. In addition to CoRoT 0102618121, V376 Mon, and DP Mon we identified four new Cepheids: CoRoT 0221640090, 0315221415, 0211626074, and 0659466327 (Table LABEL:runs). The CoRoT photometry of V376 Mon and of other Cepheids was analysed when the interpretation of the CoRoT 0102618121 data was almost finished. Therefore, we describe the procedure as applied to CoRoT 0102618121 first and then how it has been extended to other Cepheids later.
| CoRoT ID | Other designation | Run | Start date | End date | T | Mode | Cadence | N |
|---|---|---|---|---|---|---|---|---|
| 0102618121 | LRa01 | Oct. 23, 2007 | Mar. 3, 2008 | 131.46 d | CHR | 32 s | 326634 | |
| 0102618121 | LRa06 | Jan. 12, 2012 | Mar. 29, 2012 | 76.61 d | CHR | 32 s | 196032 | |
| 0300003751 | V376 Mon | LRa02 | Nov. 16, 2008 | Mar. 8, 2009 | 111.64 d | CHR | 512 s | 16400 |
| 0221644967 | DP Mon | SRa02 | Oct. 11, 2008 | Nov. 12, 2008 | 31.75 d | CHR | 32 s | 72144 |
| 0659466327 | LRc09 | Apr. 12, 2012 | July 5, 2012 | 83.51 d | MON | 512 s | 11894 | |
| 0315221415 | SRa03 | Mar. 5, 2010 | Mar. 29, 2010 | 24.73 d | MON | 512 s | 3670 | |
| 0211626074 | SRc01 | Apr. 13, 2007 | May 9, 2007 | 25.54 d | MON | 512 s | 3996 | |
| 0221640090 | NSVS 12485452 | SRa02 | Oct. 11, 2008 | Nov. 12, 2008 | 31.75 d | CHR | 32 s | 73326 |

3 The analysis of CoRoT 0102618121 data
3.1 Spectroscopic follow-up
To solve the ambiguous spectral classification of CoRoT 0102618121 and to validate our classification criteria, we obtained three high-resolution spectra on 2012 January 10 and 11 with the HARPS spectrograph installed at the 3.6-m telescope of the ESO-La Silla Observatory. The spectra were taken in the high-efficiency EGGS configuration (R=80,000) and they have signal-to-noise ratios (S/N) between 50 and 55. We reduced and normalized the spectra with a semi-automated pipeline developed at the Brera Observatory (Rainer 2003). We then computed the mean line profiles for each spectrum using the LSD software (Donati et al. 1997) and we used them to estimate the radial (from 47.9 to 53.6 km s-1) and projected rotational (from 9.64 to 11.85 km s-1) velocities by fitting the profiles with gaussians. The reduced and normalized spectra were shifted by their radial velocities and averaged in order to lessen the effect of the pulsation. The spectral synthesis software SME version 4.2.3 (Valenti & Piskunov 1996) was used to estimate the physical parameters. The spectral regions 5160-5190 Å (including the gravity sensitive Mg-triplet) and 4830-4900 Å (the H region, sensitive to the temperature) were selected. We left temperature (), gravity (, cgs units), metallicity ([Fe/H]), micro- and macroturbulence as free parameters, while km s-1 was imposed. Following Valenti & Fischer (2005), we also left the abundances of Na, Si, Ti, Fe, and Ni as free parameters. We performed an iterative process on the MARCS stellar models (Gustafsson et al. 2008): we started running the SME software on the Mg region, then we switched to the H region keeping the previously found as a fixed parameter. After that we went back to the Mg region keeping fixed the value found in the H region, and so on until the results converged. The resulting parameters are = 608744 K, =1.530.15 dex, [Fe/H]= dex. They confirm that CoRoT 0102618121 is a Pop. I supergiant and not a main-sequence star: its classification as a Cepheid variable was definitely established.
3.2 CoRoT data
The original timeseries of CoRoT 0102618121 consist of 348 702 and 206 528 data points, respectively. In both cases the exposure time was set to 32 s (corresponding to the CoRoT short cadence) and the flux was recorded in three different spectral regions, i.e., in the CoRoT chromatic mode. The contamination factors (in a scale ranging from 0 to 1) are 0.026 and 0.036 in the two CoRoT runs, suggesting no relevant contribution from back- or fore-ground stars.
The analysis of the original N2 data clearly detected a predominant peak at =0.3574 d-1 followed by several harmonics. Figure 1 shows LRa01 (top panel of the upper part) and LRa06 (top panel of the lower part) CoRoT N2 data on a 15-d time baseline. All data points are plotted, including those acquired during the crossing of the South Atlantic Anomaly (SAA): they appear as bright outliers on a vertical line. We avoided any cleaning procedure since the detection of instrumental trends and jumps and their subsequent correction is a crucial step to proceed in the analysis of the CoRoT data. Therefore, we computed a preliminary solution based on the set of frequencies , 2, 3, 4, and 5. The plots of the residuals (middle panels of the two parts of Fig. 1) show sudden jumps around JD 2454468 in LRa01 and JD 2456003 in LRa06, the SAA outliers, and continuous oscillations. Outliers were iteratively removed at this stage. We still remained with the necessity to correct the sudden jumps and long-term drifts and to verify the origin of the residual oscillations. To do this, we applied the least-squares fits to each pulsation cycle, still using the set of frequencies from to 5. The 32-s cadence of the CoRoT data warranted more than 7000 measurements for each cycle, making the solution very robust. This procedure returned the mean fluxes of the 47 cycles observed in the LRa01 and the 27 ones in LRa06 (Fig. 1, bottom panels of the two parts). These mean values show the variations due to the jumps and the long-term trend. We notice that the long-term trends behave in different ways in the two runs. The effect of the jump around JD 2454468 was noticeable in the data until JD 2454485, thus affecting the mean magnitudes of the subsequent six cycles. To remove the instrumental variations, we interpolated the values of the mean fluxes (bottom panels of Fig.1) at the times of each individual measurement and then we subtracted it. At this point two cleaned timeseries (326,634 and 196,032 points, respectively) were ready to be analysed in frequency. By applying this procedure we probably modified any possible additional signal around 2.8 d and this fact has to be carefully considered when discussing the frequency content of the light curves of the two runs.
We transformed the fluxes into magnitudes by calculating the average flux of each run. We also measured the level of the noise of the CoRoT timeseries after subtracting the set of the frequency and harmonics. In the case of the LRa01 data we obtained 0.065 mmag in the 0.01-1.0 d-1 range, rapidly decreasing to 0.018 mmag in the 1.0-2.0 d-1 region, and more slowly to 0.012 mmag in the 2.1-3.0 d-1 region and to 0.007 mmag around 5.0 d-1. In the case of the LRa06 data the four values are 0.104, 0.030, 0.020, and 0.010 mmag, respectively. The number of measurements (326,634 versus 196,032) accounts for most of the difference between the noise levels of the LRa01 and LRa06 spectra.
4 A critical analysis of the frequency content of CoRoT 0102618121

The frequency analysis was performed by means of the iterative sine-wave, least-squares fitting method (Vaniĉek 1971) and then refined with the MTRAP algorithm (Carpino, Milani & Nobili 1987), allowing us to include all the significant harmonics in the search for the best fit around . The best way to illustrate our final results is to follow the chronological order of their progressive consolidation.
The analysis of the LRa01 data in white light was concluded in 2011 and the results were apparently very promising. We found the harmonics up to 6 (amplitude 0.13 mmag), flanked by some modulation terms at 0.007 d-1 (i.e., 142 d). Since the separation is very close to the length of the observations, the origin of these terms has to be ascribed to a residual, still imperfect correction of the instrumental drifts. Moreover, a few peaks not very close to and 2 were detected: 0.488 d-1 (amplitude 0.40 mmag), 0.392 d-1 (0.14 mmag), and 0.288 d-1 (0.15 mmag). Only the peak at 0.488 d-1 had a S/N above the threshold considered as the significativity one in the Fourier analysis (S/N=4.0; Kuschnig et al. 1997), i.e., S/N=0.396/0.065=6.1. The power spectra illustrating the bunch of low amplitude peaks still centred around , the 0.488-d-1 peak, and the 6 harmonic are shown in the top panel of Fig. 2. However, the identification of the 0.488 d-1 peak as an additional mode was not really convincing because no combination term was observed.
Why this non-detection is so important? The combination or coupling terms are generally ascribed to the non-linear responses of the stellar atmospheres to the strong radial pulsations. The frequency analysis of the light curves of double-mode Cepheids show several of them, also involving harmonics of the and radial modes (Pardo & Poretti 1997). The Fourier decomposition of the light curves also shows regularities in the distribution of the phase parameters that are not yet fully understood (Poretti & Pardo 1997). The combination terms have been detected in the light curves of other multimode pulsators, e.g. HADS stars (Poretti et al. 2005), RR Lyr stars (Gruberbauer et al. 2007), and white dwarfs (Wu 2001). The CoRoT photometry also allowed us to detect low-amplitude, nonradial modes in an HADS star pulsating in a single radial mode and also in this case a lot of combination terms were detected (Poretti et al. 2011). Therefore, we should expect combination terms when additional modes, both radial and nonradial, are excited in a high-amplitude radial pulsator.
The uncertainties on the real significativity of the peaks detected in the LRa01 data slowed down our theoretical analysis and made us unsure of how to proceed further. The re-observation of the same field in the LRa06 pointing supplied us with new data to verify the frequency content of CoRoT 0102618121. We applied the same procedure used for the LRa01 data to remove the content of the main variation. The frequency analysis of the residuals of the LRa06 data confirmed the presence of the 0.488 d-1 peak (Fig. 2, bottom panel of the upper part). Therefore, the confidence on the stellar origin of the 0.488 d-1 grew. However, the ratio 0.357/0.488=0.732 would be quite unusual for a double-mode Cepheid with a normal metallic content, both from observational data (Pardo & Poretti 1997; Sziládi et al. 2007) and theoretical models (Buchler & Szabo 2007; Buchler 2008). Therefore, such a ratio pointed out a possible nonradial mode. The identification of the peak as the rotational frequency is much more unlikely, since the corresponding rotational period (2.06 d) appears too short for a supergiant star.
The excitation of nonradial modes in a classical Cepheid would be a very important ingredient in the modelling of the atmospheres of these supergiant stars, thus we submitted this result to further checks. At this stage, we detected the 0.488 d-1 peak in the residuals of each Long Run. These sets of residuals were obtained by applying a global fit to the LRa01 data (grey points in the upper panel of Fig. 3) and to the LRa06 ones (grey points in the lower panel of Fig. 3). Indeed, variations in the shape of the residuals are clearly visible, especially after the jumps at JD 2454468 and JD 2456003. They remind the oscillations noticed before removing the long-term trends and the jumps (Fig. 1, middle panels). This suggested that the computation of the mean fluxes was very effective in cleaning the power spectra, but the interplay betweeen the large amplitude of CoRoT 0102618121 and the jump correction could somehow leave spurious variability close to the significance level. For this reason we gave a closer look to the light curves of the residuals from which the 0.488 d-1 peak was detected. These light curves show the same type of oscillations, suggesting that the global solution was not able to match the instrumental alterations of the stellar signal. Thus we decided to calculate residuals following the same approach used to determine the mean fluxes. This implied to compute as many sets of parameters as the elapsed cycles were, i.e., 47 for LRa01 and 27 for LRa06.
The analysis of these new sets of residuals were enlightening. The oscillations visible in Fig. 1 (middle panels) had completely disappeared and the light curves became really flat, with just some clues of high-frequency noise (Fig. 3, black points). Indeed, the power spectra of the residuals from fitting one cycle at a time show the peak at the 6 harmonic only. This was observed both in the LRa01 data and in the LRa06 data (lower part of Fig. 2). Both spectra are characterized by an almost white noise. It could be argued that the signal at 0.488 d-1 was removed when fitting the single cycles (also taking into account the almost exact 3/4 ratio between the frequencies). However, the fact that the 6 peak has remained clearly visible gave evidence that the fit with , 2, 3, 4, and 5 of each cycle did not modified any signal component apart from these frequencies. We tried to come back to a new correction of the mean fluxes, but again the analysis of the global residuals thus obtained was unsatisfactory. We note that the technique of analysing single cycles were successfully applied to remove similar instrumental effects in the light curves of the high-amplitude Sct star CoRoT 101155310 (Poretti et al. 2011) and of the triple-mode Cepheid CoRoT 0223989566 (Poretti et al. 2014).
| Term | LRa01 | LRa06 | |||||||
|---|---|---|---|---|---|---|---|---|---|
| white | white | ||||||||
| [rad] | 4.1101(7) | 4.220(2) | 4.070(2) | 3.934(2) | 4.1081(9) | 4.191(2) | 4.012(6) | 3.925(6) | |
| [rad] | 4.645(6) | 4.637(13) | 4.499(21) | 4.683(20) | 4.689(7) | 4.674(15) | 4.814(84) | 4.920(64) | |
| 0.05395(4) | 0.05371(9) | 0.05260(12) | 0.05166(11) | 0.05646(5) | 0.05717(14) | 0.05265(34) | 0.04961(30) | ||
| [rad] | 3.624(7) | 3.857(18) | 3.431(21) | 3.240(17) | 3.573(7) | 3.712(26) | 3.290(34) | 3.193(32) | |
| Full ampl. [mag] | 0.222 | 0.191 | 0.250 | 0.306 | 0.233 | 0.208 | 0.288 | 0.364 | |
| Res. rms [mag] | 0.0017 | 0.0036 | 0.0061 | 0.0063 | 0.0018 | 0.0045 | 0.0150 | 0.0165 | |
5 The properties of the CoRoT 0102618121 light curves
Once that we could rule out the excitation of other modes, we fitted the CoRoT magnitudes by means of a cosine series (see appendix A). Table LABEL:sol lists the coefficients of the solutions of the light curves of both runs. The shape of the light curve could be defined by the Fourier parameters (see appendix A) and Table LABEL:colori lists those relevant to our discussion.
5.1 The stability of the light curves
The absence of any relevant peak once that the contribution of the main oscillation has been removed is not by itself an evidence that the light curve is stable. Cycle-to-cycle variations as those observed in the Kepler light curve of V1154 Cyg or in the radial velocity curves could not result in a well defined peak in the power spectrum. Moreover, at least in principle, the residual peaks left around when applying a global fit could be ascribed to cycle-to-cycle variations, maybe erratic ones.
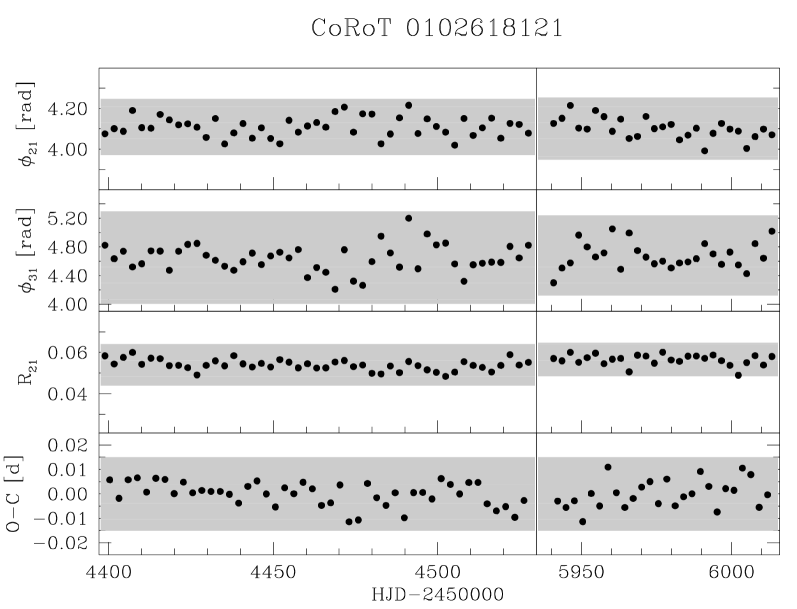
We analysed the , , and parameters of each cycle to quantify how much the light curve deviates from the average behaviour. The CoRoT 32-s cadence allowed us to get about 7500 measurements per cycle, adequate to survey the harmonics 2 and 3 in a very accurate way, though their amplitudes are very small (6.0 and 0.7 mmag, respectively). The Fourier parameters are shown in Fig. 4. The error bars are three times the standard deviations () around the average of the parameters of the individual cycles. The immediate result is that the differences from the average values are small. We could notice that all the individual values are between 3, though some apparently regular variations are sometimes visible (e.g. the behaviour in the LRa01). Therefore, we performed a frequency analysis of the Fourier parameters. We could not detect any periodicity since the power spectra of the , , and parameters do not show any common feature either in a single Long Run or when comparing LRa01 and LRa06 results.
However, the best parameter to quantify the stability of the light curve
is probably the O-C parameter.
We determined the observed Tmax’s
by means of cubic spline functions with a non-zero smoothing parameter that
depends on the number of measurements to fit and on their scatter
(Reinsch 1967). We thus obtained the linear ephemeris from the least-squares
method
(E)
and hence we could calculate the O-C value for each Tmax.
The residual rms of the least-squares linear fit is 0.0052 d and the 3 band is shown
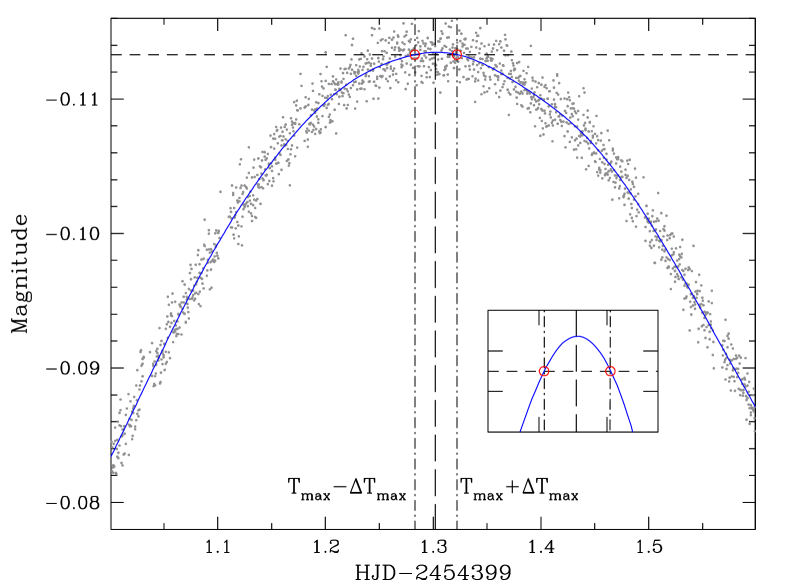
in Fig. 4. We also estimated the uncertainty on the individual Tmax
determination as the difference between the two times corresponding to
the intersection of the spline function with the line
(Fig. 5),
where is the magnitude at maximum and is the standard deviation
of the fit. Such uncertainties are ranging from 0.010 to 0.016 d and hence the
3 interval (i.e., 22.5 min) matches the individual error bars, too.
We analysed in frequency the O-C values too, again obtaining no clear indication of periodicities.
As a final conclusion, looking at the different plots shown in Fig. 4 and at the results of the various frequency analyses, we cannot identify any additional periodicity in the variability of CoRoT 0102618121. The Fourier parameters and the O-C values sometimes mimic an apparent regular behaviour. This could be a hint of cycle-to-cycle variations, much less regular than those observed in the Kepler light curve of V1154 Cyg (Kanev et al. 2015).
5.2 The comparison between LRa01 and LRa06 light curves
We merged the LRa01 and LRa06 measurements and we calculated a refined value of the period on the whole time baseline. The MTRAP code supplied the final vale =2.79805960.0000001 d, in excellent agreement with the value obtained from the Tmax’s values only. The most relevant difference in the datasets of the two Long Runs is a slight increase from 0.222 to 0.233 mag in the full-amplitude of the light curves. Since we are dealing with absolute photometry, i.e., without any comparison star, we have to be sure that the measurements were performed in the same instrumental system to infer that the amplitude difference has a stellar origin. We immediately noticed that the star was observed in the same CCD in the two runs, but with a different mask and at different pixel coordinates. As a results, the average white flux measured was of 1 030 069 electrons in LRa01 and 944,911 electrons in LRa06. Moreover, the flux subdvision in , , colours was also different: 65, 14, 21 per cent in LRa01, 78, 10, 12 per cent in LRa06. We conclude that the small difference in amplitude could very probably be ascribed to the different settings of the CoRoT pointings in the two runs. The same effect occurs in Kepler photometry: average fluxes and amplitudes change for the same star observed in the same CCD but with different masks. These effects are particularly disturbing when dealing with large amplitude variables (Benkő et al. 2014).
The procedure applied to white light measurements was repeated for each colour of both runs. Other similar, subtle instrumental effects became evident during this process (Poretti, Le Borgne, & Klotz 2015). Then, the Fourier decomposition was applied to the cleaned timeseries in each colour (Table LABEL:colori). The parameters clearly show the expected dependence from the bandpass (see Morgan, Simet & Bargenquast 1998, for a comparison between and parameters). The different flux distributions between LRa01 and LRa06 also account for the small differences between parameters in the same colour.
6 Data analysis of the other Cepheids observed with CoRoT


The procedure described in the previous sections for CoRoT 0102618121 was applied to the other Cepheids, whose folded light curves are shown in Fig. 6 (six Pop. I stars) and Fig. 7 (one Pop. II star). The Fourier parameters are listed in Table 3.
6.1 Stars observed in the Long Runs
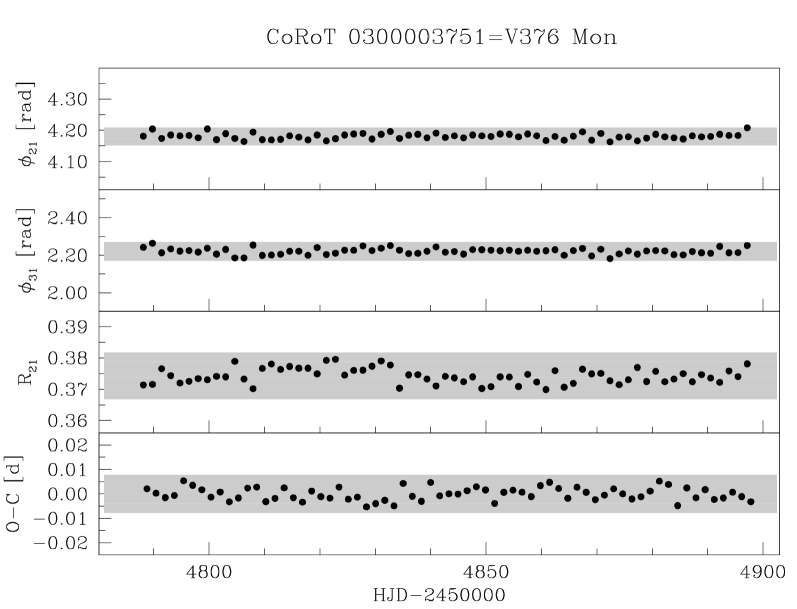
The frequency analysis of the V376 Mon data supplied =0.6060 d-1, refined to d with MTRAP. Table LABEL:sol lists the least-squares solution of the CoRoT white light curve. The frequency analysis did not detect any significant additional mode, but again the residual power spectra strongly depend on the procedure used to prewhiten the data. We obtained a bunch of peaks around when applying a global fit up to 7 to the entire dataset. These peaks disappeared when the fit was calculated cycle-by-cycle (Fig. 8, upper part). The harmonic 8 was detected in both cases, confirming that the single cycle fit did not alter the frequency content. The Fourier parameters and the O-C values show a small scatter around the means (Fig. 9), suggesting no periodic variation.
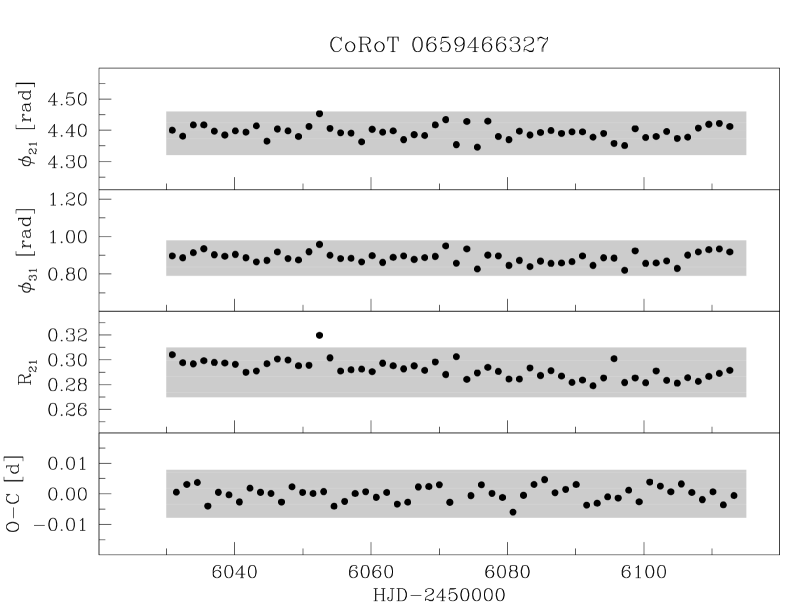
The frequency analysis of CoRoT 0659466327 data returned =0.648 d-1 and the period was refined to d. Table LABEL:solii lists the least-squares solution of the white light curve. The bump on the ascending branch (Fig. 7) is typical of Pop. II Cepheids. Differently than in the previous cases, the peak in the power spectrum of the residuals from the global fit up to 9 occurred around 2, but the bunch of peaks at were detected, too. The power spectrum of the residuals from the cycle-by-cycle fits is completely flat and it just shows the 10 harmonic, not prewhitened from the data (Fig. 8, lower part). Small-size scale variations are observed in the Fourier parameters and O-C values, but again without any trace of periodicity (Fig. 10).
The power spectra of the residuals of CoRoT 0102618121, V376 Mon and CoRoT 0659466327 calculated by means of a global least-squares solution show the limits of this approach when applied to continuous and high-precision timeseries where systematic errors (jumps and/or drifts) can occur. When possible, e.g. in presence of a high-amplitude predominant mode, the frequency analysis of cycle-to-cycle residuals are preferable, taking care to keep a known frequency, e.g. an harmonic, as internal check of the signal preservation.
6.2 Stars observed in the Short Runs
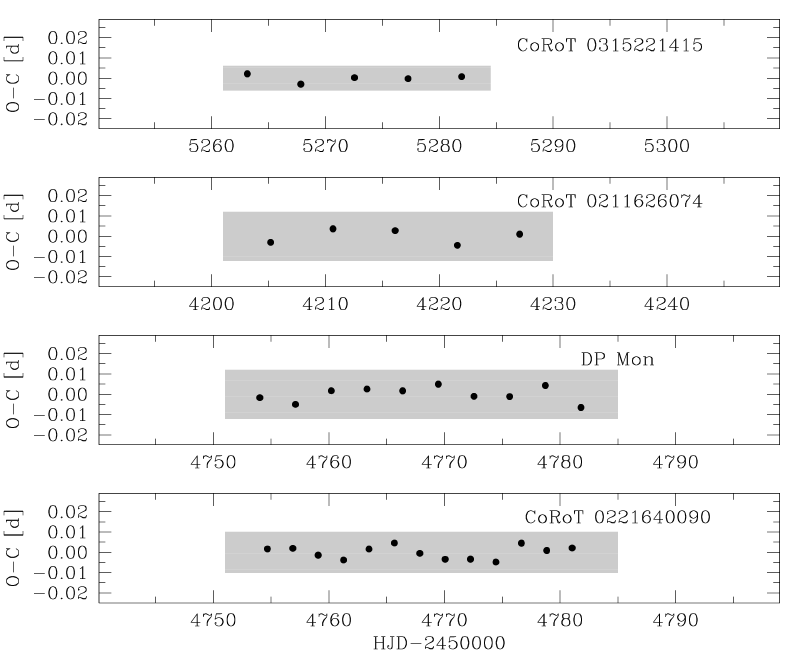
The solutions of the light curves of the Cepheids CoRoT 0221640090 (Table LABEL:soliii), CoRoT 0211626074 (Table LABEL:soliv, CoRoT 0315221415 (Table LABEL:solv), and DP Mon (Table LABEL:solvi were much less laborious since these stars were observed once in some Short Runs (SRs) and hence followed for a restricted number of cycles. The O-C plots do not provide useful hints about periodic variations (Fig. 11). Only in the case of CoRoT 0221640090 (bottom panel) the string of consecutive Tmax shows a hint of regular behaviour, but the monitoring is too short to assess its repetitivity on a long time-scale. Moreover, the standard deviation around the linear ephemeris is 0.0033 d and all the maxima are well within 3.
| Star | Mode | Tmax[HJD- | Period | Ampl. | ||||
|---|---|---|---|---|---|---|---|---|
| 2450000] | [d] | [mag] | [rad] | [rad] | [rad] | |||
| V376 Mon | 4785.4731 | 1.651969(1) | 0.372 | 4.1811(3) | 0.3745(1) | 2.2206 (1) | 0.172(1) | |
| CoRoT 0221640090 | 4754.6755 | 2.19758(4) | 0.288 | 4.560(1) | 0.1397(1) | 3.641(5) | 2.670(9) | |
| DP Mon | 4754.0407 | 3.08704(4) | 0.678 | 4.312(1) | 0.5201(1) | 2.4703(4) | 0.5439(6) | |
| CoRoT 0315221415 | 5258.4566 | 4.7085(17) | 0.557 | 4.363(1) | 0.4650(5) | 2.478(3) | 0.434(5) | |
| CoRoT 0211626074 | 4199.7103 | 5.4706(2) | 0.296 | 4.731(1) | 0.3147(3) | 3.242(3) | 1.391(35) | |
| CoRoT 0659466327 | Pop. II | 6031.4482 | 1.542353(2) | 0.492 | 4.394(1) | 0.2913(2) | 0.886(1) | 4.953(2) |
7 The Fourier parameters as pulsation mode discriminant
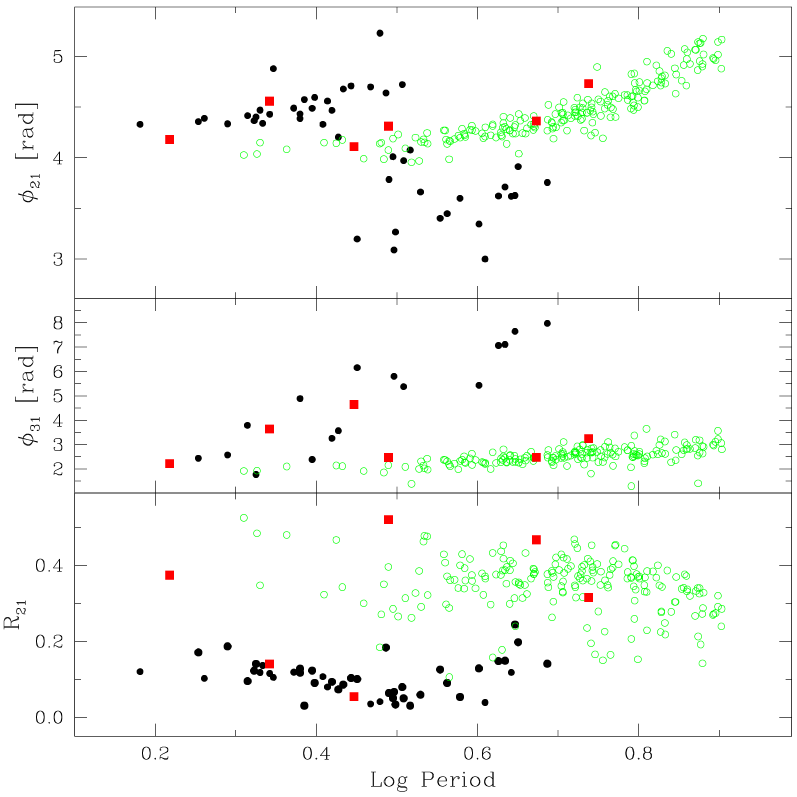
The Fourier decomposition of the light curves of Cepheids allowed us to disentangle and radial pulsators (Fig. 12). The -sequence formed by the classical Cepheids reproduces the well-known Hertzsprung progression. It can be described by the linear relation (Poretti 2000). The progression is sharp, since a shift of 0.30 rad pushes a star well outside it. Another Z-shaped sequence was put in evidence by applying the Fourier decomposition to the light curves of Galactic Cepheids with 8 d: the upper part of this sequence is composed of stars with 4.2 rad, the lower part of stars with 4.0 rad (Fig. 12, top panel). The plane was the Rosetta stone to link the upper and lower sequences, since it shows just one continuous sequence, well separated from the classical one (Fig. 12, middle panel). The Fourier decomposition of the light curves of double-mode () Cepheids provided the definitive evidence that the pulsation mode drives the separation between the different sequences (Pardo & Poretti 1997; Poretti & Pardo 1997). The plot shows that the amplitude of the harmonic 2 of the -mode pulsators is much smaller than that of the main frequency (Fig. 12, bottom panel). This fact makes the light curves of the -mode pulsators much more (but not exactly) sine-shaped than those of -mode pulsators. Theoretical works demonstrated how the inclusion of convective energy transport has made possible to reproduce the observed sequence of -pulsators and that the sharp features in the Fourier coefficients are due to the resonance between the fourth and first overtones (Feuchtinger, Buchler & Kollàth 2000).
The classification of CoRoT 0211626074 and CoRoT 0315221415 is straightforward, since the , , and parameters put both these long-period (in our sample) Cepheids on the well-defined sequence of -mode pulsators.
The period of CoRoT 0102618121 and DP Mon are very particular in this context. They lie exactly on the discontinuity of the Z-shaped sequence of the pulsators in the plane, where the intersection with the -sequence occurs. Therefore, the parameter alone is not able to identify their pulsation mode. However, the much higher value of and the much smaller value of with respect to those of the classical Cepheids clearly demonstrate that CoRoT 0102618121 is a pulsator. On the other hand, the and parameters of DP Mon match the -sequence. The light curve of DP Mon is very asymmetrical (Fig. 6) and it is very similar to those of RRab stars. In particular, notice the kink before the minimum, that requires a large number of harmonics to be fitted.
We classify CoRoT 0221640090 as a pulsator, like CoRoT 0102618121. The case of V376 Mon is more intriguing, since its period is very short also with respect to the full sample of Galactic Cepheids. The Cepheids with 2.5 d are quite rare and the space of Fourier parameters is scarcely populated in this region. For this reason the values of and are not able to provide a clear mode identification. However, the value is quite high, and hence the star is very probably a mode pulsator.
7.1 The coloured light curves
The continuous photometry allowed us to verify the phases of maximum brightness () in the CoRoT colours with great accuracy. The analyses described in the previous sections were repeated for each colour of each star. The results are summarized in Table 4. There is a common trend indicating that the maximum brightness occurs a little earlier at short wavelengths than at long ones. The only exception is DP Mon, whose maxima are measured at the same phases (within error bars) in all colours.
The observed phase shifts are very small, around 0.01 period. This result strongly corroborates the practice to merge all the maxima observed with different filters or techniques when studying secular period variations. Indeed, this shift is usually smaller than the uncertainties on the Tmax determination in case of ground-based, fragmented observations. This is the first measurement of the phase shifts among light curves of Cepheids in different colours after the pioneering approach by Wisniewski & Johnson (1968).
| Star | Blue | Green | Red | White |
|---|---|---|---|---|
| CoRoT 0102618121 | 0.993 | 0.997 | 1.004 | 1.000 |
| in LRa01 | 0.003 | 0.003 | 0.003 | 0.003 |
| CoRoT 0102618121 | 0.994 | 0.996 | 1.003 | 1.000 |
| in LRa06 | 0.005 | 0.005 | 0.003 | 0.003 |
| CoRoT 0221640090 | 0.994 | 1.002 | 1.007 | 1.000 |
| 0.003 | 0.003 | 0.005 | 0.003 | |
| V376 Mon | 0.996 | 0.998 | 1.002 | 1.000 |
| 0.003 | 0.003 | 0.003 | 0.003 | |
| DP Mon | 0.998 | 1.000 | 1.001 | 1.000 |
| 0.003 | 0.003 | 0.003 | 0.003 |
8 Discussion and conclusions
The power spectra of the CoRoT light curves of Galactic Cepheids did not show any convincing evidence of the excitation of nonradial modes, especially in the three monitored in the Long Runs. Stars showing additional modes were found with an incidence of 10% among the -Cepheids of the LMC (Moskalik & Kołaczkowski 2008). The only two -pulsators observed by CoRoT cannot yet tell us if Galactic -Cepheids behave differently than LMC ones. On the other hand, the -Cepheids of the LMC do not show additional modes (Moskalik & Kołaczkowski 2008, 2009) and the intensive CoRoT photometry does not modify this issue. The detection of the same peak in two independent sets of residuals of CoRoT 0102618121 seemed to be a decisive piece of evidence in favour of the excitation of a nonradial mode, but it not survived the change of the procedure for the computation of the residuals.
In our opinion the instrumental effects seem to play an important role in the long time series of space photometry. Our recommendation is to analyse residuals calculated from local solutions (e.g. cycle-to-cycle when possible) to search for additional periodicities. Instrumental drifts and jumps (Fig. 1) or, in extreme cases, numerical errors or amplitude changes can enhance spurious peaks in the power spectrum of the residuals calculated from a global fit (Fig. 2). The residuals from the cycle-by-cycle fits are providing a much more reliable dataset to be analysed in frequency (Fig. 3). Omitting a high harmonic from the fit and verify that it is correctly recovered is an excellent litmus test of the whole procedure. Moreover, the lack of combination terms between the main pulsation mode and the suspected additional component should be considered a warning against the identification of this component as a true excited mode.
Another compelling result expected from the analysis of the CoRoT light curves was to verify the repetitivity and the amplitude of the cycle-to-cycle variations, as those observed in the Kepler data of V1154 Cyg (Kanev et al. 2015) and in the radial-velocity surveys (Anderson 2014). The Fourier parameters of the light curves of CoRoT Cepheids show some variability, but in general all the changes are within . Moreover, they seem to be erratic, not reproducing phenomena like activity cycle or long-term effects.
No large scatter was observed around the maxima of the folded light curves and no large variations were observed in the O-C plots of the Cepheids monitored with CoRoT. In particular, the O-C values are all within 0.01 d, i.e.,15 min, including the -mode pulsators CoRoT 0102618121 and CoRoT 0221640090 (Figs. 4, 9, 10, and 11). This is particularly interesting since the space photometry obtained with the satellite MOST showed some instabilities in the pulsation cycle of the -Cepheid SZ Tau, while the -mode RT Aur repeated the light curve more precisely (Evans et al. 2015). Therefore, we performed some additional tests on the folded light curves, evaluating the standard deviations as a function of phase bins. Tiny increases of the standard deviations were measured in correspondence of the most rapid light variation (i.e., on the steep ascending branch); they mostly reflect the variability due to the pulsation within the phase bins, as proven by the fact that they appear to be more relevant for the stars showing the largest amplitudes and the most asymmetrical light curves. This suggests that the standard deviations of the phase bins on the rising branch cannot be used as a tool to search for cycle-to-cycle variations. We can conclude that in the case of the seven CoRoT Cepheids, the cycle-to-cycle variability is very limited and not greatly affecting the repetitivity of the light curves. The light variations observed around the maxima of SZ Tau are more promising, but on this context the low-frequency peaks in the power spectrum have to be carefully considered: the residuals observed in MOST photometry (Fig. 6 in Evans et al. 2015) are very similar to the spurious ones detected in CoRoT one (Fig. 3).
We also benefit from the unique opportunity provided by the CoRoT multicolour photometry. Very small shifts in the Tmax’s were observed for the first time in the optical range. Because these shifts are around 0.01 period only, our analysis support the use of Tmax’s observed in different passbands to reconstruct secular period variations (e.g. Evans et al. 2015).
The accurate values of the Fourier parameters provided by the available space photometry up to very high harmonics can be used to improve the automatic classification of the Cepheid subclasses, i.e., Pop. I, Pop. II, -mode, and -mode pulsators. The quantitative separation of these subclasses in the parameter space is of particular relevance when considering the large harvest of new variables that will be discovered by future, wide-field, and all-sky space missions like TESS (Ricker et al. 2014) and PLATO 2.0 (Rauer et al. 2014).
Acknowledgements
The CoRoT space mission has been developed and operated by CNES, with contributions from Austria, Belgium, Brazil, ESA (RSSD and Science Program), Germany, and Spain. The authors thank the anonymous referee for useful comments. EP acknowledges Observatoire Midi-Pyrénées for the two-months grant allocated between 2014 May and July; useful discussions with Boris Dintrans and Pascal Fouqué at the very beginning of the project are acknowledged. JMB thanks for the support of the NKFIH Grant K-115709. MR acknowledges financial support from the FP7 project SpaceInn: Exploitation of Space Data for Innovative Helio- and Asteroseismology, EP acknowledges PRIN-INAF 2014 Galactic Archaelogy for support to latest activities. This research has made use of the ExoDat Database, operated at LAM-OAMP, Marseille, France, on behalf of the CoRoT/Exoplanet program. The present study has used the SIMBAD data base operated at the Centre de Données Astronomiques (Strasbourg, France).
References
- Anderson (2014) Anderson R.I., 2014, A&A, 566, L10
- Antonello, Poretti & Reduzzi (1990) Antonello E., Poretti E., Reduzzi L., 1990, A&A, 236, 138
- Benkő et al. (2014) Benkő J.M., Plachy E., Szabó R., Molnár L., Kolláth Z., 2014, ApJS, 213, 31
- Berdnikov et al. (2014) Berdnikov L.N., Kniazev A.Yu., Sefako R., Kravtsov V.V., Zhujko S.V., 2014, Astronomy Letter, 40, 125
- Bruntt et al. (2008) Bruntt H., et al., 2008, ApJ, 683, 433
- Buchler (2008) Buchler J.R., 2008, ApJ, 680, 1412
- Buchler & Szabo (2007) Buchler J.R., Szabó R., 2007, ApJ, 660, 723
- Burki, Mayor & Benz (1982) Burki G., Mayor M., Benz W., 1982, A&A, 109, 258
- Carpino, Milani & Nobili (1987) Carpino M., Milani A., Nobili A.M., 1987, A&A, 181, 182
- Debosscher et al. (2009) Debosscher J., et al., 2009, A&A, 506, 519
- Deleuil et al. (2009) Deleuil M., et al., 2009, AJ, 138, 649
- Derekas et al. (2012) Derekas A., et al., 2012, MNRAS, 425, 1312
- Donati et al. (1997) Donati J.-F., Semel M., Carter B.D., Rees D.E., Collier Cameron A., 1997, MNRAS, 291, 658
- Evans, Sasselov & Short (2002) Evans N.R., Sasselov D.D., Short I.S., 2002, ApJ, 567, 1121
- Evans et al. (2015) Evans N.R., et al., 2015, MNRAS, 446, 4008
- Feuchtinger, Buchler & Kollàth (2000) Feuchtinger M., Buchler J.R., Kollàth Z., 2000, ApJ, 544, 1056
- Fruth et al. (2012) Fruth T., et al., 2012, AJ, 143, 140
- Gruberbauer et al. (2007) Gruberbauer M., et al., 2007, MNRAS, 379, 1498
- Gustafsson et al. (2008) Gustafsson B., Edvardsson B., Eriksson K., Jørgensen U.G., Nordlund Å., Plez B., 2008, A&A, 486, 951
- Kabath et al. (2007) Kabath P., Eigmüller P., Erikson A., Hedelt P., Rauer H., Titz R., Wiese T., Karoff C., 2007, AJ, 134, 1560
- Kabath et al. (2008) Kabath P., et al., 2008, AJ, 136, 654
- Kabath et al. (2009a) Kabath P., et al., 2009, AJ, 137, 3911
- Kabath et al. (2009b) Kabath P., et al., 2009, A&A, 506, 569
- Kanev et al. (2015) Kanev E., Savanov I., Sachkov M., 2015, in 3rd CoRoT Symposium, 7th KASC Meeting, The Space Photometry Revolution, Toulouse, July 2014, in press
- Karoff et al. (2007) Karoff C., et al., 2007, AJ, 134, 766
- Kuschnig et al. (1997) Kuschnig R., Weiss W.W., Gruber R., Bely P.Y., Jenkner H., 1997, A&A, 328, 544
- Molnár & Szabados (2014) Molnár L., Szabados L., 2014, MNRAS, 442, 3222
- Montgomery & O’Donoghue (1999) Montgomery M.H., O’Donoghue D., 1999, Delta Scuti Star Newsletter, 13, 28
- Morgan, Simet & Bargenquast (1998) Morgan S.M., Simet M., Bargenquast, S., 1998, Acta Astron., 48, 509
- Moskalik (2014) Moskalik P., 2014, in Guzik J.A., Chaplin W.J., Handler G., Pigulski A., eds., IAU Proceedings S301, Vol. 9, Precision Asteroseismology, p. 249
- Moskalik & Kołaczkowski (2008) Moskalik P., Kołaczkowski Z., 2008, Comm. in Asteroseismology, 157, 343
- Moskalik & Kołaczkowski (2009) Moskalik P., Kołaczkowski Z., 2009, MNRAS, 394, 1649
- Neilson & Ignace (2014) Neilson H.R., Ignace R., 2014, A&A, 563, L4
- Pardo & Poretti (1997) Pardo I., Poretti E., 1997, A&A, 324, 121
- Poretti (2000) Poretti E., 2000, in Ibanoglu C., ed., Nato Science Series, Vol. 544, Variable Stars as Essential Astrophysical Tools, Kluwer Academic Publishers, p. 421
- Poretti et al. (2014) Poretti E., Baglin A., Weiss W.W., 2014, ApJ, 795, L36
- Poretti, Le Borgne, & Klotz (2015) Poretti E., Le Borgne J.F., Klotz A., 2015, in 3rd CoRoT Symposium, 7th KASC Meeting, The Space Photometry Revolution, Toulouse, July 2014, preprint (arXiv:1506.08122)
- Poretti & Pardo (1997) Poretti E. & Pardo I., 1997, A&A, 324, 133
- Poretti et al. (2011) Poretti E., et al., 2011, A&A, 528, A147
- Poretti et al. (2005) Poretti E., et al., 2005, A&A, 440, 1097
- Rainer (2003) Rainer M., 2003, Laurea Thesis, Università degli Studi di Milano
- Rauer et al. (2014) Rauer H., et al., 2014, Exp. Astron., 38, 249
- Reinsch (1967) Reinsch H., 1967, Numerische Mathematik 10, 177
- Ricker et al. (2014) Ricker G.R., et al., 2014, SPIE Proc., 9143, 20
- Spreckley & Stevens (2008) Spreckley S.A., Stevens I.R., 2008, MNRAS, 388, 1239
- Sziládi et al. (2007) Sziládi K., Vinkó J., Poretti E., Szabados L., Kun M., 2007, A&A, 473, 579
- Valenti & Fischer (2005) Valenti J.A., Fischer D.A., 2005, ApJS, 159 141
- Valenti & Piskunov (1996) Valenti J.A., Piskunov N., 1996, A&AS, 118, 595
- Vaniĉek (1971) Vaniĉek P., 1971, Ap&SS, 12, 10
- Wachmann (1964) Wachmann A.A., 1964, Astron. Abhandlungen Hamburger Sternwarte, 7, 4
- Wisniewski & Johnson (1968) Wisniewski W.Z., Johnson H.L., 1968, Communications of the Lunar and Planetary Laboratory, Volume 7, Part 2, p. 57-78
- Wu (2001) Wu Y., 2001, MNRAS, 323, 248
Appendix A Solutions of the CoRoT light curves
We provide the solutions of the CoRoT light curves of the Cepheids observed in the Long Runs. We fitted the CoRoT magnitudes by means of the formula
| (1) |
and we calculated the Fourier parameters (e.g. ) and (e.g. and ) from the amplitude () and phase () coefficients. The error bars were calculated at the level (Montgomery & O’Donoghue 1999).
| CoRoT 0102618121, =0.3573905(1) d-1 | V376 Mon | ||||||||
| LRa01 | LRa06 | =0.6053382(4) d-1 | |||||||
| Term | Ampl. | Phase | Ampl. | Phase | Ampl. | Phase | |||
| [mag] | [rad] | [mag] | [rad] | [mag] | [rad] | ||||
| 0.110500(4) | 3.06375(4) | 0.116054(6) | 3.05962(5) | 0.15852(2) | 2.5446(1) | ||||
| 2 | 0.005962(4) | 3.95440(72) | 0.006552(6) | 3.94414(90) | 0.05937(2) | 2.9871(2) | |||
| 3 | 0.000699(4) | 1.26965(616) | 0.000896(6) | 1.30168(655) | 0.02715(2) | 3.5712(5) | |||
| 4 | 0.000621(4) | 3.31223(693) | 0.000809(6) | 3.24492(726) | 0.01096(2) | 4.0676(14) | |||
| 5 | 0.000287(4) | 4.55196(1499) | 0.000389(6) | 4.51949(1509) | 0.00435(2) | 4.4503(34) | |||
| 6 | 0.000135(4) | 5.74428(3180) | 0.000120(6) | 5.64753(4876) | 0.00156(2) | 4.6689(94) | |||
| 7 | 0.000049(4) | 0.55276(8822) | 0.000078(6) | 0.09852(7486) | 0.00077(2) | 4.5913(190) | |||
| 8 | 0.000024(4) | 2.10979(17710) | 0.000025(6) | 1.97647(23114) | 0.00049(2) | 4.6907(297) | |||
| 9 | 0.00036(2) | 4.9298(408) | |||||||
| 10 | 0.00028(2) | 5.3570(534) | |||||||
| 11 | 0.00016(2) | 5.8615(952) | |||||||
| 12 | 0.00010(2) | 6.1633(1511) | |||||||
| 13 | 0.00007(2) | 0.7590(2155) | |||||||
| 14 | 0.00005(2) | 0.7422(3075) | |||||||
| Res. rms | 0.00174 mag | 0.00184 mag | 0.00133 mag | ||||||
| T0 | HJD 2454394.6990 | HJD 2455936.4282 | HJD 2454785.4731 | ||||||
| CoRoT 0659466327 | |||
| =0.648366006 d-1 | |||
| Term | Ampl. | Phase | |
| [mag] | [rad] | ||
| 0.19348(4) | 2.6323(2) | ||
| 2 | 0.05637(4) | 3.3752(7) | |
| 3 | 0.03478(4) | 2.5001(12) | |
| 4 | 0.02705(4) | 2.9155(16) | |
| 5 | 0.01608(4) | 3.8907(26) | |
| 6 | 0.01154(4) | 4.7951(36) | |
| 7 | 0.00629(4) | 5.6173(67) | |
| 8 | 0.00262(4) | 0.3086(161) | |
| 9 | 0.00055(4) | 1.1627(767) | |
| 10 | 0.00052(4) | 6.0158(832) | |
| 11 | 0.00076(4) | 0.8167(555) | |
| 12 | 0.00083(4) | 1.9510(508) | |
| 13 | 0.00068(4) | 2.9567(614) | |
| 14 | 0.00041(4) | 4.1419(1024) | |
| 15 | 0.00019(4) | 5.2084(2196) | |
| 16 | 0.00007(4) | 5.7712(6216) | |
| 17 | 0.00009(4) | 5.4264(4543) | |
| 18 | 0.00016(4) | 0.2652(2712) | |
| Res. rms | 0.00323 mag | ||
| T0 | HJD 2456031.4482 | ||
| CoRoT 0221640090 | |||
| =0.455047 d-1 | |||
| Term | Ampl. | Phase | |
| [mag] | [rad] | ||
| 0.14079(1) | 2.9111(1) | ||
| 2 | 0.01967(1) | 4.0987(7) | |
| 3 | 0.00290(1) | 6.0910(47) | |
| 4 | 0.00156(1) | 1.7476(87) | |
| 5 | 0.00102(1) | 3.1642(132) | |
| 6 | 0.00055(1) | 4.3818(244) | |
| 7 | 0.00035(1) | 5.5170(384) | |
| 8 | 0.00017(1) | 0.4274(795) | |
| 9 | 0.00009(1) | 1.3975(1468) | |
| 10 | 0.00002(1) | 1.9638(6112) | |
| 11 | 0.00006(1) | 3.2910(2157) | |
| 12 | 0.00002(1) | 3.6209(6119) | |
| Res. rms | 0.00259 mag | ||
| T0 | HJD 2454754.6755 | ||
| CoRoT 0211626074 | |||
| =0.182796 d-1 | |||
| Term | Ampl. | Phase | |
| [mag] | [rad] | ||
| 0.12984(3) | 2.5207(3) | ||
| 2 | 0.04086(3) | 3.4897(8) | |
| 3 | 0.01028(3) | 4.5213(32) | |
| 4 | 0.00095(3) | 5.1938(341) | |
| 5 | 0.00166(3) | 3.0263(195) | |
| 6 | 0.00128(3) | 3.7305(253) | |
| 7 | 0.00103(3) | 4.5825(315) | |
| 8 | 0.00062(3) | 5.3574(527) | |
| 9 | 0.00036(3) | 6.2663(912) | |
| 10 | 0.00018(3) | 0.8783(1842) | |
| 11 | 0.00010(3) | 2.1266(3298) | |
| 12 | 0.00008(3) | 2.7998(4124) | |
| Res. rms | 0.00144 mag | ||
| T0 | HJD 2454199.7103 | ||
| CoRoT 0315221415 | |||
| =0.212384 d-1 | |||
| Term | Ampl. | Phase | |
| [mag] | [rad] | ||
| 0.21116(6) | 2.4327(3) | ||
| 2 | 0.09819(6) | 2.9456(6) | |
| 3 | 0.04415(6) | 3.4927(14) | |
| 4 | 0.02011(6) | 3.8819(31) | |
| 5 | 0.00735(6) | 4.0916(84) | |
| 6 | 0.00386(6) | 3.9842(159) | |
| 7 | 0.00298(6) | 3.7086(207) | |
| 8 | 0.00314(6) | 3.8961(196) | |
| 9 | 0.00299(6) | 4.3491(205) | |
| 10 | 0.00246(6) | 4.8484(248) | |
| 11 | 0.00201(6) | 5.4295(305) | |
| 12 | 0.00158(6) | 6.0745(387) | |
| 13 | 0.00122(6) | 0.3769(501) | |
| 14 | 0.00087(6) | 1.1612(706) | |
| 15 | 0.00060(6) | 1.8127(1016) | |
| 16 | 0.00045(6) | 2.6720(1363) | |
| 17 | 0.00032(6) | 3.5748(1915) | |
| 18 | 0.00016(6) | 4.2500(3960) | |
| 19 | 0.00020(6) | 5.1683(3062) | |
| 20 | 0.00016(6) | 0.3755(3767) | |
| Res. rms | 0.00262 mag | ||
| T0 | HJD 2455258.4566 | ||
| DP Mon | |||
| =0.323939 d-1 | |||
| Term | Ampl. | Phase | |
| [mag] | [rad] | ||
| 0.23679(2) | 2.2927(1) | ||
| 2 | 0.12315(2) | 2.6145(1) | |
| 3 | 0.07198(2) | 3.0652(2) | |
| 4 | 0.04044(2) | 3.4315(4) | |
| 5 | 0.02352(2) | 3.6996(7) | |
| 6 | 0.01444(2) | 4.0036(12) | |
| 7 | 0.00856(2) | 4.2711(20) | |
| 8 | 0.00523(2) | 4.4842(33) | |
| 9 | 0.00323(2) | 4.6872(54) | |
| 10 | 0.00205(2) | 4.7897(85) | |
| 11 | 0.00126(2) | 4.8674(137) | |
| 12 | 0.00096(2) | 5.0046(180) | |
| 13 | 0.00074(2) | 5.0513(234) | |
| 14 | 0.00058(2) | 5.2112(296) | |
| 15 | 0.00048(2) | 5.3839(359) | |
| 16 | 0.00041(2) | 5.6321(425) | |
| 17 | 0.00034(2) | 5.9751(515) | |
| 18 | 0.00024(2) | 6.0823(712) | |
| 19 | 0.00022(2) | 0.1627(799) | |
| 20 | 0.00014(2) | 0.5256(1234) | |
| 21 | 0.00016(2) | 0.7288(1113) | |
| 22 | 0.00010(2) | 1.3601(1793) | |
| 23 | 0.00009(2) | 1.1871(2008) | |
| 24 | 0.00003(2) | 1.4777(5286) | |
| 25 | 0.00005(2) | 1.8188(3629) | |
| Res. rms | 0.00328 mag | ||
| T0 | HJD 2454754.0407 | ||