Synchronization versus neighborhood similarity
in complex networks of non-identical oscillators
Abstract
Does the assignment order of a fixed collection of slightly distinct subsystems into given communication channels influence the overall ensemble behavior? We discuss this question in the context of complex networks of non-identical interacting oscillators. Three connection configurations found in Nature are considered here: Similar, Dissimilar and Neutral patterns. These strategies correspond respectively to oscillators alike, distinct and indifferent relate to its neighbors. To construct such scenarios we define a vertex weighted graph measure, the Total Dissonance, which comprises the sum of the dissonances between all neighbor oscillators in the network. Our numerical simulations show that the more homogeneous is a network, the higher tend to be both the coupling strength required to phase-locking and the associated final phase configuration spread over the circle. On the other hand, the initial spread of partial synchronization occurs faster for Similar patterns in comparison to Dissimilar ones, while neutral patterns are an intermediate situation between both extremes.
pacs:
05.45.Xt, 89.75.FbSome social and biological studies about multi-agents reveal that units tend to select similar peers to interact Hamm (2000); Abadzi (1985). However, there are systems which behave in opposite manner, where their components preferentially choose to connect themselves to others with some distinct inner characteristics Reusch et al. (2001). In fact, Nature seems to favor the former or the later construction, which we respectively call Similar or Dissimilar (neighborhood) patterns, to achieve different agendas Lozares et al. (2014). This article explores ideas inspired by these scenarios within the non-identical phase oscillator Kuramoto model with local mean field coupling, which is one of the main paradigms to describe collective behavior and synchronization Kuramoto (1984). This model is also interesting because it approximates dynamics of a large class of non-linear oscillators near limit cycle, under weak mutual interaction Pikovsky et al. (2003). Besides, this is an active research field with a number of applications from different areas Strogatz (2001); Arenas et al. (2008); Filatrella et al. (2008); Follmann et al. (2014), highlighting the fundamental role that synchronization plays.
Our numerical approach is based on a novel vertex weighted graph measure: the total dissonance. This quantity can be regarded as a generalization of the classical concept of dissonance, that is, the natural frequency difference from the case of two coupled oscillators Pikovsky et al. (2003). So, we define Similar and Dissimilar neighborhood patterns as the assignments of non-identical oscillators into the coupling graph which yield, respectively, significantly lower and higher total dissonance values. Otherwise, if a pattern has no strong bias, we call it Neutral. Given a fixed choice of inner properties for each oscillator and a fixed coupling graph, we search for Similar and Dissimilar patterns via an optimization algorithm interchanging oscillator’s positions into the graph nodes. Finally, massive numerical simulations are performed to grasp the influence of these three different neighborhood patterns over phase-synchronization quantifiers. Regular, scale-free, random, small world and community networks are considered Steen (2010) to provide evidences about the ubiquity of our argument.
About related material, Ref. Gómez-Gardeñes et al., 2011 and Ji et al., 2013, respectively, explore first and second order Kuramoto Model versions, both including local correlations between oscillator’s natural frequency and node-degree. They report an explosive synchronization in the first case and cascade synchronization, according to the node-degree, in the second. Our methodology introduces a diverse relationship between natural frequencies and coupling graph, as will be discussed and illustrated in the text.
Optimization studies also laid foundation to our research. In Ref. Brede, 2008, an algorithm is proposed to construct optimized networks related to a combination of local and global synchronization measures. Their objective function is computed and refined after successive numerical integrations. Although we follow a different approach, we point out that our results also support that “the early onset of synchronization and rapid transition to the phase-lock are conflicting demands on the network topology” Brede (2008). Ref. Zhang et al., 2014 associates a percolation process to the spread of synchronization. In addition, they consider node interchange in the graph based on a vertex weighted graph measure. However, their characterization takes into account only the phase sign of neighbor oscillator. Even so, we also found a similar explosive synchronization.
It is a common sense that a way to achieve more homogeneous neighborhood patterns is to gather members with closer intrinsic dynamics into communities. Thus, articles that investigate this framework can also benefit from our findings. Ref. Arenas et al., 2006 addresses a Kuramoto model of identical oscillators showing that, as the transient time dies out, synchronization occurs in stages matching the granular communities of the coupling graph. Ref. Komarov and Pikovsky, 2013 deals with communities of oscillators having essentially different natural frequencies. The authors of this paper discuss ways to promote or suppress synchrony on individual subgroups. Ref. Wang et al., 2009 introduces a dynamic feedback control to produce intra-communities synchronization regarding communities of identical non-linear oscillator. Accordingly, Similar, Neutral and Dissimilar patterns can be a feasible tool to adjust synchronization properties within the context of related works.
I Model and Metrics
We consider a system of phase oscillators, whose dynamics for the -th oscillator is
| (1) |
where are the oscillator’s natural frequencies. We consider with zero mean 111Without loss of generality, otherwise this mean value can be absorbed into the space stated and eliminated with a coordinate change, randomly drawn from the uniform distribution over . The coupling strength is the system parameter that adjusts the intensity of attractiveness between neighbor oscillators. The symmetrical coupling graph is expressed by its adjacency matrix , so that ; , if oscillators are neighbors (adjacent); and , otherwise. We assume connected graphs, meaning that there is a sequence of edges joining any two vertexes in the graph. Also, stands for the -th vertex degree. The Laplacian matrix is defined as and its eigenvalues are . The first non-trivial eigenvalue , the algebraic connectivity, is greater than zero if and only if the graph is connected Godsil and Royle (2001).
On one hand, analytical results Jadbabaie et al. (2004) guarantee convergence to a unique (modulus ) stable phase-locked regime, where phase differences between every two oscillators becomes constant. Precisely, this convergence occurs if the coupling strength is large enough in comparison with , where denotes the Euclidean norm in . Because increases when the graph diameter is decreased and decreases with its maximum degree Li and Zhang (1998), phase-locking can be achieved for smaller values of mostly with the reduction of , but also with smaller values of and . On the other hand, if we consider a system with only two phase oscillators, it is well known Pikovsky et al. (2003) that the relation between its dissonance versus the coupling strength determines the synchronization regime222Arnold Tongues for instance can describe this interplay Pikovsky et al. (2003). So, inspired by this context, we introduce the total dissonance measure for vertex weighted graphs as
| (2) |
Since we consider symmetrical and connected coupling graphs, it is straightforward to check that if and only if all oscillator are identical. If we write , this measure quantifies how far is from a condition where all natural frequencies are identical. Therefore, encompasses information about the total spreading of by summing up individual dissonances over the coupling graph edges.
The norm of the global mean field, the order parameter, will be denoted by . This quantity ranges from to , respectively indicating that the ensemble gradually changes from null global mean field, where all phasors cancel out, to full synchronization, where . We also make use of the edge partial synchronization index between two oscillators ,
where is a large enough transient time Gómez-Gardeñes et al. (2007). Oscillators are phase-locked, that is converges to a constant value, if and only if . Moreover, if this index is decreased towards zero, then weaker forms of synchronization and later uncorrelated trajectories occur Freitas et al. (2013). We average contributions of all neighbor oscillators in the network to define the partial synchronization index
| (3) |
where is the quantity of directed edges in the graph. Of course, the number of undirected edges is . Thus, means that the whole ensemble is phase-locked, while yields very low coherent ensemble behavior. Note that converges to a constant value 333It is straightforward to check that this constant value cannot be the unit for non-identical oscillators. if and only if .
An Adams-Bashforth-Moulton Method for numerical integration is applied. Transient time of at least units of time was suppressed from the data, while the convergence of approximations of over successive time windows of units of time was the criterion to interrupt the integration. The mean value of after the transient is denoted by . For a given choice of parameters and initial conditions, we indicate by the smallest critical coupling strength inducing phase-locking, i.e. and converges to a constant value, which we denote by .
Several complex networks topologies Steen (2010) with nodes and (undirected) edges are considered: 4-Regular ( RE), Barabási-Albert ( BA), Erdős-Rényi ( ER) and Watts-Strogatz 444Watts-Strogatz networks with rewiring probability of 0.25 are considered ( WS). Experiments with relatively small networks with are performed for the sake of easy visualization. Larger ones, with , are also addressed to illustrate graphs closer to the theoretical degree distribution Steen (2010), yet feasible to massive numerical integration. To diminish computational cost and to allow comparison among network topologies, we consider graphs with directed edges, which yields mean node-degree .
Besides, a real world complex network with community structure, denoted by CO, is included in the simulations: the Krebs-Amazon Political Books network 555 Data set description at http://www.orgnet.com/ and Adjacency matrix from http://moreno.ss.uci.edu/data.html. This graph comprises nodes, edges and communities.
A single choice of natural frequencies were randomly drawn, matching network sizes . The term Configuration stands for a specific pair of graph and permutation of the vector . For a fixed coupling graph, if one obtains permutations of such that the associated is closer to its minimum or maximum, we have Similar (S) or Dissimilar (D) patterns, respectively. On the other hand, when no optimization process is applied and is far from extremes values, we call it a Neutral (N) pattern.
Fig. 1 illustrates graphs following RE, BA and CO topologies with Similar, Neutral and Dissimilar configurations.
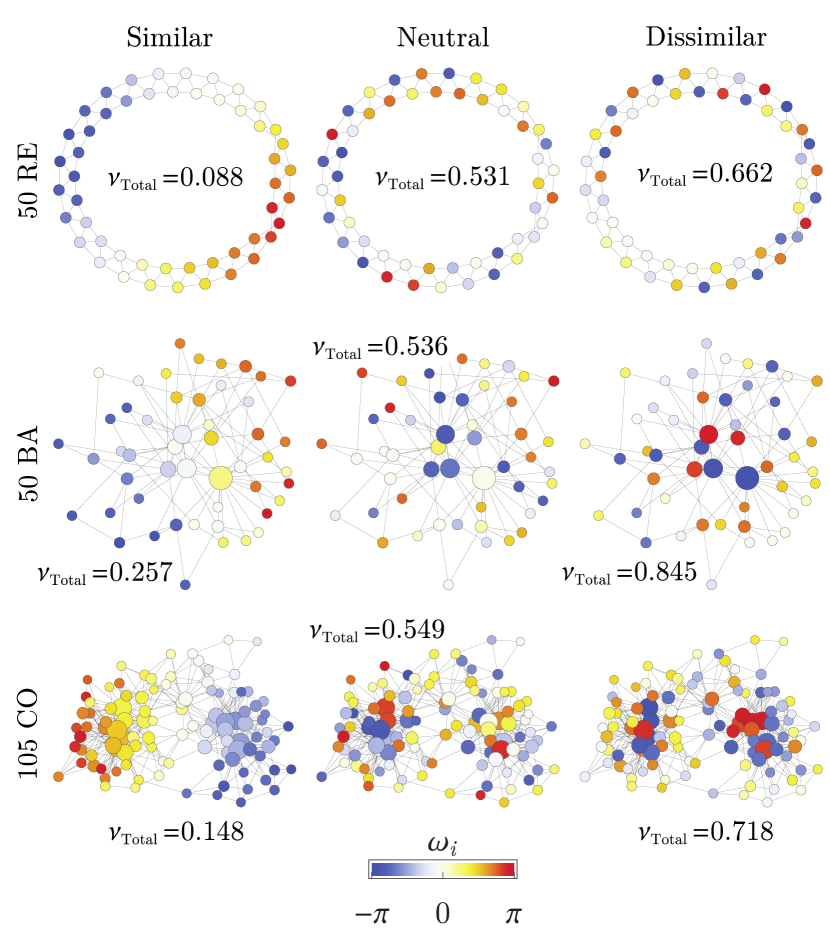
From the RE graph with Similar configuration of this figure, one realizes a gradual transition of . It happens because this pattern reduces the dissonance through edges, so each node presents natural frequency close to the respective average of its neighbors. However, this ordering arises differently depending on the network topology. Hubs of the BA graph were colored with lighter tones, corresponding to the overall mean of natural frequency distribution. But in the CO graph, positive and negative natural frequency values were placed into distinct communities, with hubs close to and central nodes (in between communities) close to null .
About the Dissimilar configurations from Fig. 1, the opposite organization is found: each node receives natural frequency far from its neighbors. For the RE network, we clearly notice sequences of connected nodes with alternating positive and negatives values of . Besides, BA and CO graphs presented connected hubs with larger natural frequencies and opposite signs. Eventually, Neutral configuration can be regarded as a blending between both previous configurations.
Let us now describe a mechanism to seek Similar and Dissimilar patterns. For a given graph, we use successive iterations of the Simulated Annealing optimization method Kirkpatrick (1984) to search over the existing permutations of the vector . This problem may be challenging by itself due to its computational complexity. To enhance performance, we betake the observed features described in the previous paragraph to empirically tailor our algorithm.
Let denote the input to the optimization process. This initial seed to search Similar pattern is constructed by gathering the values of which are close to each other into (modularity-based) communities Lancichinetti and Fortunato (2009). No special node ordering within each community is imposed so far, but an auxiliary step of the SA algorithm is used to reorder communities to reduce . For Dissimilar patterns, is allocated by matching larger vertex degrees with higher absolute values of .
After that, either to minimize or maximize the total dissonance , successive iterations of the SA are applied. For each stage , its initial seed is given by the outcome of the previous iteration. Alternating strategies to randomly evolve approximate solutions are employed at each stage.
First, nodes to be swapped are drawn with probability proportional to vertex degree, since they are the ones which influence the most . We also pick vertexes to be interchanged only within the same modularity-based community. Thus, we can focus the optimization process on relatively detached graph regions. Lastly, to facilitate escape from local critical points and also to fine adjustments, we consider all nodes equiprobable.
Recall that any Configuration (of a graph and natural frequencies ) which suffered no optimization process is said to be Neutral. Yet, when we apply to a Configuration the optimization process described above, we obtain Similar or Dissimilar patterns with minimization or maximization , respectively. So, each pair generates the three patterns.
Since RE topology is deterministic and the CO graph was extracted from a data set, these classes contain a single member to be analyzed. Yet, we randomly generate and include in our experiments 100 graphs of BA, ER and WS network topologies.
Fig. 2 displays a distribution chart of the total dissonances obtained for the categories included in this article. From this figure, one notices a sharp distinction among patterns since there is no range overlapping within each category.
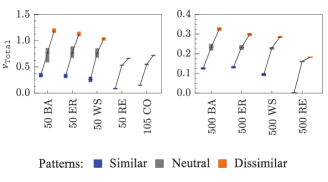
The set of graphs with presented values of three times smaller than the set with . Furthermore, both sets were qualitatively alike, which is an evidence that we were capable to produce Similar and Dissimilar neighborhoods in the large networks, at least as well as the small ones.
Because there is only a normalization by the number of vertex in the graph, but not by the quantity of edges, in Eq. (2), the total dissonance decreases with smaller mean degrees in all categories as expected. 666From the optimization point of view, the normalization by any constant value, whether the number of edges or the quantity of nodes , does not influence the Similar and Dissimilar configurations obtained. We opt not to normalize by to reflect that the more edges a graph contains, the more conflicting pairs of dissonances exist in the network, which yields higher total dissonance. BA, ER and WS topologies were almost indistinguishable in the Neutral pattern, but were slightly higher in this order, for the Dissimilar case. All patterns of RE and CO graphs yielded smaller but comparable with each other total dissonance values.
We remark that the essential purpose of the total dissonance in this work was to lay foundation for the definition and search of Similar, Neutral and Dissimilar configurations. We could have formulated the subjective concepts of Similar (homogeneous) and Dissimilar (heterogeneous) networks based on variations of Eq. (2). It is deferred for awhile to future research the study of correlations between gradual transitions of the values of this metric, far from the Similar and Dissimilar extremes, and synchronization features.
We abuse notation and also denote by , , and the associated mean values of these synchronization quantifiers considering all graphs of each category. A fixed random choice of initial condition is drawn from a uniform distribution over the unit circle for each network size . So, Fig. 3 displays the values of and , as solid and dashed line resp., obtained through numerical integration for the three neighborhood configurations colored like in Fig. 2. The time variable of both and times series are rescaled to end at the associated mean critical coupling value . The lines finish at value , within the numerical tolerance, while the final value of lines equal to the mean critical order parameter .
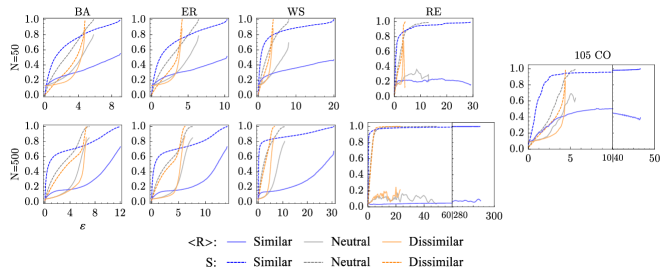
First, one focus on the phase-locking measures and . Irrespective to network size, overall results were alike. In general, decreases from Similar, Neutral to Dissimilar patterns; while tend to increase in the same ordering. In all topologies, Similar cases demanded higher coupling strength to achieve phase-locking. In particular since this holds true even for RE networks, it shows that total dissonance patterns induce a different phenomena than the ones from Refs Gómez-Gardeñes et al., 2011; Ji et al., 2013.
Moreover, even when these networks phase-locked, converged to smaller values of . In other words, Similar ensembles tend to be harder to synchronize and to converge to regimes where oscillators were more spread around the unit circle than their counterparts. Neutral patterns required smaller than Dissimilar ones. RE graphs were the only exception for these behavior of .
For all topologies, higher values of were measured when was multiplied by . On the other hand, larger networks yielded higher for Similar and Neutral neighborhoods, but slightly smaller for Dissimilar ones.
At this point, the influence of Similar, Neutral and Dissimilar patterns over the emergence of phase-synchronization is investigated, specially related to coupling strengths much smaller than .
Again, except for RE graphs, we verify that Similar patterns favor weaker synchronization regimes, since the initial growth of and for small coupling strength is more prominent. However, beyond intermediate values of , Dissimilar patterns surpass the Similar ones through an abrupt transition. The Neutral case is in-between these two extremes, closer to the behavior of the Dissimilar group. If we compare network topologies, BA and ER graphs displayed close values of , which were smaller than WS ones for small and intermediate values of .
A parallel of our findings could be made with percolation of conflicting ideas, associating communication and agreement with the emergence of synchronization and phase-locking, respectively. In Similar scenarios, interaction mostly occurs among people with closely related culture backgrounds. Thus, communication can easily spread locally, but the overall population, which contains diverse members, will hardly find a compromise. On the other hand, when networks contain more heterogeneous neighbors, as in the Neutral and Dissimilar cases, communication demands higher effort to be established. But after that, the whole ensemble is capable to rapidly reach consensus.
In summary, experiments with several network topologies were analyzed and strong numerical trend was found. The Neutral case behaves in general between both extremes, closer to the Dissimilar case. Except for RE networks, under small coupling strength , Similar patterns yield larger values of partial synchronization index , meaning early synchronization ongoing. In contradistinction, Dissimilar ones present smaller values of , but undergo abrupt increment until phase-locking. Moreover, all networks with Similar patterns required higher values of coupling strength to achieve phase-locking, while Dissimilar patterns converged to regimes closer to full synchronization.
Acknowledgements.
We would like to thank the Coordenação de Aperfeiçoamento de Pessoal de Nível Superior - CAPES (Process: BEX 10571/13-2), CNPq and FAPESP (grant 2011/50151-0) for financial support.References
- Hamm (2000) J. V. Hamm, Developmental Psychology 36(2), 209 (2000).
- Abadzi (1985) H. Abadzi, The Journal of Educational Research 79, 36 (1985).
- Reusch et al. (2001) T. B. Reusch, M. A. Haèberli, P. B. Aeschlimann, and M. Milinski, Nature 414, 300 (2001).
- Lozares et al. (2014) C. Lozares, J. M. Verd, I. Cruz, and O. Barranco, Quality & Quantity 48, 2657 (2014).
- Kuramoto (1984) Y. Kuramoto, Chemical Oscillations, Waves, and Turbulence, Springer series in synergetics (Springer-Verlag, 1984).
- Pikovsky et al. (2003) A. Pikovsky, M. Rosenblum, and J. Kurths, Synchronization: A Universal Concept in Nonlinear Sciences, Cambridge Nonlinear Science Series (Cambridge University Press, 2003).
- Strogatz (2001) S. H. Strogatz, Nature 410, 268 (2001).
- Arenas et al. (2008) A. Arenas, A. Díaz-Guilera, J. Kurths, Y. Moreno, and C. Zhou, Phys. Rep. 469, 93 (2008).
- Filatrella et al. (2008) G. Filatrella, A. H. Nielsen, and N. F. Pedersen, Eur. Phys. J. B 61, 485 (2008).
- Follmann et al. (2014) R. Follmann, E. Macau, E. Rosa, and J. Piqueira, Neural Networks and Learning Systems, IEEE Transactions on PP, 1 (2014).
- Steen (2010) M. v. Steen, Graph theory and complex networks : an introduction (Maarten van Steen, Lexington, 2010).
- Gómez-Gardeñes et al. (2011) J. Gómez-Gardeñes, S. Gómez, A. Arenas, and Y. Moreno, Phys. Rev. Lett. 106, 128701 (2011).
- Ji et al. (2013) P. Ji, T. K. D. Peron, P. J. Menck, F. A. Rodrigues, and J. Kurths, Phys. Rev. Lett. 110, 218701 (2013).
- Brede (2008) M. Brede, Eur. Phys. J. B 62, 87 (2008).
- Zhang et al. (2014) X. Zhang, Y. Zou, S. Boccaletti, and Z. Liu, Scientific Reports 4 (2014).
- Arenas et al. (2006) A. Arenas, A. Díaz-Guilera, and C. J. Pérez-Vicente, Phys. Rev. Lett. 96, 114102 (2006).
- Komarov and Pikovsky (2013) M. Komarov and A. Pikovsky, Phys. Rev. Lett. 110, 134101 (2013).
- Wang et al. (2009) K. Wang, X. Fu, and K. Li, Chaos 19, 023106 (2009).
- Note (1) Without loss of generality, otherwise this mean value can be absorbed into the space stated and eliminated with a coordinate change.
- Godsil and Royle (2001) C. Godsil and G. Royle, Algebraic graph theory, Graduate Texts in Mathematics, Vol. 207 (Springer-Verlag, New York, 2001).
- Jadbabaie et al. (2004) A. Jadbabaie, N. Motee, and M. Barahona, in Proceedings of the American Control Conference, Vol. 5 (IEEE, 2004) pp. 4296–4301.
- Li and Zhang (1998) J.-S. Li and X.-D. Zhang, Linear algebra and its applications 285, 305 (1998).
- Note (2) Arnold Tongues for instance can describe this interplay Pikovsky et al. (2003).
- Gómez-Gardeñes et al. (2007) J. Gómez-Gardeñes, Y. Moreno, and A. Arenas, Phys. Rev. Lett. 98, 034101 (2007).
- Freitas et al. (2013) C. B. N. Freitas, E. E. M. Macau, and R. L. Viana, in Proceedings of the 22nd International Congress of Mechanical Engineering (2013) pp. 10334–10339.
- Note (3) It is straightforward to check that this constant value cannot be the unit for non-identical oscillators.
- Note (4) Watts-Strogatz networks with rewiring probability of 0.25 are considered.
- Note (5) Data set description at http://www.orgnet.com/ and Adjacency matrix from http://moreno.ss.uci.edu/data.html.
- Kirkpatrick (1984) S. Kirkpatrick, J. Stat. Phy. 34, 975 (1984).
- Lancichinetti and Fortunato (2009) A. Lancichinetti and S. Fortunato, Phys. Rev. E 80, 056117 (2009).
- Note (6) From the optimization point of view, the normalization by any constant value, whether the number of edges or the quantity of nodes , does not influence the Similar and Dissimilar configurations obtained. We opt not to normalize by to reflect that the more edges a graph contains, the more conflicting pairs of dissonances exist in the network, which yields higher total dissonance.
- Bergner et al. (2012) A. Bergner, M. Frasca, G. Sciuto, A. Buscarino, E. J. Ngamga, L. Fortuna, and J. Kurths, Phys. Rev. E 85, 026208 (2012).
- Gambuzza et al. (2013) L. V. Gambuzza, A. Cardillo, A. Fiasconaro, L. Fortuna, J. Gómez-Gardeñes, and M. Frasca, Chaos: An Interdisciplinary Journal of Nonlinear Science 23, 043103 (2013).