The Dynamics of Carbon Nanostructures at Detonation of Condensed High Explosives
Abstract
Based on the obtained earlier experimental conductivity graphs at detonation of five different high explosives, an analysis was performed which shows a correlation between the carbon content and the conductivity magnitude. An assumption was put forward that the conductivity in the whole detonation wave is provided by the contact mechanism along conductive carbon nanostructures.
pacs:
82.33.Vx, 82.40.Fp, 82.60.QrDetonation products (DP) of condensed high explosives (HEs) of the kind CaHbNcOd contain carbon structures of different types: soot, diamond, amorphous carbon. The ultrafine diamond (UFD) is of particular interest bib:lyamkin88 ; bib:philips88 due to its application in industry. Presently, there are several questions which are still not clear. Thus, there is no common opinion about the time of nanodiamond formation, and the formation mechanism is not clearbib:danilenko051 .
The process of carbon condensation in a detonation wave leads to the UFD formation, and this process which is in turn connected with the kinetics of chemical reactions. Experimental investigation of the kinetics is complicated due to intrinsic features of fast processes, namely short duration (several microseconds), aggressiveness of the investigated medium (high pressures of tens of GPa, high temperatures of several thousand degrees). Therefore, the kinetics is mainly studied by the numerical methods, and its features are recovered from the final results by investigating the structures extracted from DP after a chemical treatment.
Dynamics of the UFD formation can be traced by the electric conductivity which is the result of the presence of carbon nanostructures as will be discussed below. Comparison of the literature data on the chemical peak duration and the time dependence of conductivity has earlier shown that if a pronounced conductivity peak is present, its duration is close to the duration of the zone of chemical reaction bib:ershov04 ; bib:ershov07 . This allows one to observe the kinetics related to the carbon almost directly based on the conductivity graph .
Despite more than half-century research history, the nature of high conductivity at the detonation of condensed HEs is still uncertain. There is no generally acknowledged assumption of the predictive power. The investigation of conductivity is however highly promising. With the detailed understanding of the mechanism of conductivity, it could become a highly sensitive and simple tool to investigate the nanostructural changes of the medium with several advantages: only weak disturbance of the process investigated, the diagnostics directly in the high-pressure region, and in real time.
B. Hayes proposed in 1965 the correlation between the maximum value of the conductivity at the detonation and the free carbon content in the DP bib:hayes65 . He also proposed the contact mechanism of the conductivity along the carbon nanostructures which serve as “wires”. The density of condensed carbon was obtained numerically taking into account the compression of medium in the detonation wave. The density was taken in the Chapman – Jouguet point (CJP), and the maximum value of the conductivity was used although the question about the correlation between the conductivity and the detonation wave is still opened.
The assumption of the present paper differs from the above mentioned ones in the following point: for the first time, the maximum value of conductivity is connected with the total carbon content, and the conductivity in the CJP is connected with the free condensed carbon. The correlation obtained from the experimental data allows us to claim that the conductivity in the whole detonation wave is provided by the carbon nets in conductive phase except the cases with low mass fraction of carbon (less than 0.06). Thus, the dynamics of conductivity tracks the evolution of carbon nanostructures. The analysis of the experimental results obtained in the Lavrentyev Institute of Hydrodynamics SB RAS bib:ershov04 ; bib:ershov07 ; bib:ershov09 ; bib:ershov00 ; bib:ershov10 was carried out.
The detonation wave consists of the shock front, the adjacent chemical peak (von Neumann peak) where chemical reactions occur, and the Taylor rarefaction wave separated from the chemical peak by the Chapman – Jouguet point where the velocity of products is equal to the local speed of sound. In the Zeldovich–von Neumann–Doering, theory, the chemical reactions are completed in the CJP.
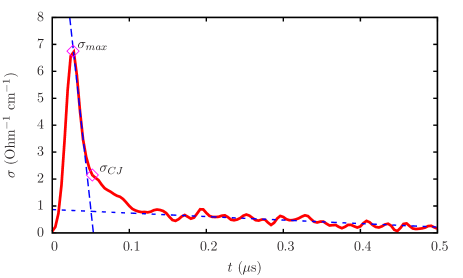
The typical graph of conductivity at the detonation of condensed HE is shown in Fig. 1. The value of conductivity increases up to the maximum during several tens of nanoseconds, then it rapidly decreases to the point marked as , which corresponds to CJP, and the region of slowly varying conductivity in the Taylor wave. The figure shows the end of the chemical reaction zone defined by a crossing of straight lines.
At present, there is no theoretical foundation of the connection between the conductivity graph and the detonation wave, therefore we discuss in detail their correlation in the framework of the assumption proposed. For the investigated HEs, the conductivity of the chemical peak is greater than bib:ershov07 . Therefore, the assumption was proposed that the maximum conductivity is provided by the total carbon content, whereas the conductivity in the CJP is due to the condensed carbon. Thus, the carbon structures grow until the upper point of the chemical peak, and the reactions with carbon occur later, in the range between the points marked as and in Fig. 1. In the CJ point, reactions are completed, the carbon nets are thinned and partially broken, and the conductivity is provided by the remaining structures. The following decrease of the conductivity is due to the partial disruption of conducting branches in the dense DP medium and the possible partial transition of the carbon to a non-conductive phase bib:danilenko051 .
The lower is the initial HE density, the higher is the influence of the charge inhomogeneity. In order to connect correctly the relative fraction of carbon in the molecule with the conductivity, the value of is necessary which is hard to obtain with the experimental technique used. Therefore we constructed approximated based on the experimental data and made an extrapolation to the crystal density.

Figure 2 shows the values of for HMX at different initial density and the linear approximation. At powder densities g/cc the large scatter is due to different grain size (21 and 430 m, bib:ershov10 ) which affects both the conductivity value and the width of the reaction zone. The increase of is clearly seen. This trend is common for all the investigated HEs.
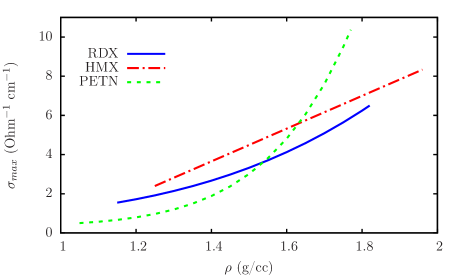
Based on the data of bib:ershov07 where the conductivity for different densities was obtained, we constructed the approximation of for RDX, HMX and PETN. Results are shown in Fig. 3. The maximum conductivity increases with the increase of density, which is connected with the increase of the density of carbon and carbon nanostructures.
Linear extrapolation of to the crystal density for TNT and TATB was made based on the powder density and the maximum obtained one bib:ershov09 ; bib:safonov ; bib:satonkina16 . For TNT, the results of bib:hayes65 were also taken into account.

Based on the data of bib:tanaka , the mass fraction of carbon in the CJ point at different initial density was calculated by the interpolation. Figure 4 shows some data of bib:ershov04 ; bib:ershov07 ; bib:ershov09 ; bib:ershov00 ; bib:ershov10 ; bib:safonov on the dependence of on the mass fraction of the condensed carbon and the values of maximum of conductivity at crystal density (extrapolation results).
There is a pronounced dependence of both the maximum conductivity and the conductivity in the CJ point on the carbon fraction. Graphs and are close.
The conductivity data are bounded from above by the power-law function and from below by the function . Here, Ohm-1 cm-1 is the conductivity of liquid carbon. Analytical approximation of the experimental data results in a steeper dependence and for the approaches the value of Ohm-1 cm-1. The conductivity of highly-oriented graphite can reach the value of Ohm-1 cm-1 , hence, the extrapolation looks reasonable.
At a certain carbon fraction, the formation of connected nets become impossible due to the lack of conductive substance. In the works bib:satonkina14 ; bib:satonkina141 , the threshold carbon fraction of 0.06 was determined in numerical experiments which theoretically allows the formation of connected nets in DP. Based of the data shown, it is possible to say that carbon influences the conductivity also at fractions lower than 0.06. In such cases, different mechanism related to the carbon can exist, e.g., thermal electron emission. For PETN, high value of the conductivity at the carbon fraction of could be explained by peculiarities of chemical reactions, where the oxidation mainly leads to the thinning of structures rather than their breakup.
The model proposed is confirmed by the following works.
1. In bib:breusov it was shown that the formation of UFD cannot be connected with the intermediate production of the free carbon, and the mechanism for the UFD formation was proposed which is connected with the partial breakup of molecular bonds and the formation of the growth of the carbon net.
2. The author of bib:anisichkin94 ; bib:anisichkin07 claims based on the analysis of experiments with isotopic tag that the carbon oxidation occurs later than the formation of carbon particles, and confirms the fast nucleation of carbon atoms. This agrees well with the data shown.
3. HEs considered in this paper have different parameters of detonation bib:tanaka , the detonation diamonds were found in products of most of them. When the diamond forms in the chemical peak, this should be seen on the conductivity graph because diamond is a dielectrics bib:elprop . However, the dependence has no explicit traces of the diamond formation. Therefore, we can suppose that carbon exists in the region of the chemical peak in a conductive phase for all the HEs investigated. The same is claimed in the work bib:danilenko051 where it was obtained for TNT, RDX, TNT/RDX mixture, and TATB that the conditions in the CJ point are shifted to the region of liquid nanocarbon when the size of nanodiamond is taken into account. The author claims that diamond is formed from the liquid phase in the rarefaction wave. In the work bib:korobenko99 , the conductivity of liquid carbon was measured experimentally at the temperatures characteristic for the detonation. Its value of Ohm-1 cm-1 explains the high values of conductivity and obtained in experiments. Such value can be reached at the contact conduction along the carbon structures connecting the interelectrode gap.
4. In the works bib:saxs , the data on the small-angle x-ray scattering (SAXS) at the detonation were obtained using synchrotron radiation. Since the scattering occurs on inhomogeneities, the magnitude of SAXS is proportional to the density difference squared of the medium and the inhomogeneity. The increase of the integral SAXS intensity is smooth without jumps in the chemical peak region which should be present if the UFD formation is completed in the von Neumann peak. The density of the liquid carbon phase at the temperatures of 5000 – 7000 K and the pressure of o.1 kbar is g/cc bib:korobenko03 . Therefore, if the carbon structures are liquid, the contrast is low, and the structures are not resolved due to small density difference of DP and carbon inhomogeneities. The smooth growth can be interpreted as the observation of the phase transition dynamics which result is the UFD.
All the mentioned confirms the model proposed.
We investigated the influence of different chemical elements on the maximum conductivity and the conductivity in the CJ point . Only the correlation with carbon was obtained.
Analysis of the data on mixed HEs published in bib:ershov00 ; bib:ershov09 ; bib:satonkinapruuel11 ; bib:satonkina15 is more complicated although the overall trend of the conductivity increase with the carbon fraction. The grain size plays a significant role of the HEs mixed.
The problem of conductivity is multiparametric. There is a correlation with the pressure for HMX, RDX and PETN mentioned in the work bib:ershov07 . The density and the temperature also affect the conductivity. However, in the coordinates “mass fraction of carbon – conductivity” their role falls out, and the role of carbon can be singled out.
In the present work, the analysis of the experimental results on condensed HEs in a broad range of the carbon fraction from 0 (in the CJ point for powder PETN) to 0.37 (fraction of carbon in TNT molecule) was performed. We obtained a correlation between the carbon content and the conductivity in the whole detonation wave. High values of the conductivity are explained by the contact mechanism which is provided by conductive carbon connected nanostructures.
This work was supported by the Russian Foundation for Basic Research (project no. 15-03-01039a).
References
- (1) A. I. Lyamkin, E. A. Petrov, A. P. Ershov, G. V. Sakovich, A. M. Staver, V. M. Titov, Sov. Phys.-Dokl. 33, 705 (1988) [in Russian].
- (2) N. R. Creiner, D. S. Philips, J. D. Jonhnson and F. Volk, Nature, 333, 440 (1988).
- (3) V. V. Danilenko, Combust., Expl., Shock Waves. 41, 577 (2005).
- (4) Ershov A.P., Satonkina N.P., Ivanov G.M. Technical Physics Letters. 30, 1048 (2004).
- (5) A.P. Ershov, N.P. Satonkina, G. M. Ivanov. Rus. J. of Phys. Chem. B. 1, 588 (2007).
- (6) B. Hayes Proc. 4th Symp. on Det. White Oak, ACR-126, 595 (1965).
- (7) A. P. Ershov, N. P. Satonkina. Combust., Expl., Shock Waves 45, 205 (2009).
- (8) A. P. Ershov, N. P. Satonkina, 0. A. Dibirov, S. V. Tsykin, and Yu. V. Yanilkin. Combust., Expl., Shock Waves. 36, 639 (2000).
- (9) A. P. Ershov, N. P. Satonkina, Comb. and Flame. 157, 1022 (2010).
- (10) N. P. Satonkina, A. A. Safonov, J. of Eng. Thermophysics. 18, 177 (2009).
- (11) N. P. Satonkina, I. A. Rubtsov, Techn. Phys. 86, in the press (2016).
- (12) K. Tanaka, Detonation Properties of Condensed Explosives Computed Using the Kihara-Hikita-Tanaka Equation of State. National Chemical Laboratory for Industry, Tsukuba Research Center (1983).
- (13) N. P. Satonkina, A. P. Ershov, E. R. Pruuel, D. I. Karpov, Proc. XXIX Int. Conf. Physics of Extreme States of Matter (2014).
- (14) N. P. Satonkina, E. R. Pruuel, D. I. Karpov, Proc. XV Int. Det. Symp. (2014).
- (15) O. N. Breusov, Khim. Fiz. 21 (11), 110 (2002) [in Russian].
- (16) V.F. Anisichkin. Combust., Expl., Shock Waves. 30(5), 667 (1994).
- (17) V. F. Anisichkin. Combust., Expl., Shock Waves. 43, 580 (2007).
- (18) A. Chaudhary, J. O. Welch, and R. B. Jackman. Appl. Phys. Lett. 96, 242903 (2010).
- (19) V. N. Korobenko, A. I. Savvatimskiy and R. Cheret, Int. J. of Thermophysics. 20, 1247 (1999).
- (20) K. A. Ten, V. M. Aulchenko, L. A. Lukjanchikov, E. R. Pruuel, L. I. Shekhtman, B. P. Tolochko, I. L. Zhogin, V. V. Zhulanov, Nuclear Instr. and Meth. in Phys. Research A. 603, 102 (2009).
- (21) V. N. Korobenko, A. I. Savvatimskiy, Temperature: Its Measurement and Control in Science and Industry. New York. 7, 783 (2003).
- (22) N. P. Satonkina, E. R. Pruuel, A. P. Ershov, D. I. Karpov, V. V. Sil’vestrov, A. V. Plastinin, P. A. Savrovskii, J. of Engin. Thermophysics. 20, 315 (2011).
- (23) N. P. Satonkina, E. R. Pruuel, A. P. Ershov, V. V. Sil’vestrov, D. I. Karpov, A. V. Plastinin, Combust., Expl., Shock Waves. 51(3), 1 (2015).