VHE Analyses of Long-Term Low-Flux-State Observations by VERITAS of Intermediate-Frequency-Peaked BL Lacertae Sources: 3C 66A and W Comae
Abstract:
Intermediate-frequency-peaked BL Lacertae objects (IBLs) are a class of blazars characterized by a spectral energy distribution (SED) with a lower-energy synchrotron peak than the majority of extragalactic sources detected by ground-based imaging atmospheric Cherenkov telescopes (IACTs). Consequently, the peak gamma-ray flux falls outside the very-high-energy regime (VHE, ¿100 GeV) covered by IACTs such as VERITAS, making IBLs difficult to detect except during infrequent episodes of elevated flux. However, the study of these sources in a low-flux state is essential for developing a complete understanding of the blazar paradigm. We present the results of VHE analyses of long-term low-flux-state observations completed for two IBL sources: 3C 66A and W Comae. For both sources, data from VERITAS were analyzed for the VHE regime. The study of 3C 66A extends from 2007 to 2015, resulting in a 12 standard deviation () detection from 61 observing hours. Analysis of W Comae from 2010 to 2014, totaling 39 hours, resulted in a 6 low-flux-state detection. We report on the results from these VHE analyses and describe contemporaneous multiwavelength data to be used in further analyses. We comment on how these low-flux-state IBL detections fit within the context of the blazar paradigm.
1 Introduction
Blazars are a type of active galactic nuclei (AGN) with collimated relativistic jets, specifically ones where the jets are aligned with our line of sight. Blazars are some of the most energetic astrophysical objects in the Universe and are found observationally to have a characteristic two-peak spectral energy distribution (SED). The lower-frequency peak in photon flux is associated with synchrotron radiation resulting from relativistic electrons accelerating in strong magnetic fields. In leptonic models, the second peak is thought to be associated with the inverse-Compton (IC) effect, with the seed photons being provided by synchrotron radiation (synchrotron self-Compton, SSC), external photon fields (external Compton, EC), or some combination of the two e.g. [1].
Historically, blazars have been classified as one of two types based on spectral features: flat-spectrum radio quasars (FSRQs) or BL Lacertae objects (BL Lacs). FSRQs exhibit strong optical emission lines while BL Lacs generally appear to be featureless. FSRQs are generally thought to host more efficient accretion disks and stronger jets resulting in lower synchrotron peak frequencies (), while BL Lacs typically show weaker jets driven by inefficient accretion and cover a range of categorized accordingly: high-, intermediate-, or low-frequency-peaked BL Lacs (HBLs, IBLs, or LBLs) [2]. However, it has been argued that some of these distinctions are due to sample selection effects and the wide variety of blazar observables could be accommodated through association of BL Lacs and FSRQs with low-excitation (LERGs)/Fanaroff-Riley (FR) I and high-excitation (HERGs)/FR II radio galaxies [3, 4].
Thus, one of the outstanding problems within blazar observations is the seeming differentiation of blazars into sub-classes as a function of observables such as position of , the overall source luminosity and the dominance of the IC peak luminosity relative to the synchrotron peak (”Compton dominance”). These observables can be related to intrinsic physical properties of the system such as the maximum particle acceleration energy, the jet power or accretion mode and the relative fraction of the external photon fields to the seed photon density. The synchrotron peak is observed to fall in a range of frequencies covering nearly five orders of magnitude, from infrared to x-ray wavebands and empirically, the Compton dominance is anti-correlated with [2]. In the leptonic model paradigm, the FSRQ, LBL, IBL, HBL sequence requires a decreasing external photon field component to model the decreasing Compton dominance; FSRQ jets are in the most gas enriched environments requiring the highest EC component while HBLs are typically modeled satisfactorily with a simple SSC model requiring no EC component [5]. IBLs are transition objects and so far have been detected only in flaring states in which SED models have required an EC component [6]. If indeed, Compton dominance can be related to underlying physical observables of the blazar system, then it is important to understand how the system changes between a quiescent and flaring state.
Thus, to build a more robust understanding of the nature of blazars, it is essential to study these transition sources in greater depth. VERITAS has detected many HBLs, but IBL and LBL sources are particularly challenging for VHE observatories to detect outside infrequent periods of elevated flux. Since the two-peak SED shifts to lower frequencies for IBL/LBLs, the VHE regime falls beyond the inverse-Compton peak, leading to very limited observed flux. Therefore, these sources require long-term observations to be detected in a low-flux state. Although detections in high-flux states (flares) for these sources already exist, it cannot be assumed that IBLs will exhibit the same spectral behavior in a low-flux state; there is already ample evidence of spectral variability for HBLs between high- and low-flux states [7, 8]. In particular, it is important to ascertain whether the ”quiescent” or low-flux-state SED for IBLs requires an external photon field to appropriately model the IC peak. This information can be combined with other observables to yield a more comprehensive understanding of blazars overall.
These proceedings describe the results of the VHE analyses of long-term low-flux-state observations for two IBL sources: 3C 66A and W Comae. Section 2 provides a description of the VERITAS observatory and summarizes the past analyses of these two sources in both the high- and low-flux states. Section 3 describes highlights of the low-flux-state analysis of 3C 66A, and Section 4 details the analysis of W Comae, presenting a low-flux-state spectrum for this source for the first time ever. Finally, in Section 5 we offer our conclusions from the analyses thus far and describe future work to be done with these sources.
2 The VHE Detections of 3C 66A and W Comae
VERITAS is a ground-based array of four imaging atmospheric Cherenkov telescopes (IACTs) at the Fred Lawrence Whipple Observatory in southern Arizona. Each telescope is comprised of a segmented 12m primary mirror and a camera made of 499 photomultiplier tubes (PMTs). The VERITAS telescopes have a field of view and are optimized for the energy range 85 GeV - 30 TeV [9]. VERITAS was constructed in phases; the initial configuration of the four-telescope array (2007-2009), called the ”old array” (OA), was changed to the ”new array” (NA) in the fall of 2009 when one of the telescopes was relocated to a more optimal position for improved sensitivity. Prior to the fall of 2012, the PMTs were replaced, leading to the ”upgraded array” (UA), which is in current use. The sources discussed in these proceedings were observed at a 0.5 offset from the camera center for purposes of simultaneous background estimation [10]. For more details on VERITAS, see [11].
A VHE detection of 3C 66A () [12] was first reported by the Crimean Astrophysical Observatory in 1998 [13], and a detection of the source by VERITAS was first reported in 2008. During an elevated flux state observed for several days at the beginning of October 2008, the source reached over 8 significance, corresponding to an integral flux (100 GeV) that was 10% the flux of the Crab Nebula [14]. VERITAS first reported a low-flux-state detection (5.4) of 3C 66A in 17 hours of observations from January 2010 to June 2012 [15].
A detection of W Comae () was first reported in the VHE band by VERITAS after an elevated flux state in March 2008. During the two nights of highest activity, W Comae was observed at an integral flux (200 GeV) equivalent to 9% flux from the Crab Nebula [16]. Shortly after, in June 2008, W Comae was observed in an even higher flux state (see table 2), with integral flux (200 GeV) corresponding to 25% Crab [6]. VERITAS was also first to report a low-flux-state detection of W Comae (5.6) through analysis of 31 hours of data January 2010 to June 2012 [15]. In these proceedings, we extend the low-flux-state analyses for both 3C 66A and W Comae.
3 Highlights of 3C 66A Analysis
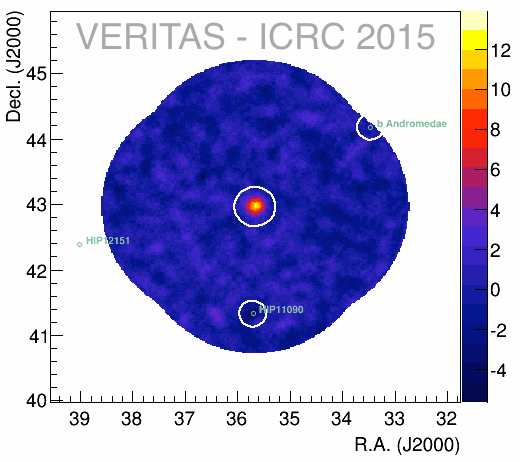
The most recent analysis of 3C 66A, using VERITAS observations from September 2007 to January 2015, consists of 61 hours (livetime) in a low-flux state and 6 hours (livetime) in a high-flux state, after data quality cuts to remove observations with poor weather or hardware issues. The high-flux state (October 2008 flare) was distinguished from the low-flux state by showing that the probability of randomly seeing an integral flux level significantly higher than the mean flux three days in a row is negligible. Analysis of this source utilized a combination of soft (200 GeV) and standard (200 GeV) cuts, determined by studying data from the Crab Nebula scaled to 10% flux as a toy model. Soft cuts allow for events of lower minimum size (as measured by digital counts) than the standard cuts and also use a larger angular region around the source to account for poorer angular resolution at this lowered threshold.
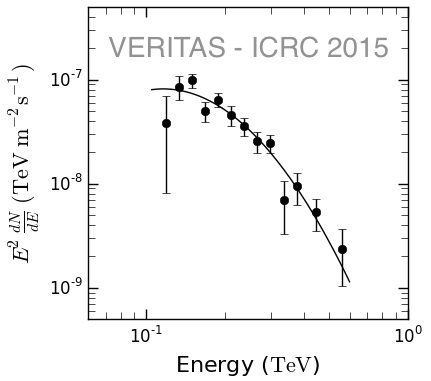
A position-based analysis of VERITAS observations has shown that the center of the excess is associated with 3C 66A, ruling out radio galaxy 3C 66B at 95% confidence. Analysis of the low-flux state resulted in a 12 detection. The photon spectrum for the low-flux state was found to be best fit with a log-parabola function of the form where C is the normalization constant, is the decorrelation energy, is the photon index, and is the curvature parameter. The decorrelation energy, TeV in this analysis, represents the energy at which the calculated flux is least affected by the choice of spectral index. See Table 1 for the other parameters and Figure 3(a) for the low-flux-state spectrum. Since a log-parabola model is preferred over a power law at 4.1, we conclude that there is significant curvature to the photon spectrum. From the results of the fits, we also note that the photon index and curvature parameter for the low- and high-flux states agree within statistical uncertainty, showing that there is currently no observable change of shape in the VHE spectrum between states. A more detailed description of the analysis of 3C 66A and conclusions drawn will appear in an upcoming publication from the VERITAS collaboration.
| 3C 66A | Expos. | Signif. | Normalization | Photon Index | Curvature | Integral flux |
|---|---|---|---|---|---|---|
| (hrs) | (m-2s-1TeV-1) | (m-2s-1) | ||||
| (a) Low | 61 | 12 | ||||
| (b) High | 6 | 13 |
4 Detailed VHE Analysis of W Comae in Low-Flux State
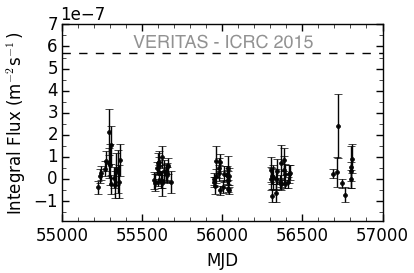
Beyond the previous low-flux-state detection of W Comae in 2012, this analysis includes two seasons of observations (2012/13 and 2013/14) from the upgraded VERITAS array, resulting in 39 hours of total livetime after data quality cuts. All observations by VERITAS of W Comae over the span of 2010-2014 are defined as the low-flux state, which was determined by comparing the integral flux of the high-flux state (June 2008 flare) to the daily light curve from 2010 to 2014 (see Figure 2(a)).
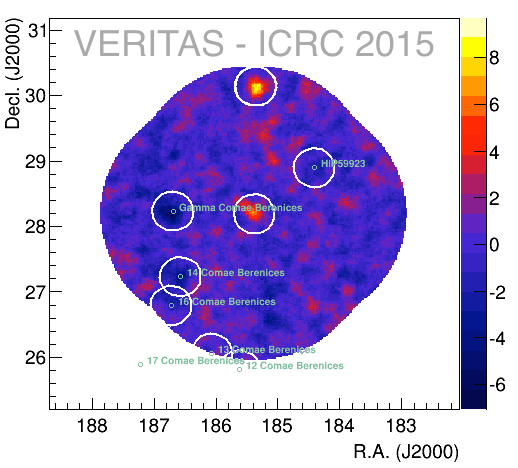
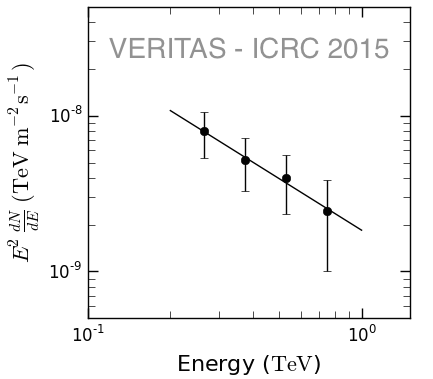
Two independent analyses of W Comae were performed using standard cuts and produced consistent results. The VHE significance map (Figure 1(b)) shows the VERITAS field a view in the vicinity of W Comae. A reflected region background model was used, where background is estimated from circular regions of equal size and at equal distance from the camera center as the source (0.5 offset) [10]. From this analysis, observations yielded 164 excess events ( and , average normalization factor ), resulting in a 6.2 detection and integral flux (200 GeV) of m-2s-1 from 39 hours of livetime. The first ever low-flux-state VHE spectrum of W Comae is presented in Figure 3(b).
| W Comae | Exposure | Significance | Normalization | Photon Index | Integral Flux |
|---|---|---|---|---|---|
| (hrs) | (m-2s-1TeV-1) | (m-2s-1) | |||
| (a) Low | 39 | 6 | |||
| (b) High | 4 | 10 |
The spectrum was fit with a power law model of the form , where is the normalization constant, is the decorrelation energy (TeV in this case), and is the photon index. The best fit of the data using this model results in m-2s-1TeV-1 and . We note that the value of the photon index in the low-flux state for W Comae is in agreement with the photon index for the June 2008 flare () [6] within statistical uncertainty, showing that we currently find no significant change in the spectral shape between states in the VHE waveband.
Future work with W Comae will continue to provide greater insight into the underlying physics behind IBL sources. This includes extending the analysis both within the VHE waveband and to other wavelengths. In the VHE waveband, we intend to integrate data from the old array (2007/08 and 2008/09 seasons) and also the most recent season of data from the upgraded array (2014/15). Analysis of the most recent season is already underway; our preliminary results show W Comae to be unusually faint in VHE during 2014/15.
In addition to continued work with VERITAS data, we are in the process of gathering publicly available multiwavelength data from radio to HE gamma rays for the purpose of constructing the full multi-band SED most representative of the low-flux state. In the HE regime, we have already begun an analysis of W Comae using data from the Fermi Large Area Telescope (LAT). As a Fermi source of interest, W Comae is one of many blazars also monitored by Swift in the x-ray through optical wavebands (Swift XRT and UVOT). Upon initial study, Swift public x-ray data shows a decline in integral flux over the course of the most recent season of VERITAS data (January-April 2015), matching our preliminary VHE results. Several optical observatories have long-term data on W Comae, including the Catalina Sky Survey, the FLWO 48” Telescope, and Tuorla, and a combination of these datasets will provide contemporaneous observations in the optical regime. In radio, W Comae is observed by the Owens Valley Radio Observatory (OVRO) at GHz approximately twice each week, and thus we expect there to be contemporaneous data with the VHE observations. We will continue to investigate this dataset and query other radio observatories for more data to include in a low-flux-state SED. Study of this full SED will provide insight into the spectral variability of W Comae between high- and low-flux states and also can lead to understanding of the intrinsic jet strength.
5 Conclusions
Through long-term, low-flux-state analyses of 3C 66A and W Comae, we contribute the VHE portion of a future SED for each of these IBL sources in their low-flux states. VERITAS observations of 3C 66A totaling 61 hours of live time in the low-flux state led to a 12 detection. A log-parabola model was found to better fit the spectrum than a power law model, showing significant curvature in the VHE spectrum. Observations of W Comae totaling 39 hours led to a 6.2 detection, allowing for a VHE spectrum in the low-flux state to be derived for the first time. We see no significant curvature in the VHE spectrum for W Comae, with the data being best fit to a power law model. For both sources, there is no significant difference in the spectral shape between the low- and high-flux states in VHE. Continued observations of these sources in a low-flux state will allow for greater resolution in the VHE spectra and better constrained parameters.
These results provide the initial step towards multiwavelength analyses. The VHE spectrum in combination with other wavelengths will define the shape and locations of both the synchrotron and inverse-Compton peaks, providing insight on the nature of IBLs in multiple ways. It has been shown that there is a shift in the SED of HBL sources during flaring states, and so we can determine whether this effect also exists for IBLs once a low-flux-state SED is produced. Furthermore, the relative luminosities of the synchrotron and inverse-Compton peaks can offer information on the strength of external photon fields, which could provide evidence for whether or not IBLs are driven by weak or strong jets. The study of IBLs as transition objects in synchrotron peak frequency provides an essential step towards developing greater understanding of the overall blazar paradigm.
Acknowledgements
This research is supported by grants from the U.S. Department of Energy Office of Science, the U.S. National Science Foundation and the Smithsonian Institution, and by NSERC in Canada. We acknowledge the excellent work of the technical support staff at the Fred Lawrence Whipple Observatory and at the collaborating institutions in the construction and operation of the instrument. The VERITAS Collaboration is grateful to Trevor Weekes for his seminal contributions and leadership in the field of VHE gamma-ray astrophysics, which made this study possible.
References
- [1] M. Böttcher, et al, Leptonic and Hadronic Modeling of Fermi-Detected Blazars, ApJ 768 (2013) 54, [arXiv:1304.0605].
- [2] A. A. Abdo, et al, The Spectral Energy Distribution of Fermi Bright Blazars, ApJ 716 (2010) 30, [arXiv:0912.2040].
- [3] P. Giommi, et al, Simultaneous Planck, Swift, and Fermi observations of X-ray, and -ray selected blazars, A&A 541 (2012) A160, [arXiv:1108.1114].
- [4] S. Buttiglione, et al, An optical spectroscopic survey of the 3CR sample of radio galaxies with z 0.3, A&A 509 (2010) A6, [arXiv:0911.0536].
- [5] M. Böttcher and C. D. Dermer, An Evolutionary Scenario for Blazar Unification, ApJ 564 (2002) 86, [arXiv:astro-ph/0106395].
- [6] V. A. Acciari, et al, Multiwavelength Observations of a TeV-flare from W Comae, ApJ 707 (2009) 612, [arXiv:0910.3750].
- [7] V. A. Acciari, et al, Spectral Energy Distribution of Markarian 501: Quiescent State vs. Extreme Outburst, ApJ 729 (2011) 2, [arXiv:1012.2200].
- [8] V. A. Acciari, et al, TeV and Multi-wavelength Observations of Mrk 421 in 2006-2008, ApJ 738 (2011) 25, [arXiv:1106.1210].
- [9] T. C. Weekes, et al, VERITAS: the Very Energetic Radiation Imaging Telescope Array System, Astropat. Phys. 17 (2002) 221, [arXiv:astro-ph/0108478].
- [10] M. K. Daniel, The VERITAS standard data analysis, in proceedings of 30th ICRC (2007), [arXiv:0709.4006].
- [11] D. B. Kieda, The Gamma Ray Detection sensitivity of the upgraded VERITAS Observatory, in proceedings of 33rd ICRC (2013), [arXiv:1308.4849].
- [12] A. Furniss, et al, On the Redshift of the Very High Energy Blazar 3C 66A, ApJ 766 (2013) 35, [arXiv:1302.2948].
- [13] Y. I. Neshpor, et al, Blazar 3C 66A: Another Extragalactic Source of Ultra-High-Energy Gamma-Ray Photons, AstL 24 (1998) 134.
- [14] S. Swordy, Discovery of 100 GeV Gamma-ray Emission from the Blazar 3C66A by VERITAS, ATel 1753 (2008).
- [15] T. Nelson, et al, VERITAS observations of low- and intermediate-frequency-peaked BL Lac objects, in proceedings of AIP 1505 (2012) 486.
- [16] V. A. Acciari, et al, VERITAS Discovery of 200 GeV Gamma-ray Emission from the Intermediate- frequency-peaked BL Lacertae Object W Comae, ApJ 684 (2008) L73, [arXiv:0808.0889].