Star formation in the Local Group as seen by low-mass stars
Abstract:
We have undertaken a systematic study of pre-main sequence (PMS) stars spanning a wide range of masses ( M⊙), metallicities ( Z⊙) and ages ( Myr). We have used the Hubble Space Telescope (HST) to identify and characterise a large sample of PMS objects in several star-forming regions in the Magellanic Clouds, namely 30 Dor and the SN 1987A field in the LMC, and NGC 346 and NGC 602 in the SMC, and have compared them to PMS stars in similar regions in the Milky Way, such as NGC 3603 and Trumpler 14, which we studied with the HST and Very Large Telescope (VLT).
We have developed a novel method that combines broad-band (, ) photometry with narrow-band imaging to determine the physical parameters (temperature, luminosity, age, mass and mass accretion rate) of more than 3000 bona-fide PMS stars still undergoing active mass accretion. This is presently the largest and most homogeneous sample of PMS objects with known physical properties and includes not only very young objects, but also PMS stars older than Myr that are approaching the main sequence (MS).
We find that the mass accretion rate scales roughly with the square root of the age, with the mass of the star to the power of 1.5, and with the inverse of the cube root of the metallicity. The mass accretion rates for stars of the same mass and age are thus systematically higher in the Magellanic Clouds than in the Milky Way. These results are bound to have important implications for, and constraints on our understanding of the star formation process.
Keywords: formation – stars: pre-main-sequence – open clusters and associations: general – Magellanic Clouds
1 Introduction
In the currently accepted star formation scenario (e.g. Lynden-Bell & Pringle 1974; Bertout 1989), low-mass stars grow over time through accretion of matter from a circumstellar disc. A reliable measurement of the rate at which mass is accreted onto PMS stars is of paramount importance for understanding the evolution of both the stars and their discs (Calvet et al. 2000). The formation of planetary systems is intimately connected with the properties of the circumstellar discs in which they are born (Wolf et al. 2012). In particular, the timescale of disc survival sets an upper limit on the timescale of planet formation, becoming a stringent constraint for planet formation theories (e.g. Haisch, Lada & Lada 2001). Therefore, it is particularly important to determine how the mass accretion rate varies with time as a star approaches the MS, how it depends on the mass of the forming star and how it is affected by the chemical composition and density of the parent molecular clouds or by the proximity of massive stars.
Observations of nearby star forming regions have reported that direct and indirect indicators of inner discs seem to disappear rapidly in the first few Myr of PMS evolution: both the fraction of young stars with infrared excess and those with evidence of disc accretion have been found to drop exponentially with the age of the stellar populations, with an e-folding time of Myr (Hernandez et al. 2007; Williams & Cieza 2011; Fedele et al. 2010). Concerning mass accretion, ground-based spectroscopic studies of nearby young star-forming regions (e.g. Taurus, Auriga, Ophiuchus; e.g. Sicilia–Aguilar et al. 2006) show that the mass accretion rate appears to decrease steadily with time, from about M⊙ yr-1 at ages of Myr for stars of about M⊙ to less than M⊙ yr-1 for the same stars at ages of Myr (e.g. Muzerolle et al. 2000; Sicilia–Aguilar et al. 2005; 2006; 2010). At face value this is in line with the expected evolution of viscous discs (Hartmann et al. 1998), even though the scatter of the data exceeds 2 dex at any given age (see also Figure 3), also because the observations cover a wide and sparsely populated mass range.
Extrapolating from these nearby results, one would be tempted to conclude that circumstellar discs are rather short lived and star formation is a rather quick process. Unfortunately, all the studies mentioned above address a very limited sample of star formation properties. All regions studied so far are nearby; they contain few stars, typically with masses of a few tenths of M⊙; they are not in dense environments; they do not contain massive stars, except for Orion; and they all have solar metallicity. Thus, these environments are not representative of massive starburst clusters, where possibly most stars form in galaxies. Nor are they characteristic of the conditions in place when most stars formed in the universe, at redshift (e.g. Madau et al. 1996; Lilly et al. 1996), when metallicity was about Z⊙. For this reason, it is important to study star formation in other places in our Galaxy, not only around the Sun but also in massive clusters, and also in nearby Galaxies, for instance the Magellanic Clouds (MCs). With a metallicity between Z⊙ and Z⊙, the MCs offer us an environment with the prevailing conditions at .
Of course, observing star-forming regions farther away than the solar neighbourhood introduces some practical problems, mostly due to angular resolution. For instance, while multi-object spectrographs at large ground based observatories are sensitive enough to give us good spectra of PMS stars in the MCs, atmospheric seeing makes these studies extremely difficult for all but the most massive PMS objects (e.g. Kalari et al. 2014). Alternatively, the the properties of circumstellar discs around PMS stars in the MCs can be studied with infrared space observatories such as Spitzer and Herschel (e.g. Seale et al. 2009; Carlson et al. 2011; Carlson et al. 2012; Meixner et al. 2013). However, also in this case angular resolution remains a problem and all sources detected in this way and classified as young stellar objects (YSOs) are in fact groups of YSOs or even small clusters and the properties of individual stars cannot be derived.
This investigation will benefit tremendously from the James Webb Space Telescope (JWST; Gardner et al. 2006) and in particular from NIRSpec, the multi-object spectrograph provided by the European Space Agency (Birkmann et al. 2014). NIRSpec will deliver simultaneous near-infrared spectra ( m) of up to PMS stars wherever located inside its field of view, with a spatial resolution equivalent to that of the HST at optical wavelengths (). The strength of the accretion process and mass accretion rates can be readily derived from the analysis of prominent recombination lines in the Paschen and Brackett series (e.g. Natta, Testi & Randich 2006).
Already now, however, there is a very efficient and powerful way to obtain this information, for hundreds of stars simultaneously, from photometry alone. Using the HST and VLT, in collaboration with a group of European colleagues (see Acknowledgments) we have started a study of the PMS phase in a number of star forming regions in the local group. These include NGC 3603 and Trumpler 14 in the Milky Way, 30 Doradus and surrounding regions in the Large Magellanic Cloud (LMC), and NGC 346 and NGC 602 in the Small Magellanic Cloud (SMC). In the following sections we describe the method and its application and present the most important results of this investigation so far.
2 The method
The method hinges on the fact that the spectra of PMS stars undergoing mass accretion have distinctive emission features, in particular strong emission in the line (equivalent width Å), due to the recombination of the gas that is shocked and ionised in the accretion process. Thanks to these features, we have shown that it is possible to efficiently and reliably identify all objects of this type in a stellar field, regardless of their age and of their position in the colour–magnitude diagram (CMD). Building on the work of Romaniello (1998), of Panagia et al. (2000), and of Romaniello et al. (2004), in De Marchi, Panagia & Romaniello (2010) and De Marchi et al. (2011a), we showed that a suitable combination of broad- and narrow-band photometry provides an accurate determination of the luminosity of these objects. From it, the accretion luminosity and mass accretion rate can easily be derived.
We look for the presence of an excess in the emission line by using a combination of broad-band (, ) and narrow-band () photometry. This way of identifying PMS stars is more reliable than the simple classification based on the position of the objects in the CMD or Hertzsprung–Russell (H–R) diagram and provides a secure detection of relatively old PMS stars, already close to the MS.
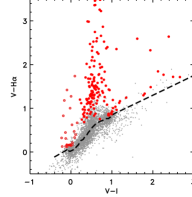
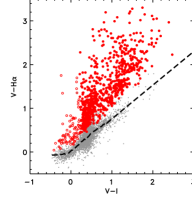
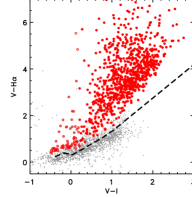
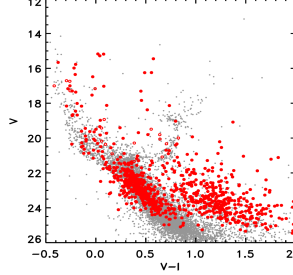
The virtue of this new method is that it derives the luminosity of the photospheric continuum of a star inside the specific band simply by interpolation from the average colour of stars with the same index (see Figure 1). As shown in De Marchi et al. (2010), the majority of stars in a typical stellar field have no excess emission. Therefore, the median value of the colour index at a given effective temperature defines a spectral reference template for all stars with that and can be used to identify objects with excess. Equipped with the knowledge of the continuum level in the band, we can easily determine the luminosity, , of each star.
The method and its applications are fully explained in a series of papers (De Marchi et al. 2010, 2011a, 2011b, 2011c, 2013a; Beccari et al. 2010; Spezzi et al. 2012; Beccari et al. 2015) and the accuracy of the continuum and derived in this way has been independently confirmed with spectroscopic measurements by Barentsen et al. (2011).
Some examples of how the method works are presented in Figure 1, where we show the run of the colour as a function of in three fields. From left to right, CMDs correspond to stars in the field around SN 1987A in the LMC, in the cluster NGC 346 in the SMC, and in NGC 3603 in the Galaxy. Stars with small photometric uncertainties (grey dots) define the reference template for normal stars (i.e. with no emission), shown as a dashed line (the lines are not the same in the three panels due to differences between the different HST cameras used for the observations). When emission is present in PMS stars, this results in a greater than average value of the colour. We conservatively take as PMS objects all stars with colour departing from the template line more than four times their photometric uncertainty (thick red dots). We have identified in this way more than 3 400 bona-fide PMS stars, in the three galaxies, still undergoing mass accretion. We are currently extending the sample with the addition of about 10 000 PMS objects (De Marchi, Panagia, Sabbi 2015, in preparation) revealed with our method in a region of centered on 30 Dor, observed as part of the Hubble Treasury Tarantula Survey (Sabbi et al. 2013).
3 Multiple generations
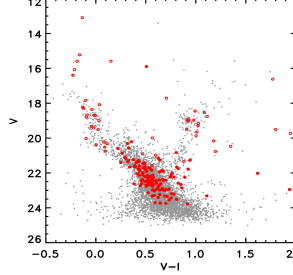
The method that we have developed to detect PMS stars in a stellar field allows us to identify all objects with an excess emission. This means that we are able to detect not only the most recent generation of T Tauri stars, whose colours are still dominated by the circumstellar discs, but also relatively “mature” PMS stars, already close to the MS. An example is shown in Figure 2, where all objects indicated by red dots are stars currently displaying excess emission due to the ongoing active mass accretion. Broad-band photometry alone could not distinguish the bluer objects (i.e. those near the MS) from normal MS stars, but the photometry allows us to securely identify them as still intrinsically young.
Comparison of the CMDs of Figure 2 with theoretical isochrones immediately suggests an older age for the bluer objects, typically older than Myr. There are, of course, some uncertainties on the ages derived through isochrone comparison: besides photometric errors and uncertainties in the input physics affecting the models, there are other physical effects that could cause an incorrect determination of the age (or mass) of individual objects. These include for instance unresolved binaries, differential reddening, stellar variability, veiling resulting from accretion, and scattering due to a disc seen at high inclination. All these effects can combine to produce a broadening in the CMD, which could be misinterpreted as an age spread (see e.g. Hennekemper et al. 2007 and Da Rio et al. 2010).
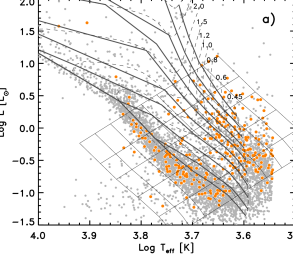
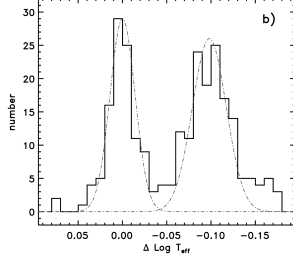
In fact, even though all the effects mentioned above could mimic an age spread, none of them can produce the clearly bimodal distribution that we observe in the CMDs. We show this in a quantitative way in Figure 3, containing in the left panel the H–R diagram of NGC 602 (De Marchi, Beccari & Panagia 2013). The remarkable paucity of PMS stars with age comprised between the 4 Myr and 16 Myr isochrones is quantified in the right panel, where we show the distribution of PMS stars as a function of the difference in their values. The distribution is obtained by counting the number of PMS stars in strips parallel to the zero-age MS, starting from the dot-dashed line, and it is clearly bimodal, with two peaks separated by several times their width. A Gaussian fit to the two peaks (dot-dashed lines in Figure 3b) gives dex for older PMS stars and dex for younger PMS stars. The separation between the two peaks ( dex) corresponds to respectively 5 and 4 times these widths and confirms that the two distributions are clearly distinct.
Physically, it is hard to imagine a mechanism that would affect the temperatures and luminosities of stars in such a way that they are selectively displaced from the region occupied by young PMS objects in the H–R diagram and moved towards the MS, while leaving only a handful of them in the region in between. Therefore, we can safely conclude that the two groups of stars with excess seen in the CMDs must belong to different generations, with ages that differ by much more than a factor of two and likely up to an order of magnitude.
Besides very different ages, the two populations of younger and older PMS stars shown in Figures 2 and 3 also have considerably different spatial density distributions. As an example, for NGC 602 we compare these distributions to one another in Figure 4 by means of contour lines of stellar density with logarithmic steps, overlaid on a true-colour image of the region. We have selected all stars younger than 5 Myr (cyan) and those older than 20 Myr (orange). The lowest contour level corresponds to a local density of PMS stars three times as high as the average PMS stars density over the entire field. The steps between contour levels are constant and corresponds to 0.3 dex. We also show with yellow dots the positions of the few stars (34 in total) with ages between 5 and 20 Myr.
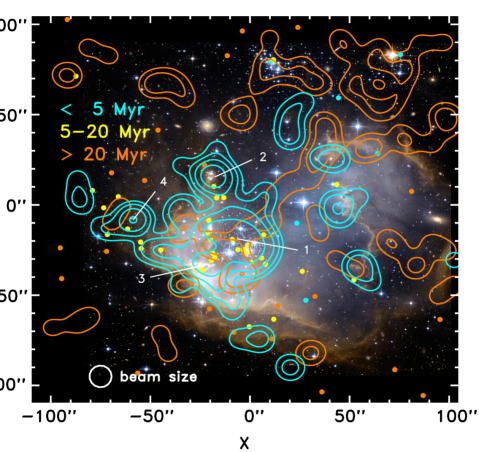
The spatial distribution of younger and older PMS stars are remarkably different: older objects are much more widely distributed and, except for the centre, they do not always overlap with the younger generation. This confirms that episodic accretion (e.g. Baraffe et al. 2009, 2010) is not at the origin of the bimodal distribution of PMS stars as seen in Figure 3, because the effects of episodic accretion could move stars from one side to the other of the CMD, but they cannot possibly move the stars across the sky! Hence we must conclude that there is a fundamental difference between the properties of bluer and redder PMS stars in the CMD, and their age is the difference. This finding is not limited to NGC 602, but is a common feature of all the star-forming regions that we have investigated so far in the three galaxies.
In summary, all regions that we studied in the Milky Way, LMC and SMC exhibit multiple recent episodes of star formation, indicating that star formation has proceeded over a long time, even though our age resolution cannot discriminate between an extended episode or short and frequent bursts. We also find that there is no correlation between the projected spatial distribution of young and old PMS stars and that the younger population is systematically more concentrated.
4 Evolution of the mass accretion rate
Using the complete set of multi-band HST photometry available for these objects, and through comparison with evolutionary tracks for the appropriate metallicities, we have determined their physical parameters, including temperature, luminosity, age, mass and mass accretion rate. This is presently the largest and most homogeneous sample of PMS objects with known physical properties.
A fundamental parameter that we can derive with this method is the mass accretion rate, . Since the energy released by the accretion process goes towards ionising and heating the circumstellar gas, the accretion luminosity can be derived from . With the mass and radius of each PMS star determined from the evolutionary tracks, the value of can be obtained from the free-fall equation, linking the luminosity released by the impact of the accretion flow with the rate of mass accretion, according to the relationship:
| (1) |
where is the gravitational constant, the mass of the star determined above, its photospheric radius coming from its luminosity and effective temperature, and the inner radius of the accretion disc. The value of is rather uncertain and depends on how exactly the accretion disc is coupled with the magnetic field of the star. Following Gullbring et al. (1998), we adopt for all PMS objects and with this assumption we have all the parameters needed to determine .
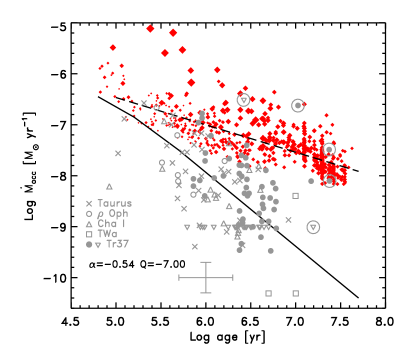
We find that older PMS stars have typically lower mass accretion rates, as shown for instance in the left panel of Figure 5 relative to the region of NGC 346 in the SMC. The long dashed line represents the best fit to the observed distribution of mass accretion rates and its slope () is rather similar to the one measured for stars of similar masses and ages in NGC 602 (; De Marchi et al. 2013).
On the other hand, both slopes are considerably shallower than the decline predicted by the models of Hartmann et al. (1998; see also Calvet et al. 2000; Muzerolle et al. 2000) for viscous disc evolution, represented here by the solid line. The latter appears to reproduce rather well the trend of decreasing with stellar age for low-mass Galactic T-Tauri stars as compiled by Sicilia–Aguilar et al. (2006). At first glance, this discrepancy could seem to imply a different evolution of the mass accretion rate for PMS stars in the Galaxy and in the SMC. However, before any meaningful comparison can be made the masses of the individual objects must be taken explicitly into account. In fact, there is a marked difference in the mass ranges covered by our observations and those in the compilation of Sicilia–Aguilar et al. (2006). The latter includes very-low mass nearby objects, typically a few tenths of M⊙, while our much more distant objects are typically more massive than M⊙.
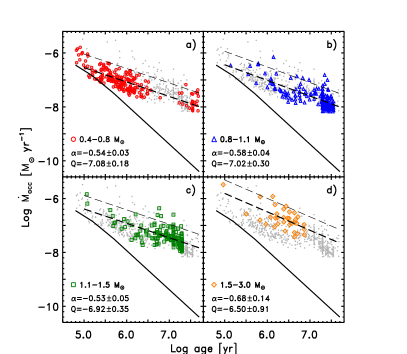
The large size of our sample of PMS stars allows us to study the mass dependence of in a robust way. We show this graphically for NGC 346 in the right-hand panel of Figure 5, where we have split our sample in four roughly equally populated mass groups, namely M⊙, M⊙, M⊙, and M⊙, and show for each one separately the run of as a function of age. Each panel gives the slope and intercept (at 1 Myr) of the best linear fit to the data (thick long-dashed lines), according to the relationship with the age in Myr. These values are in excellent agreement with those found in NGC 602 (De Marchi et al. 2013) in the same galaxy, as mentioned above.
The figure shows that all four mass groups have the same decline of with age (, thick dashed lines), but is higher for more massive stars (see value of intercept at 1 Myr). Although our method will inevitably miss some stars with weak excess emission, the upper envelopes of the distribution (thin dashed lines) appear to be fully consistent with the slope of the best fit.
Since our sample is quite rich, we can go a step further and perform a multivariate least-square fit to the observations to derive the simultaneous dependence of on both the stellar mass and age. We assume a relationship of the type:
| (2) |
where is the age in Myr, the mass in solar units and a constant, corresponding to the intercept at 1 Myr and 1 M⊙, (note that is similar to the parameter defined above, but it characterises the simultaneous fit on mass and age). The resulting best fit gives and , while for NGC 602 the same parameters are and , confirming a rather similar dependence on mass and age for SMC stars.
Our observations have already shown that, at a given mass or age, the mass accretion rate appears to be higher in the SMC than in the LMC, and in turn higher in the LMC than in the Galaxy, suggesting that the mass accretion rate could also depend on the metallicity of the star-forming regions. To explore the nature of this trend, it is necessary to understand whether a relationship exists between the parameter and metallicity. Indeed, is in practice an ”effective” mass accretion rate: inverting Equation 2 one sees that, as mentioned above, is the mass accretion rate of a star with mass 1 M⊙ and age 1 Myr.
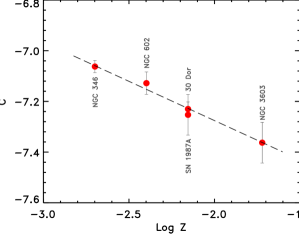
A preliminary comparison of NGC 346 and NGC 602 with the results that we obtain in the SN 1987A field (De Marchi et al. 2010; Spezzi et al. 2012), in 30 Dor (De Marchi et al. 2011c, and in preparation), of NGC 3603 (Beccari et al. 2010, and in preparation), and of Trumpler 14 (Beccari et al. 2015) shows that using approximate values of and still results in a satisfactory multivariate least-square fit. In other words, while the best-fitting relationship between mass accretion rate, stellar age and stellar mass for each individual region has different values of and , we can constrain these parameters to take on the values of and with still acceptably small residuals for all regions simultaneously. In this case, we can then look at the values of to explore the dependence of the mass accretion rate on the environment.
The resulting values of are shown in Figure 6 as a function of the metallicity of each region, showing a rather remarkable correlation. A simple linear fit suggests that . We can, therefore, rewrite Equation 2 in an approximate form as:
| (3) |
These results are necessarily still preliminary, since they are based primarily on observations obtained in dense regions of intense star formation. We have already secured HST observations of other more quiet and diffuse regions of star formation in all three these galaxies, in order to investigate how the properties of the environment affect the mass accretion process.
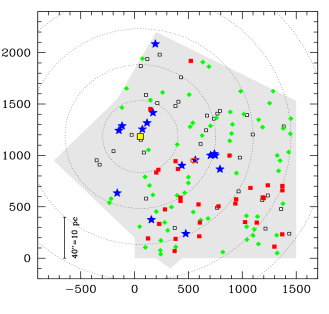
In fact, we have already traced the effects that nearby massive stars can have on the photoevaporation of circumstellar discs, even in the MCs. For instance, in the field of SN 1987A we find a clear anti-correlation between the frequency of Myr old PMS stars and their distance from the massive Myr old ionising objects in the field. This effect is not seen for non-PMS objects of similar brightness, confirming that the trend is not due to problems in detecting faint objects near the brightest stars. In Figure 7 we show a map of the distribution of all PMS objects with respect to the 15 ionising stars. An inspection to Figure 7 immediately reveals two important facts: (i) there are very few PMS stars near the barycentre of the massive objects and (ii) their luminosity is systematically lower than that of PMS stars farther away. This means that the discs of the stars near the barycentre of the ionising radiation are being eroded and the accretion process dwindles. This is a clear example of how the younger generation of massive stars can affect the late PMS evolution phases of somewhat older stars, right at the time when planets should start to form around them.
5 Conclusions
In summary, even though our analysis is still in progress, we can already draw some firm conclusions thanks to the very rich and homogeneous sample of PMS stars that we have put together.
It is clear that star formation is an ongoing process, since we see multiple generations of stars in all the fields that we have studied, separated by some 10 Myr. Interestingly, the younger generations are systematically more concentrated towards the center and the older generations are located farther out. No clear signs of “triggering” are present, although in most cases, the spatial density distribution of the older generations is consistent with an expansion velocity of some km s-1 (a typical value in Galactic star forming regions) for a period of the order of 10-15 Myr. Thus it is conceivable, although not necessary, that also the older generations formed in the same place as the more recent ones, some 10-15 Myr ago.
We find that the mass accretion rate scales roughly with the square root of the age and with the mass of the star to the power of . The physical conditions of the environment appear to have an effect on the extent and duration of the star formation process, since the mass accretion rate for stars of the same mass and age is systematically higher in the Magellanic Clouds than in the Milky Way, and in the SMC than in the LMC. The preliminary analysis that we have conducted so far to quantify this dependence indicates that metallicity has an important effect on the rate of mass accretion and that the mass accretion rate scales roughly with the inverse of the cube root of the metallicity. One possible explanation for the role of metallicity in the intensity and duration of the accretion process is that the lower radiation pressure exercised by the forming star on low-metallicity disc material is less efficient at dispersing the disc and thus the accretion process remains active for a longer time in lower-metallicity environments. If this finding is confirmed when we extend this study to a wider range of environments, also including regions of less active star formation, it could have profound implications for the formation of stars and planets in environments of low low-metallicity, such as those in place in the early Universe.
Acknowledgments We are indebted to our collaborators Martino Romaniello, Giacomo Beccari, Loredana Spezzi, Elena Sabbi, Pier Prada Moroni, Scilla Degl’Innocenti, Francesco Paresce, and Morten Andersen for participating in this study in the course of the years.
References
- [1] Baraffe, I., Chabrier, G., Gallardo, J. 2009, ApJ, 702, L27
- [2] Baraffe, I., Chabrier, G. 2010, A&A, 521, A44
- [3] Barentsen, G., Vink, J., Drew, J., et al. 2011, MNRAS, 415, 103
- [4] Beccari, G., Spezzi, L., De Marchi, G., et al. 2010, ApJ, 720, 1108
- [5] Beccari, G., De Marchi, G., Panagia, N., et al. 2015, A&A, 574, 44
- [6] Bertout, C. 1989, ARA&A, 27, 351
- [7] Birkmann, S., Ferruit, P., Alves de Oliveira, C., et al. 2014, SPIE, 9143, 914308
- [8] Calvet, N., Hartmann, L., Strom, E. 2000, in “Protostars and Planets”, eds V. Mannings, A. Boss, S. Russell (Tucson: University of Arizona Press), 377
- [9] Carlson, L., Sewilo, M., Meixner, M., et al. 2011, ApJ, 730, 78
- [10] Carlson, L., Sewilo, M., Meixner, M., Romita, K., Lawton, B. 2012, A&A, 542, A66
- [11] Da Rio, N., Robberto, M. 2012, AJ, 144, 176
- [12] De Marchi, G., Beccari, G, Panagia, N. 2013, ApJ, 775, 68
- [13] De Marchi, G., Panagia, N., Romaniello, M. 2010, ApJ, 715, 1
- [14] De Marchi, G., Panagia, N., Romaniello, M., et al. 2011a, ApJ, 740, 11
- [15] De Marchi, G., Panagia, N., Sabbi, E. 2011b, ApJ, 740, 10
- [16] De Marchi, G., Paresce, F., Panagia, N., et al. 2011c, ApJ, 739, 27
- [17] Fedele, D., van den Ancker, M., Henning, T., Jayawardhana, R., Oliveira, J. M. 2010, A&A, 510, A72
- [18] Gardner, J., Mather, J., Clampin, M., et al. 2006, SSRv, 123, 485
- [19] Gullbring, E., Hartmann, L., Briceño, C., Calvet, N. 1998, ApJ, 492, 323
- [20] Haisch, K., Lada, E., Lada, C. 2001, ApJ, 553, L153
- [21] Hartmann, L., Calvet, P., Gullbring, E., D’Alessio, P. 1998, ApJ, 495, 385
- [22] Hennekemper, E., Gouliermis, D., Henning, T., Brandner, W., Dolphin, A. 2008, ApJ, 672, 914
- [23] Hernandez, J., Hartmann, L., Megeath, T., et al. 2007, ApJ, 662, 1067
- [24] Kalari, V., Vink, L., Dufton, P., Evans, C., et al. 2014, A&A, 564, L7
- [25] Lilly, S., Le Fevre, O., Hammer, F., Crampton, D. 1996, ApJ, 460, L1
- [26] Madau, P., Ferguson, H., Dickinson, M., Giavalisco, M., et al. 1996, MNRAS, 283, 1388
- [27] Meixner, M., Panuzzo, P., Roman-Duval, J., et al. 2013, AJ, 146, 62
- [28] Muzerolle, J., Calvet, N., Briceño, C., Hartmann, L., Hillenbrand, L. 2000, ApJ, 535, L47
- [29] Natta, A., Testi, L., Randich, S. 2006, A&A, 452, 245
- [30] Panagia, N., Romaniello, M., Scuderi, S., Kirshner, R. 2000, ApJ, 539, 197
- [31] Romaniello, M. 1998, PhD thesis, Scuola Normale Superiore, Pisa, Italy
- [32] Romaniello, M., Robberto, M., Panagia, N. 2004, ApJ, 608, 220
- [33] Sabbi, E., Anderson, J., Lennon, D., van der Marel, R., et al. 2013, AJ, 146, 53
- [34] Seale, J., Looney, L., Chu, Y.-H., et al. 2009, ApJ, 699, 150
- [35] Sicilia-Aguilar, A., Hartmann, L., Hernandez, J., Briceño, C., Calvet, N. 2005, AJ, 130, 188
- [36] Sicilia–Aguilar, A., Hartmann, L., Furesz, G., et al. 2006, AJ, 132, 2135
- [37] Sicilia-Aguilar, A., Henning, T., Hartmann, L. 2010, ApJ, 710, 597
- [38] Spezzi, L., De Marchi, G., Panagia, N., et al. 2012, MNRAS, 421, 67
- [39] Williams, J., Cieza, L. 2011, ARA&A, 49, 67
- [40] Wolf, S., Malbet, F., Alexander, R., et al. 2012, A&ARv, 20, 52
DISCUSSION
BORIS SHUSTOV: Evaporation is an important factor limiting the final mass of stars not only at the stage of the circumstellar disc. It works earlier even in a more dramatic mode. When a dense protostellar (starless) core is starting to be exposed to UV radiation from nearby stars, or just to interstellar fields of UV photons, its outer layer will evaporate, while the inner part will be stimulated to form a young star by radiatively driven collapse. So the final mass of the star or even its existence is the result of the competition between these two processes.
GUIDO DE MARCHI: Our observations at optical and near infrared wavelengths do not probe the earliest stages of star formation, since for those you would need the wavelength range offered by Herschel and particularly by Alma, which has the resolution needed to study in detail nearby star-forming regions. However, we clearly see the effects of the discs disruption due to photoevaporation at various stages of the PMS phase. Besides the example in the SN 1987A field that I showed before (see Figure 7), we also see the effects of photoevaporation at play in the massive cluster 30 Dor (as illustrated in Figure 12 of De Marchi et al. 2011c). Also there we have a conspicuous population of older PMS stars, with ages of about 15 – 20 Myr, but the situation is much more complex than in the field of SN 1987A: not only are there also other generations of PMS stars, but there is also a lot of gas in this region, much more than around SN 1987A, some of which is cold molecular Hydrogen. What our observations show is that the stars with lowest are preferentially in regions of lower gas density, while the stars with higher , are in denser regions. This suggests that the densest clouds are shielding these objects from the ionising radiation of the stars at the centre, while the discs of objects in less dense regions are at higher risk of evaporation. Thus, precisely as you said, the final mass of these stars is the result of the competition between many different processes that are at play simultaneously.