An Updated Ultraviolet Catalog of GALEX Nearby Galaxies
Abstract
The ultraviolet catalog of nearby galaxies made by Gil de Paz et al. (2007) presents the integrated photometry and surface brightness profiles for 1034 nearby galaxies observed by Galaxy Evolution Explorer (GALEX). We provide an updated catalog of 4138 nearby galaxies based on the latest Genral Release (GR6/GR7) of GALEX. These galaxies are selected from HyperLeda with apparent diameter larger than 1′. From the surface brightness profiles accurately measured with the deep NUV and FUV images, we have calculated asymptotic magnitudes, aperture (D25) magnitudes, colors, structural parameters (effective radii and concentration indices), luminosities, and effective surface brightness. Archival optical and infrared photometry from HyperLeda, 2MASS, and IRAS are also integrated into the catalog. Our parameter measurements and some analyses are consistent with those of Gil de Paz et al. (2007). The (FUV ) color provides a good criterion to distinguish early and late-type galaxies, which can be improved further with the concentration indices. The IRX- relation is reformulated with our UV-selected nearby galaxies.
1 INTRODUCTION
Nearby galaxies (z 0.1) are characterized by large angular scale and high apparent brightness, which can be studied in more details and with higher accuracy than high-redshift galaxies. For nearby galaxies, the ultraviolet (UV) imaging provides unique information. Massive, young stars emit strong UV energy, which dominates the integrated UV light of star-forming galaxies. Thus, the UV flux is widely used as an excellent and accurate measurement of the current star formation rate (SFR; Wilkins et al. 2012; Kennicutt 1998; Lanz Lauranne 2013). In addition, the interstellar dust can absorb the UV light and then re-emit at far-infrared wavelength. The comparison between infrared and UV emission can effectively trace the dust attenuation in galaxies. Radiative transfer models suggest that the ratio of far-infrared to UV luminosity is a reliable estimator of the dust attenuation (Buat & Xu, 1996; Witt & Gordon, 2000; Panuzzo et al., 2003), depending weakly on the geometry of stars and dust, the extinction law, and the stellar population.
The UV galaxy samples in the local universe are important for understanding the evolution of galaxies with cosmic time (Bouwens et al., 2012; Reddy et al., 2012; Ellis et al., 2013; Martin et al., 2005). There have been considerable attempts to explore the SFR, morphology, dust attenuation, and their evolutions by constructing UV-selected local galaxies (Sullivan et al., 2004; Calzetti et al., 1994; Buat et al., 2002; Kuchinski et al., 2000; Marcum et al., 2001; Lauger et al., 2005).
Based on GALEX Public Release 2 and 3 (GR2/GR3), Gil de Paz et al. (2007) (hereafter GALEX Atlas) presented a UV catalog of 1034 nearby galaxies selected from the Third Reference Catalog of Bright Galaxies (RC3; de Vaucouleurs 1991). They selected those galaxies whose optical diameters of the mag arcsec-2 isophote (D25) are larger than 1′. The FUV and NUV images were mainly taken from GALEX Nearby Galaxies Survey (NGS). From the surface brightness profiles, they obtained asymptotic magnitudes, colors, and concentration indices. In combination with archival optical and infrared data, they analyzed the color-magnitude and color-color diagrams, relations between colors and morphologies, IRX relation, dust attenuation, and structural properties for different types of galaxies.
In February 2013, GALEX GR7 data was available. It includes more than 45000 images, almost three times larger than GR2/GR3. With deeper observations (up to 250 kilo-second), it is now possible to create a relative complete UV sample of nearby galaxies. In this work, we provide an updated UV catalog of nearby galaxies with deepest FUV and NUV images from GR6/GR7, archival optical and infrared photometry, and make some similar analysis to Gil de Paz et al. (2007).
In Section 2, we present our sample selection of nearby galaxies. In Section 3, the method of measuring the surface brightness profile is described in detail. The catalog content including the UV parameters and other archival data are described in Section 4. The parameter comparison of our catalog with GALEX Altas is shown in Section 5. Section 6 presents some analyses and application examples of our catalog. The summary is in Section 7. All magnitudes presented in the paper are corrected for the Galactic extinction using the Galactic Reddening Map of Schlegel et al. (1998). We use the reddening law of Cardelli et al. (1989) to convert to the UV extinction: and .
2 Sample Selection
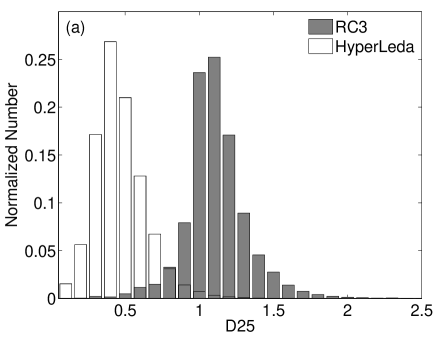
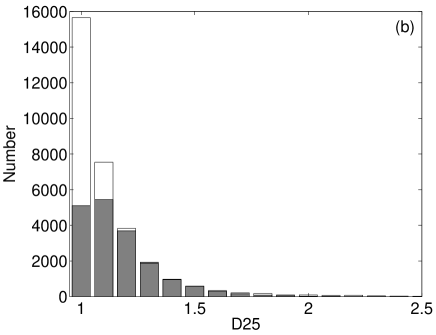
The nearby galaxies in this paper are extracted from HyperLeda 111http://leda.univ-lyon1.fr,revisedin2013July1 (Paturel et al., 2003; Makarov et al., 2014). HyperLeda is a catalog of extragalactic sources, which gives accurate coordinates of objects (typical accuracy better than 2), morphological parameters (e.g. size, axis ratio, position angle, morphogical type, etc.), and astrophysical parameters (optical magnitudes and colors, surface brightness, distance, kinematic quantities, etc.). It includes 3.7 million galaxies, much more than RC3 as used by Gil de Paz et al. (2007). The catalog provides Doppler distances for 20314 galaxies and redshift-independent distances for 2013 galaxies. Figure 1a shows the distributions of major-axis diameters in both HyperLeda and RC3 catalogs, while Figure 1b presents the same distributions but with D25 . The majority of HyperLeda galaxies have diameters less than 1′, and over 99% RC3 galaxies are included in HyperLeda. The HyperLeda galaxies with diameters above 1′ are more than those of RC3 by a factor of 3.
We adopt the same criterion of optical diameters as Gil de Paz et al. (2007) used, that is, D25 is larger than 1. There are 22948 galaxies satisfying this constraint. We retrieve FUV and NUV images for these galaxies from GALEX GR6/GR7 to obtain their intensity maps. Three imaging surveys are involved: Medium Imaging Survey (MIS), Nearby Galaxy Survey (NGS), and Deep Imaging Survey (DIS). We require the galaxies (1.5 D25) to be fully covered by the GALEX field of view (FoV; 1.2° in diameter). Those galaxies with low signal-to-noise ratio or contaminated by surrounding galaxies and bright stars are excluded. The optical diameter D25 of M31 is about 3.0°, far beyond the GALEX FoV. We obtain 26 tiles of M31 in FUV and NUV from NGS and DIS, which are stacked to form very deep mosaics by Montage222http://montage.ipac.caltech.edu/. The final sample contains 4138 galaxies, 2321 of which have both FUV and NUV observations. There are 14 and 1803 galaxies having only FUV and NUV observations, respectively.
We present their basic parameters given by HypeLeda in Table 1, including the positions, sizes, morphological types and distances. For galaxies whose distances are not available, we get their distances from NED (the NASA/IPAC Extragalactic Database). There are 4047 galaxies with either luminosity distances or redshift-dependent distances.
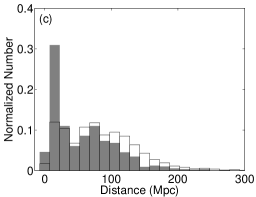
Figure 2 shows the normalized distributions of D25 diameter, morphological type, and distance in GALEX Atlas and our sample. By contrast, our sample gives more galaxies with smaller diameters, earlier types, and larger distances.
3 Surface Brightness Measurement
GALEX provides sky background subtracted images, but the background near the galactic center is overestimated, especially for galaxies with large apparent sizes. We introduce a new procedure to better estimate the sky background, which is quite similar to the method in Zou et al. (2011). SExtractor (Bertin & Arnouts, 1996) is used to separate source pixels from background pixels. The source pixels, together with the region with the galactocentric distance D25, are masked. Then, the remaining pixels are fitted with a two dimensional polynomial function to generate the background map. Finally, the fitted map is subtracted from the intensity image.
Foreground stars contaminate the galaxy flux and need to be masked in the intensity map. We get the point sources (mostly stars) within the image from GALEX photometric catalogs. The mask aperture is determined by the growth curve, where the corresponding aperture magnitude is close to the total magnitude presented in the catalog. However, the catalogued point sources might include some star formation regions, whose UV color is much bluer than normal stars. Since the number of star formation regions is strongly dependent on the galaxy type, we separate our entire sample into two subsamples according to the morphological type: one with T 0.5 identified as spiral/irregular galaxies (types from to ) and the other with T 0.5 identified as elliptical/lenticular galaxies (types from to ). For early-type galaxies, all point sources detected by GALEX are regarded as foreground stars and masked. For late-type galaxies, we only mask the point sources with (FUV NUV) 1, and keep bluer point sources with (FUV NUV) 1 as star forming regions. The nuclei of galaxies, also point-like, are not masked. For galaxies with single UV-band observations, we define foreground stars by visually inspecting both the UV image and the color image of the Digitized Sky Survey.
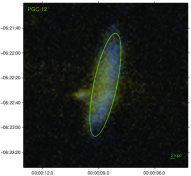
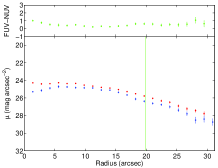
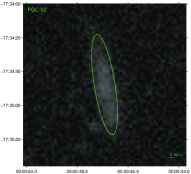
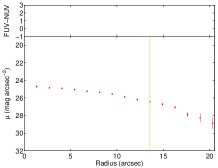
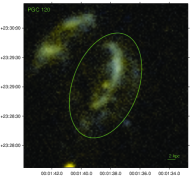
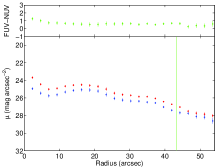
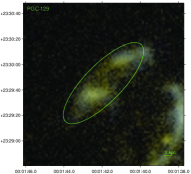
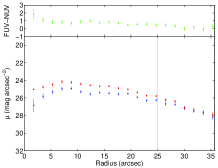
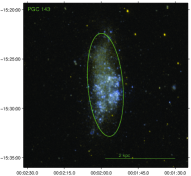
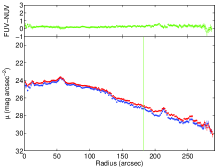
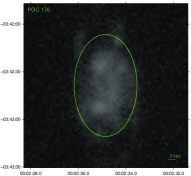
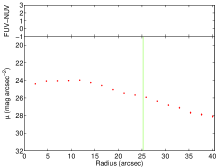
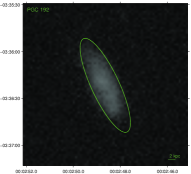
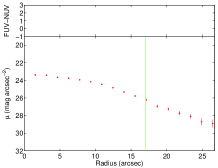
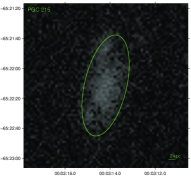
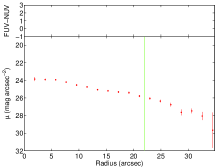
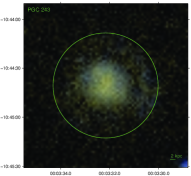
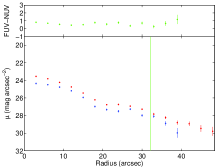
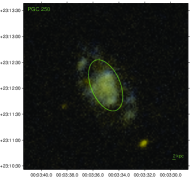
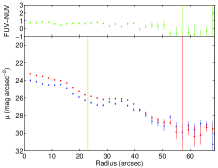
We then use the MATLAB package of astronomy and astrophysics for the measurement (Ofek, 2014). The radial surface brightness profile is computed with a series of elliptical annuli, whose major radii range from 3 to at least 1.5 times the D25 radius. The brightness errors are estimated with the method in Gil de Paz & Madore (2005). Figure 3 shows some examples of the false color images and surface brightness profiles of galaxies in our sample. The radial (FUV NUV) color profile is also plotted.
4 The Catalog Content
4.1 Asymptotic and D25 Magnitudes
We adopt the technique introduced by Cairós et al. (2001) to calculate the asymptotic magnitudes. First, the accumulated flux and the gradient of the growth curve at each radius are computed. Then, an appropriate radial range away from the galaxy center is visually chosen, where an error-weighted linear fit to the relation of accumulated flux vs. the gradient of the growth curve is performed. Finally, the intercept of this linear fit is regarded as the asymptotic magnitude, and corresponding magnitude error is derived from the error of the linear fit.
We also calculate the aperture magnitudes inside the D25 ellipses. The errors are estimated from the random noise inside the apertures and the uncertainties of the sky background subtraction (see Gil de Paz & Madore 2005). All the errors do not include the uncertainty of NUV and FUV photometric zeropoints, which are about 0.15 and 0.09 mag, respectively.
4.2 Effective surface brightness and concentration indices
4.3 Archival optical and infrared data
Multi-wavelength data of nearby galaxies could improve our understanding of their physical nature. We add some corollary data from other optical and infrared surveys into our catalog. HyperLeda provides the total magnitude ( ) and the total magnitude (). A total of 4064 galaxies have magnitudes and 3265 galaxies have magnitudes. There are 640 and 813 galaxies in our sample with and colors, respectively. In near infrared (NIR), we compile -band photometry from the 2MASS Large Galaxy Atlas (LGA) (Jarrett et al., 2003). If galaxies are unavailable in LGA, photometry in 2MASS Extended Source Catalog (XSC) are used. A total of 3708 galaxies have magnitudes. In mid and far infrared (MIR and FIR), the photometry in 12m, 25m, 60m and 100m are obtained from Infrared Astronomical Satellite (IRAS). We follow the priority given by Gil de Paz et al. (2007) to compile the photometry (Rice et al. 1988; Moshir & et al. 1990 and the Point Source Catalog). The 60m and 100m are used to estimate the far infrared emission. There are 1570 galaxies with infrared fluxes in both 60m and 100m. The UV properties and archival optical and IR data are presented in presented in Table 2 and Table 3, respectively.
5 Comparison with GALEX Atlas
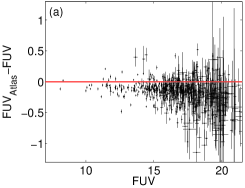
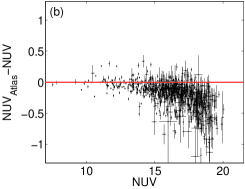
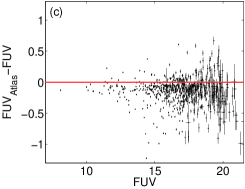
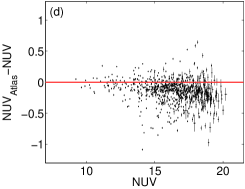
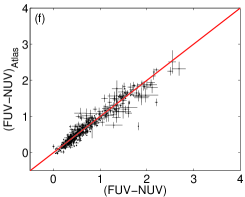
We show the photometric comparisons between GALEX Atlas and our sample in Figure 4. Figure 4a–d display the differences of asymptotic and aperture magnitudes between our catalog and GALEX Atlas. There are 94% and 93% galaxies in the FUV and NUV with the difference of asymptotic magnitudes within 0.5 mag. We check the galaxies with differences larger than 0.5 mag and find that these differences might be caused by the different sky-background estimation and elliptical parameters inherited from their parent catalogues. We fit a sky background map for each galaxy, while GALEX Atlas only use a single background value. For example, the average background of PGC 4085 (ESO 243-G041) given by GALEX Atlas is 5.59 10-4 counts s-1 in the NUV, while the average value of our computed background is 2.24 10-3 counts s-1, which leads to the magnitude difference of 0.59. After checking the intensity image, our fitted background is more reasonable, since the flux of no-signal area around the galaxies is about 2 10-3 counts s-1. There are many galaxies in GALEX Atlas and our sample with different axis ratios and D25 diameters. When galaxies become fainter, the difference of the axis ratios can reach a factor of 9, which leads to different growth curves and results in different magnitudes. For example, the axis ratio of PGC 4190 (NGC 0407) given by HyperLeda is 6.9, while GALEX Atlas gives 4.3. These differences lead to the different magnitudes between GALEX Atlas and our sample.
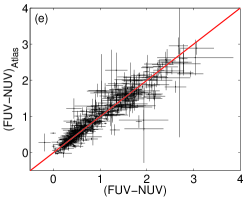
Figure 4e and f show the differences between the (FUV-NUV) colors of asymptotic and aperture magnitudes. The colors of our sample is consistent with those in the catalogues of GALEX Atlas with standard deviations of 0.19 and 0.13 for asymptotic and aperture colors, respectively.
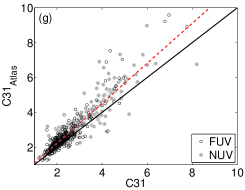
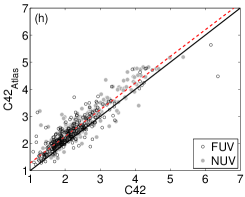
The differences of the concentration indices for the two samples are displayed in Figure 4g and h. The concentration indices in both FUV and NUV of our samples are on average smaller than those in GALEX Atlas, probably due to the differences of the growth curves.
6 Analyses and Some Applications
6.1 UV Properties of the galaxies
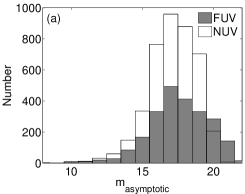
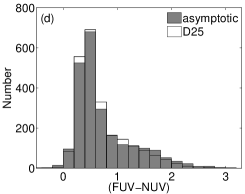
Figure 5 shows the distributions of UV properties of the galaxies in our catalog. Figure 5a-g presents the histograms of asymptotic magnitudes, morphological type, luminosities, (FUV NUV) colors, effective radii, and concentration indices. The median asymptotic magnitudes in FUV and NUV are 17.55 and 17.20 mag, respectively. In our sample, about 5 galaxies show asymptotic magnitudes larger than D25 magnitudes. For these galaxies, the diameters corresponding to asymptotic magnitudes are smaller than the D25 diameters due to the lack of diffuse emission. The residual flux after background subtraction within D25 ellipses leads to additional UV flux in the D25 magnitudes.
There are 1030 (25%) and 2899 (70%) early and late-type galaxies (Figure 5b), and 209 (5%) galaxies without morphological types given by HyperLeda. Figure 5c presents the luminosity distributions . The median FUV and NUV luminosities are 7.8 108 and 9.1 108 (3.0 1035 and 3.5 1035 W), respectively. Ten galaxies in our catalog are ultraviolet-luminous galaxies (UVLGs; Heckman et al. 2005) defined as the FUV luminosity larger than 21010 ( W), which are extremely rare in the local universe. Among the ten galaxies, PGC 2248, 36466, 59214 have been identified by GALEX Atlas. PGC 53898 and 71035 are Seyfert galaxies (Véron-Cetty & Véron, 2006). PGC 4007 and 17625 are a luminous infrared galaxies (LIRG; Haan et al. 2011; Sanders et al. 2003). The other three galaxies, PGC 23064, 30400, and 51865, are star-forming spiral galaxies with very UV-luminous arms. PGC 70348 (NGC 7469) is defined as a UVLG in GALEX Atlas but not qualified in our sample. Our FUV luminosity of this galaxy is about 7.31036 W , close to the threshold.
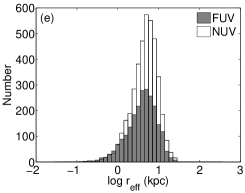
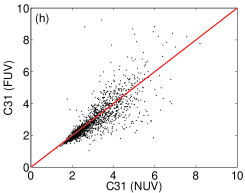
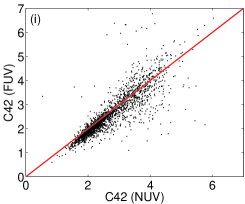
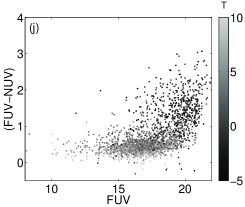
Figure 5d presents the color distributions of asymptotic and D25 magnitudes. The majority of galaxies has color bluer than (FUV NUV) = 1, which has been used to separate foreground stars. The red tail of the distributions is populated by early-type galaxies. The distributions of effective radii in kiloparsecs are shown in Figure 5e. The median effective radii for FUV and NUV are 4.3 and 5.0 kpc, respectively. The distributions and comparisons of concentration indices are presented in Figure 5f-i. The galaxies are on average slightly more concentrated in the NUV than in the FUV by differences of 0.03 in C31 and 0.10 in C42, which may be due to the different fractions of the bulge component in spiral galaxies in these two bands (Gil de Paz et al., 2007). Figure 5j shows the color as a function of the FUV magnitude. The late-type galaxies are brighter and located in a narrow color range, while the early-type galaxies are fainter and distributed with broader and redder color span.
6.2 Effective Surface Brightness
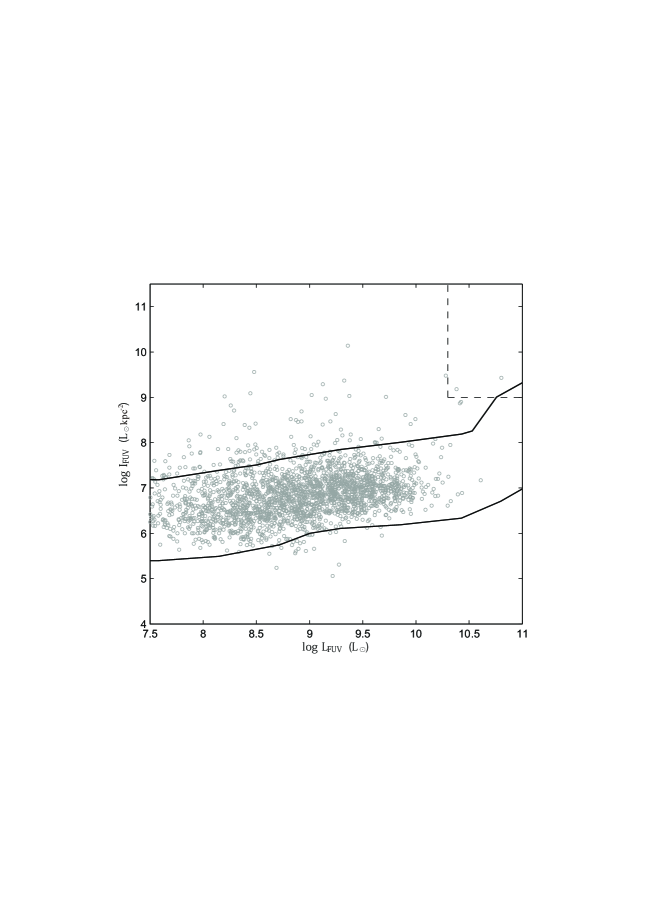
The plot of effective surface brightness versus the FUV luminosity is presented in Figure 6. This figure shows a trend of slight increasing effective surface brightness with increasing luminosity, indicating that galaxies with large effective radii turn to be more luminous (Hoopes et al., 2007). The effective surface brightness distribution of our sample is more concentrated than Hoopes et al. (2007) sample, since the contours in Figure 6 enclose 96% of the galaxies in our sample but only 84% in their sample.
The compact UVLGs are UVLGs defined with a surface brightness 109 kpc-2 (Hoopes et al., 2007). They have characteristics that are remarkably similar to the Lyman break galaxies (LBGs), such as SFRs, metallicities, morphologies, kinematics, and attenuations (Hoopes et al., 2007; Overzier et al., 2008; Basu-Zych et al., 2007). Only 12 galaxies in our sample have the surface brightness 109 kpc-2. Two of them, PGC 59214 and PGC 71035, have both high luminosity and high surface brightness, which can be classified as compact UVLGs. PGC 59214 is a BL Lac object and PGC 71035 is a Seyfert 1.5 (Véron-Cetty & Véron, 2006). Both of them have very compact nuclei in the FUV, and the optically thick accretion disks around super-mass black holes probably dominates their FUV luminosity (Malkan &Sargent, 1982; Ward et al., 1987; Sanders et al., 1989).
6.3 (FUV ) tracing galactic morphology
Compared to the optical colors (Weiner et al., 2005; Pozzetti et al., 2010; Talia et al., 2014), the combination of UV and IR should be more efficient in separating the early and late-type galaxies, given their different SFRs and dust attenuation (Gil de Paz et al., 2007). Since the UV emission is very sensitive to the presence of recent star formation activity and the band emission is sensitive to the accumulated star formation (Muñoz-Mateos et al., 2007), the (FUV ) color provides a robust discrimination between early and late-type galaxies as analyzed by Gil de Paz et al. (2007).
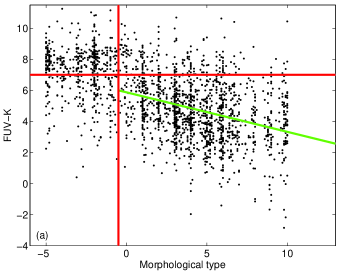
Figure 7a shows the relation between (FUV ) color and galactic morphology. Here we convert the 2MASS band Vega magnitudes to the AB system by adding 1.84 mag (Muñoz-Mateos et al., 2009; Cohen et al., 2003). We calculate the dividing (FUV ) color to separate early and late-type galaxies by minimizing the number of galaxies that are misclassified by the dividing magnitude, which leads to (FUV ) = 6.84. About 68% early-type galaxies and 86% late-type galaxies are correctly classified. The (FUV ) is linearly correlated to the morphology of late-type galaxies. The best linear fit to the relation (green line in Figures 7) is
| (1) |
Here T is the morphological type given by HyperLeda and the errors of the parameters are derived from the linear fitting.
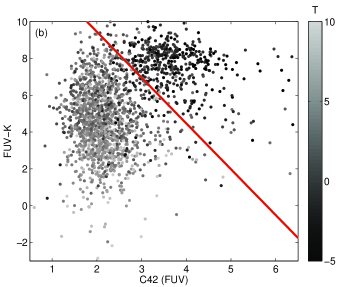
The concentration indices have also been used as a classification tool (Abraham et al., 1996; Bershady et al., 2000). The (FUV) color together with concentration indices are expected to show better separation of different type galaxies, which is discussed in Gil de Paz et al. (2007). We present the FUV concentration index C42 as a function of the (FUV ) color in Figure 7b. Early-type galaxies have larger C42 and redder (FUV ). The best separation line in the plane of this figure is computed as
| (2) |
With this, 76% and 94% of early and late-type galaxies are correctly classified.
6.4 IRX- relation
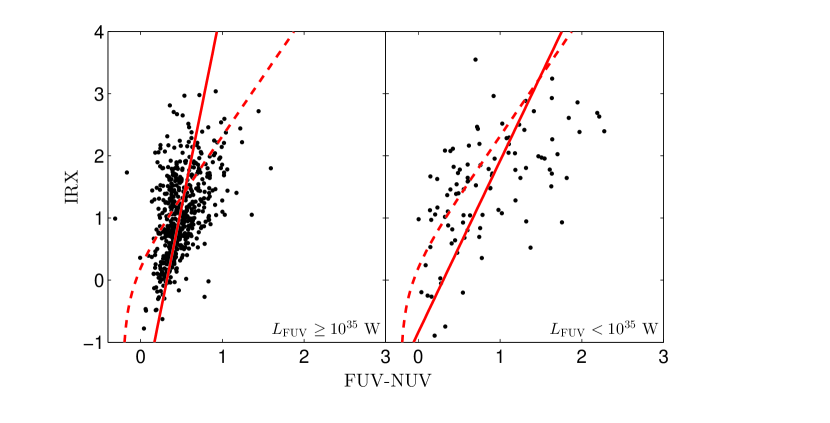
The IR excess (IRX) is widely used as a good tracer of the dust attenuation in galaxies, and the slope of the UV continuum () is considered as a proxy to estimate the IRX when IR data are not available, which is known as IRX- relation (Daddi et al., 2007; Reddy & Steidel, 2009; Takeuchi et al., 2010). IRX is defined as log(), where is the total infrared flux, and can be estimated by (FUV NUV). Here, the IRX- relation is not valid for early-type galaxies, since a substantial part of dust heating is due to photons emitted by old stars which do not emit primarily in UV and the dust attenuation would be overestimated by IRX (Buat et al., 2011).
Figure 8 shows the (FUV NUV) color against IRX for our late-type galaxies together with the local starburst relation derived from Meurer et al. (1999). Here we define and adopt the formula proposed by Sanders & Mirabel (1996) to derive the , which is estimated using the 12, 25, 60 and 100 m from IRAS data. We separate our galaxies into two groups according to their FUV luminosities. In Figure 8, we can see that most of our galaxies are located below the relation of Meurer et al. (1999). The galaxies with brighter FUV luminosities () have a tigher relation than that of fainter galaxies. Both groups have steeper IRX relations than that of Meurer et al. (1999). We linearly fit the relations of these two groups, which are formulated as
| (3) |
| (4) |
7 SUMMARY
In this paper, we provide an updated catalog of 4138 nearby galaxies based on the latest (GR6/GR7) of GALEX, which is more than 3 times the number of galaxies in the original GALEX Atlas. Our samples are selected from the extragalactic catalog of HyperLinda. The D25 diameter is set to be larger than 1′. Compared with GALEX Atlas, we apply a more precise procedure to estimate the sky background in the GALEX images. Radial FUV and NUV surface brightness profiles are obtained. From these profiles we calculate asymptotic magnitudes, aperture (D25) magnitudes, UV colors, structural parameters (effective radii and concentration indices), luminosities, and effective surface brightness. We also augment our data set with archival optical and infrared photometry from HyperLeda, 2MASS and IRAS. With this updated catalog, we confirm that the (FUV ) color provides a good criterion to distinguish early and late-type galaxies, which can be improved further with the concentration indices. The IRX- relation is reformulated with our UV-selected nearby galaxies.
The GALEX images and catalogs of our nearby galaxies can be accessed via the website http://batc.bao.ac.cn/$∼$zouhu/doku.php?id=projects:galax:start
References
- Abraham et al. (1996) Abraham, R. G., Tanvir, N. R., Santiago, B. X., et al. 1996, MNRAS, 279, L47
- Basu-Zych et al. (2007) Basu-Zych, A. R., Schiminovich, D., Johnson, B. D., et al. 2007, ApJS, 173, 457
- Bertin & Arnouts (1996) Bertin, E., & Arnouts, S. 1996, A&AS, 117, 393
- Bershady et al. (2000) Bershady, M. A., Jangren, A., & Conselice, C. J. 2000, AJ, 119, 2645
- Bouwens et al. (2012) Bouwens, R. J., Illingworth, G. D., Oesch, P. A., et al. 2012, ApJ, 754, 83
- Buat et al. (2002) Buat, V., Boselli, A., Gavazzi, G., & Bonfanti, C. 2002, A&A, 383, 801
- Buat et al. (2011) Buat, V., Giovannoli, E., Takeuchi, T.T., et al. 2011, A&A, 529, 22
- Buat & Xu (1996) Buat, V., & Xu, C. 1996, A&A, 306, 61
- Cairós et al. (2001) Cairós, L. M., Caon, N., Vílchez, J. M. et al. 2001, ApJS, 136, 393
- Calzetti et al. (1994) Calzetti, D., Kinney, A. L., & Storchi-Bergmann, T. 1994, ApJ, 429, 582
- Cardelli et al. (1989) Cardelli, J. A., Clayton, G. C., & Mathis, J. S. 1989, ApJ, 345, 245
- Cohen et al. (2003) Cohen M., Wheaton W. A., & Megeath S. T., 2003, AJ, 126, 1090
- Daddi et al. (2007) Daddi, E., Dickinson, M., Morrison, G., et al. 2007, ApJ, 670, 156
- de Vaucouleurs (1977) de Vaucouleurs, G., 1977, Evolution of galaxies and stellar populations, ed. Larson R. B. & Tynsley B. M. (New Haven: Yale Univ. Obs.), 43
- de Vaucouleurs (1991) de Vaucouleurs, G., de Vaucouleurs, A., Corwin, H. G. et al. 1991, Third Reference Catalogue of Bright Galaxies (Berlin: Springer) (RC3)
- Ellis et al. (2013) Ellis, R. S., McLure, R. J., Dunlop, J. S., et al. 2013, ApJ, 763, L7
- Gil de Paz & Madore (2005) Gil de Paz, A., & Madore, B. F., 2005, ApJS, 156, 345
- Gil de Paz et al. (2007) Gil de Paz, A., Boissier, S., Madore, B. F. et al. 2007, ApJS, 173, 185
- Haan et al. (2011) Haan, S., Surace, J. A., Armus, L., et al. 2011, AJ, 141, 100
- Heckman et al. (2005) Heckman, T. M., Hoopes, C. G., Seibert, M. et al. 2005, ApJ, 619, 35
- Hoopes et al. (2007) Hoopes, C. G., Heckman, T. M., Salim, S., et al. 2007, ApJS, 173, 441
- Jarrett et al. (2003) Jarrett, T. H., Chester, T., Cutri, R., Schneider, S. E., & Huchra, J. P. 2003, AJ, 125, 525
- Kennicutt (1998) Kennicutt, R. C., 1998, ARA&A, 36, 189
- Kent (1985) Kent, S. M., 1985, ApJS, 59, 115
- Kuchinski et al. (2000) Kuchinski, L. E., Freedman, W. L., Madore, B. F., et al. 2000, ApJS, 131, 441
- Lanz Lauranne (2013) Lanz Lauranne, Zezas Andreas, Brassington Nicola et al. 2013, ApJ, 768, 90
- Lauger et al. (2005) Lauger, S., Burgarella, D., & Buat, V. 2005, A&A, 434, 77
- Malkan &Sargent (1982) Malkan, M. A., & Sargent, W. L. W. 1982, ApJ, 254, 22
- Makarov et al. (2014) Makarov D., Prugniel P., Terekhova N., Courtois H., & Vauglin I. 2014, A&A, 570, A13
- Marcum et al. (2001) Marcum, P. M., O’Connell, R. W., Fanelli, M. N., et al. 2001, ApJS, 132, 129
- Martin et al. (2005) Martin, D. C., Fanson, J., Schiminovich, D., et al. 2005, ApJ, 619, L1
- Moshir & et al. (1990) Moshir, M., & et al. 1990, IRAS Faint Source Catalogue, version 2.0 (1990), 0
- Meurer et al. (1999) Meurer, G. R., Heckman, T. M., & Calzetti, D. 1999, ApJ, 521, 64
- Muñoz-Mateos et al. (2007) Muñoz-Mateos, J. C., Gil de Paz, A., Boissier, S., et al. 2007, ApJ, 658, 1006
- Muñoz-Mateos et al. (2009) Muñoz-Mateos J. C., Gil de Paz A., Zamorano J., et al. 2009, ApJ, 399, 444
- Ofek (2014) Ofek, E. O. 2014, Astrophysics Source Code Library, 1407.005
- Overzier et al. (2008) Overzier, R. A., Heckman, T. M., Kauffmann, G., et al. 2008, ApJ, 677, 37
- Panuzzo et al. (2003) Panuzzo, P., Bressan, A., Granato, G. L., Silva, L., & Danese, L. 2003, A&A, 409, 99
- Paturel et al. (2003) Paturel, G., Petit, C., Prugniel, P., Theureau, G., Rousseau, J., Brouty, M., Dubois, P., Cambrésy, L., 2003, A&A, 412, 45
- Pozzetti et al. (2010) Pozzetti, L., Bolzonella, M., Zucca, E. et al. 2010, A&A, 523, 13
- Reddy et al. (2012) Reddy, N. A., Pettini, M., Steidel, C. C., Shapley, A. E., Erb, D. K., Law, D. R. 2012, ApJ, 754, 25
- Reddy & Steidel (2009) Reddy, N. A., & Steidel, C. C. 2009, ApJ, 692, 778
- Rice et al. (1988) Rice, W., Lonsdale, C. J., Soifer, B. T., et al. 1988, ApJS, 68, 91
- Sanders et al. (1989) Sanders, D. B., Phinney, E. S., Neugebauer, G., Soifer, B. T., & Matthews, K. 1989, ApJ, 347, 29
- Sanders & Mirabel (1996) Sanders, D. B., & Mirabel, I. F. 1996, ARA&A, 34, 749
- Sanders et al. (2003) Sanders, D. B., Mazzarella, J. M., Kim, D.-C., Surace, J. A., & Soifer, B. T. 2003, AJ, 126, 1607
- Schlegel et al. (1998) Schlegel, D. J., Finkbeiner, D. P., & Davis, M., 1998, ApJ, 500, 525
- Sullivan et al. (2004) Sullivan, M., Treyer, M. A., Ellis, R. S., & Mobasher, B. 2004, MNRAS, 350, 21
- Takeuchi et al. (2010) Takeuchi, T. T., Buat, V., Heinis, S., et al. 2010, A&A, 514, 4
- Talia et al. (2014) Talia, M., Cimatti, A., Mignoli, M. et al. 2014, A&A, 562, 113
- Ward et al. (1987) Ward, M., Elvis, M., Fabbiano, G., et al. 1987, ApJ, 315, 74
- Véron-Cetty & Véron (2006) Véron-Cetty, M.-P., & Véron, P. 2006, A&A, 455, 773
- Weiner et al. (2005) Weiner, B. J., Phillips, A. C., Faber, S. M., et al. 2005, ApJ, 620, 595
- Wilkins et al. (2012) Wikins, S. M., Gonzalez-Perez, V., et al. 2012, MNRAS, 427, 1490
- Witt & Gordon (2000) Witt, A. N., & Gordon, K. D. 2000, ApJ, 528, 799
- Zou et al. (2011) Zou, H., Zhang, W., Yang, Y. B. et al., 2011, AJ, 142, 16
| PGC | R.A. | Dec. | 2A | 2B | P.A. | T | Distance |
|---|---|---|---|---|---|---|---|
| (J2000.0) | (J2000.0) | (arcmin) | (arcmin) | (deg) | (Mpc) | ||
| (1) | (2) | (3) | (4) | (5) | (6) | (7) | (8) |
| 12 | 00 00 08.604 | 06 22 26.00 | 1.4 | 0.3 | 168 | 1.3 1.0 | 95 |
| 62 | 00 00 46.908 | 77 34 47.93 | 1.0 | 0.2 | 9 | 4.4 1.9 | 153 |
| 120 | 00 01 38.316 | 23 29 00.92 | 1.9 | 1.1 | 160 | 5.3 1.5 | 52 |
| 129 | 00 01 41.916 | 23 29 44.95 | 1.4 | 0.5 | 135 | 4.8 1.4 | 65 |
| 143 | 00 01 58.188 | 15 27 39.24 | 10.5 | 3.5 | 5 | 9.9 0.3 | 0.97 |
| 176 | 00 02 34.836 | 03 42 38.92 | 1.1 | 0.7 | 180 | 4.0 0.5 | 93 |
| 192 | 00 02 48.624 | 03 36 21.82 | 1.1 | 0.3 | 25 | 5.0 2.0 | 90 |
| 215 | 00 03 14.184 | 65 22 11.68 | 1.1 | 0.5 | 167 | 4.4 1.9 | 90 |
| 243 | 00 03 32.148 | 10 44 40.81 | 1.1 | 1.0 | … | 2.0 0.6 | 129 |
| 250 | 00 03 34.992 | 23 12 02.92 | 1.0 | 0.6 | 23 | 5.5 0.8 | 107 |
| … | … | … | … | … | … | … | … |
Note. — The parameters are taken from HyperLeda. For galaxies whose distances are not available, their distances are selected from NED. Col.(1): PGC number. Col. (2)–(3): R.A. and Dec. (J2000.0) of the galaxy center. Right ascensions are in hours, minutes, and seconds, and declinations are in degrees, arcminutes, and arcseconds. Col. (4): Major-axis diameter of the D25 ellipse. Col. (5): Minor-axis diameter. Col. (6): Position angle ( P.A.). Col. (7): Morphological type T and its error. Col. (8): Distance in Mpc.
| PGC | Asymptotic Magnitudes | D25 Magnitudes | log | Effective Radii | C31 | C42 | ||||||
|---|---|---|---|---|---|---|---|---|---|---|---|---|
| FUV | NUV | FUV | NUV | FUV | NUV | FUV | NUV | FUV | NUV | FUV | NUV | |
| (mag) | (mag) | (mag) | (mag) | (W) | (W) | (arcsec) | (arcsec) | |||||
| (1) | (2) | (3) | (4) | (5) | (6) | (7) | (8) | (9) | (10) | (11) | (12) | (13) |
| 12 | 17.37 0.01 | 16.93 0.03 | 17.57 0.01 | 17.18 0.01 | 35.931 | 35.929 | 12.71 | 13.19 | 1.93 | 2.12 | 1.88 | 2.10 |
| 62 | … | 18.48 0.04 | … | 18.70 0.04 | … | 35.732 | … | 8.67 | … | 2.21 | … | 2.15 |
| 120 | 16.47 0.04 | 15.90 0.05 | 16.62 0.01 | 16.01 0.01 | 35.768 | 35.816 | 23.22 | 22.42 | 2.14 | 2.14 | 2.00 | 2.02 |
| 129 | 17.12 0.03 | 16.50 0.02 | 17.41 0.02 | 16.70 0.01 | 35.700 | 35.768 | 17.77 | 15.89 | 2.05 | 2.11 | 2.07 | 2.03 |
| 143 | 12.61 0.04 | 12.41 0.03 | 12.71 0.00 | 12.52 0.00 | 33.857 | 33.759 | 90.46 | 91.78 | 2.14 | 2.16 | 1.98 | 2.05 |
| 176 | … | 16.29 0.07 | … | 16.50 0.01 | … | 36.176 | … | 14.76 | … | 2.20 | … | 2.12 |
| 192 | … | 17.12 0.02 | … | 17.21 0.01 | … | 35.809 | … | 8.53 | … | 2.22 | … | 2.19 |
| 215 | … | 16.83 0.04 | … | 17.04 0.02 | … | 35.931 | … | 13.52 | … | 2.51 | … | 2.49 |
| 243 | 17.56 0.05 | 16.96 0.02 | 17.62 0.01 | 17.05 0.01 | 36.125 | 36.187 | 10.85 | 10.92 | 2.85 | 3.18 | 2.93 | 3.14 |
| 250 | 16.54 0.08 | 15.97 0.02 | 17.06 0.01 | 16.41 0.01 | 36.367 | 36.417 | 16.90 | 15.49 | 2.98 | 2.94 | 2.79 | 2.88 |
Note. — Col.(1): PGC number. Col. (2)–(3): Asymptotic magnitude and its error in the FUV and NUV. Cols. (4)–(5): The aperture magnitudes and their errors within the D25 ellipse in FUV and NUV, respectively. Col. (6)–(7): Logarithm of the FUV and NUV luminosity. Col. (8)–(9): Effective radii in the FUV and NUV. Col. (10)–(11): Concentration index C31 in the FUV and NUV. Col. (12)–(13): Concentration index C42 in the FUV and NUV.
| PGC | Optical Magnitudes and Colors | 2MASS Magnitudes | Fluxes | ||||||||
|---|---|---|---|---|---|---|---|---|---|---|---|
| 12m | 25m | 60m | 100m | ||||||||
| (mag) | (mag) | (mag) | (mag) | (mag) | (mag) | (mag) | (Jy) | Jy | Jy | Jy | |
| (1) | (2) | (3) | (4) | (5) | (6) | (7) | (8) | (9) | (10) | (11) | (12) |
| 12 | 14.66 0.38 | … | … | … | 12.10 0.03 | 11.38 0.04 | 11.11 0.06 | … | … | … | … |
| 62 | 16.23 0.21 | 14.47 0.08 | … | … | 13.48 0.08 | 12.73 0.09 | 12.61 0.14 | … | … | … | … |
| 120 | 13.01 0.41 | 11.29 0.22 | … | … | 10.33 0.02 | 9.59 0.02 | 9.33 0.02 | … | … | … | … |
| 129 | 13.59 0.30 | 12.43 0.22 | … | … | 11.06 0.02 | 10.16 0.02 | 9.93 0.03 | 0.38 | 0.67 | 5.47 0.66 | 14.29 1.86 |
| 143 | 10.89 0.08 | … | … | 0.40 | … | … | … | 0.12 | 0.20 | 0.32 0.08 | 1.04 0.26 |
| 176 | 14.33 0.29 | 12.77 0.08 | … | … | 11.86 0.03 | 11.24 0.04 | 10.82 0.05 | 0.25 | 0.33 | 1.21 0.12 | 2.49 0.27 |
| 192 | 15.07 0.36 | … | … | … | 12.37 0.03 | 11.69 0.04 | 11.56 0.07 | … | … | … | … |
| 215 | 15.49 0.29 | 14.38 0.08 | … | … | 14.09 0.12 | 13.23 0.15 | 12.99 0.17 | … | … | … | … |
| 243 | 14.37 0.36 | 12.50 0.32 | … | 0.81 | 11.25 0.03 | 10.63 0.03 | 10.30 0.04 | 0.11 0.03 | 0.21 | 0.37 0.05 | 1.58 0.21 |
| 250 | 14.05 0.54 | 12.25 0.10 | … | … | 11.51 0.04 | 10.83 0.05 | 10.66 0.06 | 0.25 | 0.25 | 0.74 0.07 | 3.64 0.66 |
| … | … | … | … | … | … | … | … | … | … | … | … |
Note. — Col.(1): PGC number. Col. (2): -band total magnitude in Vega mag from HyperLeda. Col. (3): -band total magnitudes in Vega mag from HyperLeda. Cols. (4)–(5): Total asymptotic and colors from HyperLeda. Cols. (6)–(8): 2MASS , , and -band total magnitudes in Vega mag from (Jarrett et al., 2003) and the 2MASS Extended Source Catalog. Cols. (9)–(12): IRAS 12, 25, 60, and 100m fluxes in Jy from (Rice et al., 1988; Moshir & et al., 1990) and the Point Source Catalog.