Dynamics of multi-cored magnetic structures in the quiet Sun
Abstract
We report on the dynamical interaction of quiet-Sun magnetic fields and granular convection in the solar photosphere as seen by Sunrise. We use high spatial resolution (015–018) and temporal cadence (33 s) spectropolarimetric Imaging Magnetograph eXperiment data, together with simultaneous CN and Ca ii H filtergrams from Sunrise Filter Imager. We apply the SIR inversion code to the polarimetric data in order to infer the line of sight velocity and vector magnetic field in the photosphere. The analysis reveals bundles of individual flux tubes evolving as a single entity during the entire 23 minute data set. The group shares a common canopy in the upper photospheric layers, while the individual tubes continually intensify, fragment and merge in the same way that chains of bright points in photometric observations have been reported to do. The evolution of the tube cores are driven by the local granular convection flows. They intensify when they are “compressed” by surrounding granules and split when they are “squeezed” between two moving granules. The resulting fragments are usually later regrouped in intergranular lanes by the granular flows. The continual intensification, fragmentation and coalescence of flux results in magnetic field oscillations of the global entity. From the observations we conclude that the magnetic field oscillations first reported by Martínez González et al. (2011) correspond to the forcing by granular motions and not to characteristic oscillatory modes of thin flux tubes.
Subject headings:
Sun: granulation – Sun: magnetic fields – Sun: oscillations – Sun: photosphere – methods: observational – techniques: polarimetric1. Introduction
Most of our empirical knowledge of the structure and dynamics of quiet-Sun magnetism derives from observations of the solar photosphere. In this thin layer, magnetic energy is in many places of the same order as the kinetic energy. Therefore, the interaction between the magnetic field and convection at the solar surface is an efficient way of converting kinetic energy into form that can be transported to the upper layers of the solar atmosphere by the magnetic field.
The most direct method of detecting the solar magnetic field is by measuring polarized light generated via the Zeeman effect. Unfortunately, in the quiet Sun, the Zeeman effect produces only a weak polarization signal, whose measurement requires both, high spatial resolution and accurate polarimetric sensitivity. Such measurements have only recently been achieved by the Hinode spectro-polarimeter (Lites et al., 2013) and the Imaging Magnetograph eXperiment (IMaX; Martínez Pillet et al., 2011) aboard the Sunrise balloon-borne solar observatory (Solanki et al., 2010; Barthol et al., 2011; Berkefeld et al., 2011; Gandorfer et al., 2011).
Before the era of space-borne spectropolarimeters, polarimetric observations have been limited by the need for stable seeing conditions to achieve a high spatial resolution. Instead, to maximize spatial and temporal resolution, indirect signatures, or proxies of magnetic structures have been used. In particular, magnetic elements, usually described in terms of flux tubes, have been tentatively identified with bright points (BPs) in photometric observations. Based on a recent comparison between Sunrise observations and MHD simulations, Riethmüller et al. (2014) deduce that all magnetic BPs are associated with kG magnetic flux concentrations.
White-light observations obtained at the Pic du Midi Observatory in the French Pyrénées, revealed a mean lifetime of 18 minute for facular (Muller, 1983) and network (Muller & Roudier, 1992) BPs. Many BPs become elongated when they are squeezed between two moving or expanding granules (Roudier et al., 1994). 70% of these elongation processes end with the fragmentation of the bright structures.
Muller & Roudier (1984) were the first to observe bright points in the Fraunhofer G band, a CH molecular band-head around 4305 Å. At these wavelengths BPs exhibit higher contrast than the one they display in the continuum. Berger & Title (1996) studied the dynamics of G-band bright points observed with the 50 cm Swedish Vacuum Solar Telescope (Scharmer et al., 1985) on the island of La Palma, Spain. Driven by the evolution of the local granular convection flows, fragmentation and coalescence are two important processes driving the evolution of BPs. BPs also appear to rotate and fold in chains or groups. Periodically, they split into smaller fragments, merge with other BPs, and sometimes fade until they are no longer distinguishable from their surroundings. Nonetheless, Berger et al. (1998) found some BP groups to persist during the entire 70 minute data set. However, the different members of these chains cannot be identified as individual entities for longer than a granule lifetime, i.e., 6-8 minutes. Consistent with this view, Berger & Title (1996) concluded that the canonical picture of stable, isolated flux tube does not agree with observations.
Simultaneous filtegram and magnetogram observations revealed that continuum and line-core BPs (Keller, 1992; Title et al., 1992; Yi & Engvold, 1993) and G-band BPs (Berger & Title, 1996, 2001) appear associated with a magnetic feature. While isolated BPs have nearly the same size as the associated magnetic element, BP groups appear inside a large magnetic structure that extends beyond the group. For the largest magnetic structures, Muller et al. (2000) found several magnetic signal maxima at the location of individual BPs.
If we assume that BPs are the counterparts of magnetic flux tubes, their fragmentation by the perturbation of surrounding granules might indicate that magnetic elements are liable to the interchange, or fluting, instability (e.g., Krall & Trivelpiece, 1973, Chap. 5). Parker (1975) and Piddington (1975) noticed that the interchange instability is indeed an intrinsic property of flux tubes. However, due to the reduced density of the magnetic plasma, Meyer et al. (1977) showed that flux tubes with fluxes greater than about Mx, such as sunspots and pores, can be stabilized by buoyancy thanks to the rapid expansion with height of their field. Small quiet-Sun magnetic structures with fluxes in the range of – Mx (e.g. Wang et al., 1995) obviously do not fulfill this criterion. Schüssler (1984) proposed that such features could be stabilized as well if they are surrounded by whirl flows, with a whirl velocity around magnetic features between 2 and 4 km s-1 (Bünte et al., 1993a). Observations of whirl flows were first reported by Bonet et al. (2008). However, their lifetimes are only about 5 minute, on average, as they often do not survive neighboring granules, which have a similar lifetime (Bonet et al., 2010).
Stabilization of magnetic elements by means of the whirl flow mechanism is restricted to cylindrical flux tube geometry. Bünte (1993b) showed that elongated magnetic slabs, or flux sheets, are also flute unstable. He demonstrated that the slabs are most strongly liable to the instability in a layer close to , where fragmentation into single tube-filaments takes place. These filaments, however, lose their identity at lower and upper layers as they merge into a single, stable magnetic slab. Of course, the validity of such idealized computations in the real, highly dynamic, turbulent solar photosphere remains an open question.
In order to shed new light on the physical mechanism behind the dynamic nature of quiet-Sun magnetism, high spatial and temporal resolution is required over a sufficiently long time series, along with accurate polarimetry. Such high-quality observations have only recently been achieved with Sunrise/IMaX. The unprecedented spatial resolution of 015–018, allowed for the first time photospheric magnetic elements to be spatially resolved even in the quiet Sun internetwork without requiring an ad-hoc filling factor, that specifies the fraction of the pixel filled with magnetic field (Lagg et al., 2010). This represents a considerable advance compared to previous works that studied magnetic structures via their indirect signatures, e.g., BPs, or without resolving the magnetic fields.
In a previous paper (Requerey et al., 2014, hereafter Paper 1), we reported on the first direct observation of the formation of an individual photospheric magnetic element as seen by Sunrise/IMaX. Here, we complement that work by investigating the dynamical interaction of quiet-Sun magnetic structures with the convective flows.

2. Observations and data reduction
The spectropolarimetric observational data were obtained with Sunrise/IMaX on 2009 June 9 from 00:36:03 UT to 00:58:46 UT, in a quiet-Sun region close to disk center. The data set of minutes length has a temporal cadence of 33 s, with a pixel size of 0055. Throughout the observing cycle, the full Stokes vector was sampled at five wavelength positions across the Fe I 525.0217 nm line (Landé factor g = 3) at = -8, -4, +4, +8, and +22.7 pm from the line center (V5-6 mode of IMaX; see Martínez Pillet et al., 2011, for details). For the polarization analysis, the incoming light is modulated by two liquid crystal variable retarders (LCVRs) and analyzed by a beam splitter. The spectral analysis is performed by a Fabry–Pérot interferometer based on a double-pass LiNbO3 etalon.
IMaX data reduction and instrument calibrations are described by Martínez Pillet et al. (2011). Several procedures were used for dark-current subtraction, flat-field correction, and polarization cross-talk removal. The calibration set consisted of 30 in-focus and out-of-focus image pairs that, through phase diversity (Gonsalves, 1982; Paxman et al., 1996), were used for post-facto point-spread function (PSF) retrieval. The science images were reconstructed by deconvolving this PSF from the originally recorded images. The process requires an apodization that effectively reduces the IMaX field of view (FOV) down to about 43″ 43″. The blueshift over the FOV produced by the Fabry–Pérot interferometer is corrected in the inferred velocity values. The instrument achieved a spectral resolution of 8.5 pm and the spatial resolution has been estimated to be 015–018 after reconstruction. The noise level in each Stokes parameter is about 310-3 in units of the continuum intensity, and the rms contrast of the quiet-Sun granulation obtained from continuum data is about 13.5% (Solanki et al., 2010), which testifies to the outstanding quality of IMaX images. We determine the line-core intensity by fitting the observed IMaX Stokes profiles at the sampled spectral positions by a Gaussian.
In addition to the IMaX Fe I 525.0217 nm images, several nearly simultaneous CN (centered at 388 nm with FWHM 0.8 nm) and Ca ii H (centered at 396.8 nm with FWHM 0.18 nm) filtergrams obtained with the Sunrise Filter Imager (SuFI; Gandorfer et al., 2011) are used in the present paper. The time series has a cadence of 12 s, with a pixel size of 00207, and a FOV of about 13″ 38″. The CN and Ca ii H bandpass images have been phase diversity reconstructed (Hirzberger et al., 2011).
Since SuFI and IMaX data have different cadences, we select those CN and Ca ii H images whose observing times are closest to the IMaX observations. Note that the pixel size is also different. Thus, we increase the size of the SuFI image pixels by neighborhood averaging to a common scale with IMaX. Furthermore, we properly align the images by applying a cross-correlation technique on all simultaneous frames of Ca ii H and the IMaX line-core intensity, i.e., the data products having the closest BP contrast.
3. Data analysis
To determine the vector magnetic field and the line of sight (LOS) velocity, inversions of the full Stokes vector are carried out with the SIR code (Ruiz Cobo & del Toro Iniesta, 1992) for all time steps in our series. This code numerically solves the radiative transfer equation along the LOS under the assumption of local thermodynamic equilibrium, and minimizes the difference between the measured and the computed synthetic Stokes profiles using response functions.
Starting from the Harvard–Smithsonian Reference Atmosphere (Gingerich et al., 1971) as initial guess (with added magnetic and velocity parameter values), the temperature , is modified with two nodes.111As usual in SIR, the whole atmosphere is perturbed regardless of the number of nodes. Equivalent response functions are calculated at these nodes that include the sensitivity of all depth grid points (see Ruiz Cobo & del Toro Iniesta (1994) and del Toro Iniesta (2003)). The number of nodes basically indicates the degree in the polynomial spline interpolation that is assumed to apply to the perturbations (not to the final stratification). In the specific case of two nodes, they are put at the first and last point of the grid ( and ) but such positions are irrelevant: the same linear perturbation is applied independently of the node positions. However, it is worth noting that with only five wavelenght points, the temperature is not well constrained in layers above or below . The magnetic field strength , the inclination and the azimuth angles and , the LOS velocity , and the microturbulent velocity are assumed to be constant with height. The magnetic filling factor is assumed to be unity and the macroturbulent velocity is set to zero due to the high spatial resolution of the data. From and we also derive the longitudinal component of the magnetic field . At each iteration step the synthetic profiles are convolved with the spectral PSF of IMaX, which was measured in the laboratory before the launch of Sunrise (Riethmüller et al., 2014). To estimate the noise-induced uncertainty in the field strength and LOS velocity, we repeat the inversions with 100 different realizations of added noise to the observed Stokes profiles. Amplitudes of in units of the continuum intensity were used. The standard deviation of the 100 results is 150 G and 150 m s-1 respectively.
Finally, we apply a p-mode subsonic filter (Title et al., 1989) to the continuum intensity, line-core intensity, LOS velocity, CN and Ca ii H images, and compute the horizontal velocity maps of the continuum intensity by means of a local correlation tracking (LCT) technique (November, 1986; November & Simon, 1988) as implemented by Molowny-Horas & Yi (1994). Figure 1 displays example frames of an IMaX longitudinal magnetic field (left), a SuFI CN (center) and a Ca ii H (right) image after co-alignment.
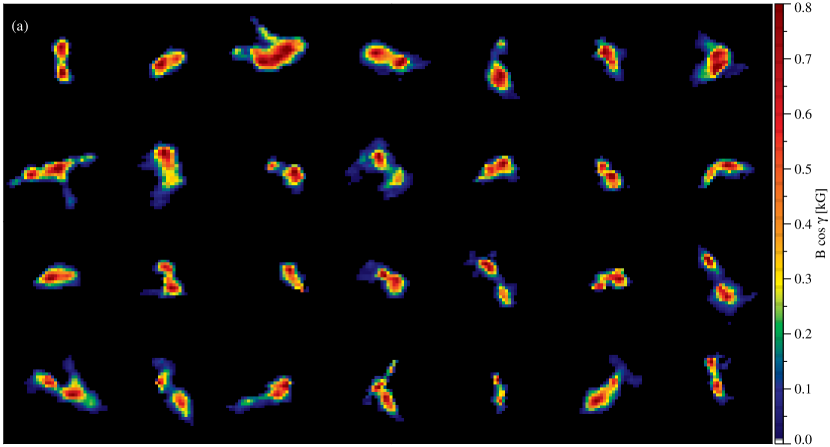
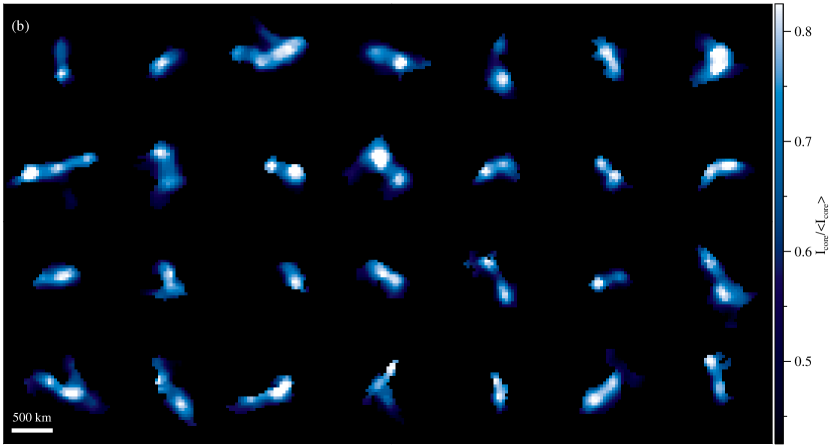
4. Multi-cored magnetic structures
The high spatial and temporal resolution observations allow us to study the dynamics of resolved small-scale magnetic structures. This implies that we are able to track magnetic elements themselves rather than just their proxies, i.e., BPs. We use time series of as context data to follow the evolution of magnetic elements. After visual inspection of each maps frame, we identify 28 groups of flux tubes evolving as single entities while the individual tubes undergo different coalescence and fragmentation processes. The locations where such magnetic structures are detected are highlighted by white boxes in Figure 1.
Figure 2 shows enlarged views of these structures. The longitudinal magnetic field maps (Figure 2(a)) illustrate “multi-cored” magnetic structures that are resolvable into a series of more elemental structures, each of which might be described by a flux tube. In general, the magnetic structures are seen in the longitudinal magnetic field maps to have at least two inner cores surrounded by a common and weaker envelope. In most cases, the line core intensity maps display a BP associated with each magnetic core (see Figure 2(b)). Thus, the multi-cored magnetic structures are generally characterized by groups of resolved BPs. Similar quiet-Sun bright structures have been previously observed by e.g., Berger & Title (1996); Berger et al. (1998); Berger et al. (2004); Rouppe van der Voort et al. (2005) and Goode et al. (2010). Here we have been able to relate each BP group with a magnetic core group that belongs to a common underlying magnetic structure.
The red box in Figure 1 highlights a region of interest containing a representative example of a multi-cored magnetic structure whose dynamics we have followed. We focused on this region because it shows, in a single example, many of the processes involved in the evolution of these magnetic features. In addition, it is one of the comparatively few cases for which we have also information from SuFI. We describe it in some detail in what follows.
4.1. Evolution of magnetic elements


Figure 3 illustrates the temporal evolution of a multi-cored magnetic structure (red box in Figure 1) based on five selected maps (first row), magnetic field strength and inclination maps (second and third rows), and co-aligned CN maps (fourth row). The blue contour in the last row marks the periphery of the multi-cored magnetic structure. This has been selected by visual inspection in such a way that all the magnetic cores are kept within the global structure. In all frames it delineates longitudinal magnetic field iso-contours of approximately 250 G, and it encloses a magnetic flux of Mx, where is the amount by which it changes over time. This contour will be used until the end of Section 4.2.
In frame number 13, an elongated CN bright structure, with two seemingly brighter concentrations, is observed. (The existence of two BPs can be confirmed through their evolution as seen in Animation 1.) The co-temporal longitudinal magnetic field map identifies the two brighter concentrations (BPs) with two associated magnetic cores embedded in a more diffuse magnetic structure. These cores are also clearly observed in the field strength and inclination images. The structure is formed by two strong ( G) and almost vertical () inner cores surrounded by a common, weaker ( G) and more inclined (), canopy-like ring. Evidence that such rings are associated with canopies in single-cored magnetic structures has been provided by, e.g., Rezaei et al. (2007), Martínez González et al. (2012) and Buehler et al. (2015). Our highly inclined fields of the rings are fairly consistent without a-priori assumptions with the conventional picture of a canopy. However, their quantitative values may be more uncertain than those from the cores, because the polarimetric signal is weaker over the rings than over the cores. Martínez González et al. (2012), for instance, found smaller tube expansions with higher spectral resolution from Sunrise/IMaX, but no linear polarization was studied since only Stokes and were available in their case.
The magnetic morphology suggests that the dual-core feature is formed by two magnetic elements (flux tubes) that lose their individual identity as they expand with height and merge together. Canopy merging has been observed by Buehler et al. (2015) in a fairly different scenario: they report on individual magnetic flux concentrations whose canopies blend with those from neighbor concentrations.
The subsequent evolution shows222Better seen in Animation 1. We suggest the reader to manually play back and forth the individual frames of the movie. that the rightmost magnetic core splits into two (frame 20). Then the three of them merge and form an isolated magnetic element (frame 32). Soon afterwards, however, it fragments into two apparently identical cores (frame 37) that subsequently start to fuse again into a single magnetic concentration (fourth 41). Two small remnants appear to leave the main merged core during the merging process itself. They follow an independent evolution (best seen in the CN maps) until the end of the time series through which both merge into a different (weaker) magnetic structure. Despite these recurrent fragmentation and coalescence processes, the magnetic cores keep sharing the same canopy over the whole time. These processes are analyzed in more detail in the following section.
Since we have observed that CN BPs are good proxies of magnetic cores and this is also true for those seen in the G band (Kiselman et al., 2001), the above-described evolutionary behavior is consistent with the photometric observations of, e.g., Berger & Title (1996). In the light of our co-aligned spectropolarimetric observations we are in a position to assert that such BP groups, that keep together for periods much longer than a granule lifetime (up to 70 minute in Berger et al., 1998), can be members of the same magnetic structures.
4.2. Interaction with granular convection
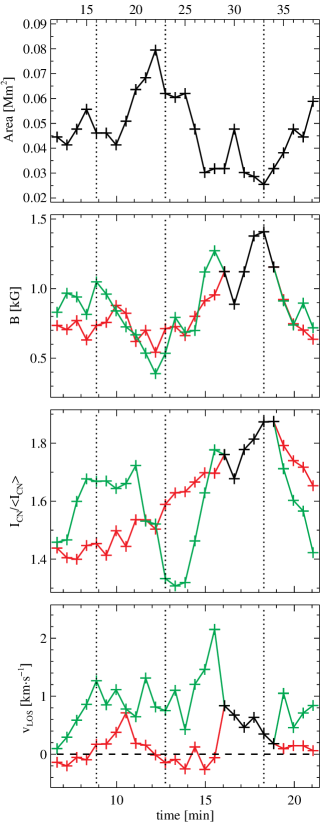
Figure 4 indicates the different processes that take place during the evolution of the multi-cored magnetic structure due to its interaction with the local granular convection flows. From top to bottom, the rows show longitudinal magnetic field maps, CN intensity, LOS velocity, and continuum intensity maps. This figure is complemented by Animation 1, which is included in the electronic edition of the journal. In the animation we also display the Ca ii H intensity maps. As in Figure 3, the blue contours mark the periphery of the multi-cored magnetic structure. The new black contours have been created to follow the evolution of the individual magnetic cores and delineate a set of regions whose summed magnetic flux is constantly equal to Mx throughout the period of observation. These flux contours are constructed by starting from the most intense pixels in the longitudinal magnetic field map and then gradually expanding the contour by lowering the for pixels included inside it. The black contours thus outline the magnetic cores. Finally, blue arrows show the horizontal velocity maps inferred through the LCT technique by correlating the displayed frames with the previous ones.
In Figure 5 we quantitatively analyze the evolution of the multi-cored magnetic structure shown in Figure 4. For this purpose, we manually track the magnetic cores in the longitudinal magnetic field maps. The first row of panels in Figure 5 displays the evolution of the area enclosed by our constant-flux region of Mx. This area is delimited by black contours in Figure 4. From top to bottom the other panels show the evolution of the field strength, CN intensity, and LOS velocity for each of the magnetic cores. To increase the signal-to-noise ratio in the magnetic core physical parameters, we represent averages over 9 pixels around their centroid. The red and green lines correspond to the leftmost and rightmost cores respectively, while a black line is drawn when the two cores merge into one. The vertical dotted lines corresponds to the end of the different phases described in the following sections.
4.2.1 Intensification by granule compression
From frame 12 to 16, the leftmost magnetic core (red lines in Figure 5) stays at rest whereas the rightmost magnetic core is compressed between two granules (Figure 4 and Animation 1) . The upper granule (at coordinates [175,2″] in frame 12) moves toward the magnetic core, while the lower granule (at coordinates [125,025]) expands. This compression process results in the intensification of the magnetic core. The field strength increases from about 800 G to about 1100 G (green line in Figure 5) as the CN intensity also rises. Meanwhile, the LOS velocity grows from nearly 0 to 1.1 km s-1 (average) with a peak velocity of up to 3 km s-1. This maximum downflow is reached at frame 16 within the rightmost core close to a small upflow feature that emerges at the edge of the magnetic structure. As soon as this small-scale downflow/upflow feature appears, a co-spatial BP is detected in the Ca ii H images (see Animation 1).
Such a nearly simultaneous small-scale downward/upward velocity pattern was first observed within a magnetic element (Paper 1) and, later, close to many BPs visible in the line core of Fe I 525.0217 nm (Utz et al., 2014). In Paper 1, this pattern was detected at the end of two consecutive magnetic field intensification processes. The isolated magnetic element was compressed by all surrounding granules, and both intensification processes led to a reduction in the area of the flux concentration and an enhancement of its field strength. In our new observations, however, this phase dose not contribute much to decreasing the area of the global magnetic structure (top panel in Figure 5). This is manly due to the small size of the rightmost magnetic core compared to the entire area covered by magnetic flux.
4.2.2 Fragmentation
After the intensification phase the rightmost magnetic core and its related CN BP get elongated (frame 17 in Figure 4) as a consequence of the compression. The “squeezing” ends by fragmenting the magnetic core in two (frames 17-21). The squeezing is also well illustrated by the horizontal velocity arrows in the bottom panels of Figure 4. For simplicity, in Figure 5 we only show the evolution of the rightmost fragment, whose field strength and CN intensity drops abruptly (green line up to frame 23). The decrease of the field strength in the resulting fragments leads to the increase of the area enclosed in the contour of constant magnetic flux (top panel in Figure 5). Small variations in the average LOS velocity accompany this process.
4.2.3 Coalescence and further fragmentation

At the end of the fragmentation phase the upper granule fades away and the surrounding granules start to fill the “empty” space (see frame 21 to 32 in Animation 1) soon afterwards. In this way, the three magnetic cores are advected to the wide space left by the fading granule, and compressed by the surrounding granules until they merge into a single magnetic element (frame 32 in Figure 4). The advection of magnetic cores by the proper motions of the neighboring granules is also well illustrated by the horizontal velocity flow field. During this compression phase a strong downflow is detected within the rightmost magnetic core (frame 28) and a small upflow in its surroundings (frame 32). As soon as the downflow appears, a new co-spatial bright feature is detected in the Ca ii H image (Animation 1). The almost co-temporal upflow that emerges at the periphery of the magnetic structure also appears co-spatial to the Ca ii H BP.
The coalescence process takes place from frame 23 to 33 (Figure 5). Within these 5 minutes, the magnetic fields are concentrated and, because the flux is conserved, the area decreases while the field strength increases. The magnetic field reaches a strength of up to 1.4 kG, compared with the initial 600 G of each magnetic core. Simultaneously, the CN intensity is also enhanced nearly in phase with the field strength. The plasma within the leftmost core is approximately at rest on average while the LOS velocity increases from 1 to 2 km s-1 within the rightmost core. Note, however, that our 9-pixel average LOS velocity can be misleading. The apparent decrease in for the coalesced structure results from the simultaneous presence of a downflow (in the inner core) and an upflow (at its periphery).
4.3. Magnetic field oscillations
Driven by the local granular convective flows, the sequence of intensification, fragmentation and coalescence events described above occur all along the evolution of the multi-cored magnetic structure. This evolutionary behavior results in oscillations of its constant magnetic flux area (top panel in Figure 5). Similar magnetic field oscillations where first detected in four quiet-Sun magnetic patches by Martínez González et al. (2011) within IMaX data. They argued that the periods associated with this oscillatory pattern could be related with characteristic oscillation modes of flux tubes or, might correspond to the forcing by granular motions. Due to their compatibility with the granular lifetime and the fact that the oscillations can be strongly damped or amplified and their period abruptly modified, they favor the latter scenario.
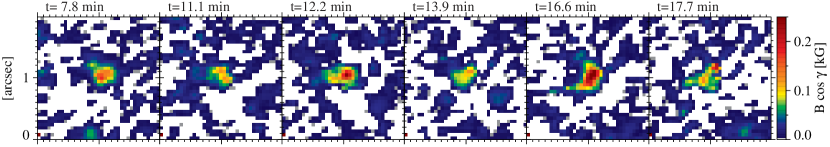
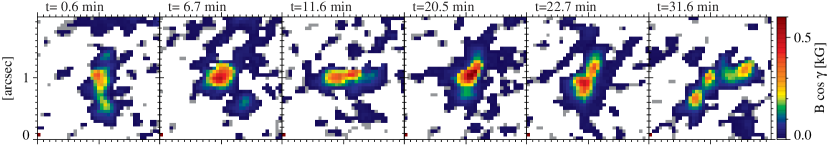
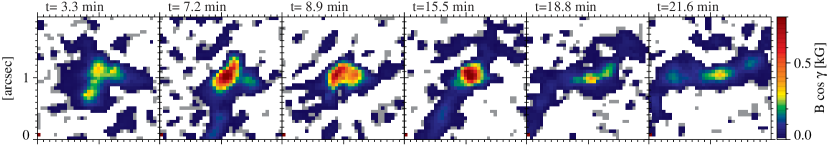
Here, we wonder if the oscillations found by Martínez González et al. (2011) have also something to do with the evolution of our multi-cored magnetic structures. With the purpose of answering this question, in Figure 6 we display the time evolution of the longitudinal magnetic field for the four magnetic patches analyzed by them. We find that at least three of them (if not all four) are indeed multi-cored magnetic structures. The one displayed in the top row also shows hints that at some point it may be composed of at least two magnetic cores (see panels at 11.1 and 17.7 minute). However, this is not that evident as in the other three cases.
According to our new analysis, the oscillations of the three multi-cored magnetic structures can be explained through the intensification, coalescence and fragmentation processes that their inner cores suffer when they are continuously buffeted by granular flows. The damping and amplification phenomenon of oscillations and the strong changes in their periods might be caused by the changes in the number of magnetic cores contained within the structure, and by the fact that some of the fragments fade into a more diffuse magnetic field below our observational threshold (see e.g., the evolution of the magnetic feature in the second row).
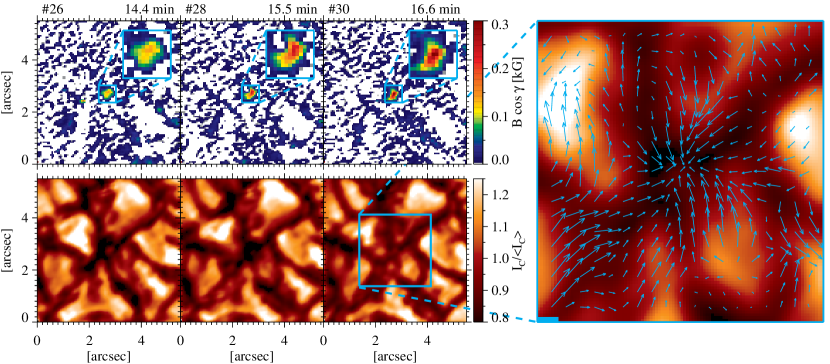
It seems evident that the oscillations in at least three of the four magnetic structures are compatible with the forcing by granular motions. However, it may still be possible that oscillatory modes are present in the evolution of the magnetic structure in the first row of Figure 6. In order to dispel these doubts we analyze the interaction of this feature with convection. With this purpose in mind we show one of the intensification events undergone by this feature in Figure 7. In the first panel, the magnetic element is located in a wide space left by granules. The magnetic structure become stronger as it is compressed between the granules. During this process the surrounding granules elongate in the direction of the magnetic feature, thus forming a characteristic daisy-like pattern first described by Muller et al. (1989). The compression process is well characterized by the horizontal velocity flows (rightmost panel in Figure 7), which point toward the magnetic feature near the center of the FOV. This shows that the oscillations correspond also in this case to the forcing by granular motions, as the magnetic feature is intensified at each of the recurrent granule compression phases.
5. Discussion and conclusions
We have presented direct observations of small-scale magnetic field dynamics in the quiet-Sun. This has been done with the accurate polarimetric measurements and high spatial resolution images obtained with the IMaX and SuFI instruments aboard the Sunrise balloon-borne stratospheric mission.
The results reported about several vertical magnetic cores surrounded by a common more horizontal magnetic structure suggest that we are witnessing a collection of flux concentrations in the lower photosphere that share a common canopy in the upper photospheric layers. In the photosphere, intensification, fragmentation and coalescence processes play an important role in the evolution of the individual magnetic elements. This evolution is consistent with that of their photometric counterparts (BPs) as described by Muller & Roudier (1992), Roudier et al. (1994) and Berger & Title (1996).
The fragmentation and merging episodes appear to be governed by the evolution of the local granular convection flows. Magnetic cores have been observed to fragment when they are “squeezed” or “compressed” by converging or expanding granules. The fragmentation of magnetic cores through the perturbation of surrounding granules may be evidence for the action of the interchange, or fluting, instability in magnetic elements. The liability to the interchange instability is indeed an inherent property of flux tubes as first noticed by Parker (1975) and Piddington (1975). The fact that the magnetic fragments share a common canopy strongly supports the theoretical predictions of Bünte (1993b). His idealized model contended that magnetic slabs are liable to fluting in a limited height range around , i.e., around the solar surface. Thus, a sheet-like magnetic structure fragments into tube-like filaments. Higher up in the atmosphere, however, the single magnetic tubes lose their individual identity as they expand with height and merge into a single, stable magnetic canopy. He also conjectured that the continuous advection of the tubes back to intergranular lanes by converging granular motions might prevent further dispersion through hydrodynamic drag.
We have also observed that soon after the splitting takes place, the resulting fragments are quickly regrouped again in intergranular lanes by the converging surrounding granules. Since the flux concentration cools the surrounding gas, it enhances the granular flows towars it (Deinzer et al., 1984). This effect keeps the multi-cored magnetic structure together during the entire 23 minute dataset. In the light of this spectropolarimetic picture, it is understandable that groups of BPs can persist for long times (up to 70 minute according to Berger et al., 1998) while being constantly buffeted by granules.
The quantitative analysis shows that the total magnetic flux of a typical multi-cored magnetic structure remains roughly constant during its evolution. We obtain this result as we are able to spatially resolve (at least partially) this magnetic structure. We are then enabled to relate the enhancement (decrease) of the CN BP brightness during the intensification and coalescence (fragmentation) phases with the increase (decrease) of the magnetic field strength and not with changes in the local filling factor as proposed by Viticchié et al. (2009). It is worth noting that in contrast to them with the spatial resolution of the Sunrise/IMaX data ( 015), we can get rid of the filling factor (Lagg et al., 2010). This correlation between the brightness and the field strength supports the classical picture of magnetic element radiance by the hot-wall mechanism. Accordingly, the reduced gas pressure within the flux tubes locally depresses the optical depth unity level. The less opaque magnetic flux-tube interior then causes an excess of lateral inflow of radiation into their evacuated interiors (Spruit, 1976; Deinzer et al., 1984), and as a consequence the magnetic elements appear brighter than their surroundings.
In addition, as a consequence of the flux conservation, the continuous intensification, coalescence and fragmentation of magnetic cores results in oscillations of the magnetic field strength and cross-section area of the entire magnetic feature. Such oscillations were first detected in four quiet-Sun magnetic patches by Martínez González et al. (2011). We have found that three of them are indeed multi-cored structures, while the fourth one may have sub-resolution structure. In all these features (and in other multi-cored magnetic structures) the compression by surrounding granules plays an important role in the intensification of the magnetic field. In Paper 1 we already observed a large-amplitude variation in area and field strength within a magnetic element related to similar granule compression processes. However, due to the limited length of the observation only a single period was seen, and therefore we could not confirm that these variations were part of an oscillatory pattern.
The excitation of the oscillations is consistent with the forcing by granular motions. The pattern we observe corresponds to the evolution of magnetic flux concentrations, whose internal structure change as they are perturbed by granular flows. Through this interaction the magnetic structures are continuously being compressed, fragmented, or their different components regrouped and hence the magnetic fields are constantly being strengthened or weakened.
These magnetic field variations could explain the fact that brightness enhancements are observed at BPs when compressed by converging granules (Muller & Roudier, 1992). They could also be the cause for the broad range of field strengths found at BPs by Beck et al. (2007), p.165.
When the magnetic structure is compressed, kG field strengths are sometimes reached at the same time that strong photospheric downward motions are found within the magnetic cores. Such a correlation has been interpreted as a convective collapse by different authors (e.g., Nagata et al., 2008; Danilovic et al., 2010). Our findings, then, suggest that convective collapse could be triggered by granular perturbations.
The highly dynamic nature of small-scale magnetic fields found here suggests the generation of waves that could propagate up through the solar atmosphere. This is supported by the chromospheric activity that we have detected during the intensification, coalescence and fragmentation processes related with photospheric downward and upward motions. Correlation between photospheric downflows and Ca ii H brightenings has been explained in terms of the convective collapse process (Shimizu et al., 2008; Fischer et al., 2009), and as disk-center photospheric traces of type II spicules (Quintero Noda et al., 2014). We did not find, however, any previous mention in the literature of a relationship between Ca ii H brightness and photospheric upflows as found here. In the chromosphere, high plasma velocities in the blue wing of Ca ii IR line have been first found by Langangen et al. (2008) as the disk counterpart of type II spicules. Could the photospheric upflows that we observe here have something to do with those seen in the chromosphere? Further investigations using time series observations of comparable spatial resolution and polarimetric sensitivity at the photosphere, together with simultaneous spectroscopic information on the chromosphere, are to shed new light on these issues.
References
- Barthol et al. (2011) Barthol, P., Gandorfer, A., Solanki, S. K., et al. 2011, Sol. Phys., 268, 1
- Beck et al. (2007) Beck, C., Mikurda, K., Bellot Rubio, L. R., Schlichenmaier, R., Sütterlin, P. 2007, Modern Solar Facilities–Advanced Solar Science, ed. F. Kneer, K. G. Puschmann & A. D. Wittmann. Published by Universitätsverlag Göttingen, 165
- Berger & Title (1996) Berger, T. E., & Title, A. M. 1996, ApJ, 463, 365
- Berger et al. (1998) Berger, T. E., Löfdahl, M. G., Shine, R. S., & Title, A. M. 1998, ApJ, 495, 973
- Berger & Title (2001) Berger, T. E., & Title, A. M. 2001, ApJ, 553, 449
- Berger et al. (2004) Berger, T. E., Rouppe van der Voort, L. H. M., Löfdahl, M. G., et al. 2004, A&A, 428, 613
- Berkefeld et al. (2011) Berkefeld, T., Schmidt, W., Soltau, D., et al. 2011, Sol. Phys., 268, 103
- Bonet et al. (2008) Bonet, J. A., Márquez, I., Sánchez Almeida, J., Cabello, I., & Domingo, V. 2008, ApJ, 687, L131
- Bonet et al. (2010) Bonet, J. A., Márquez, I., Sánchez Almeida, J., et al. 2010, ApJ, 723, L139
- Buehler et al. (2015) Buehler, D., Lagg, A., Solanki, S. K., & van Noort, M. 2015, A&A, 576, A27
- Bünte et al. (1993a) Bünte, M., Steiner, O., & Pizzo, V. J. 1993a, A&A, 268, 299
- Bünte (1993b) Bünte, M. 1993b, A&A, 276, 236
- Danilovic et al. (2010) Danilovic, S., Schüssler, M., & Solanki, S. K. 2010, A&A, 509, A76
- Deinzer et al. (1984) Deinzer, W., Hensler, G., Schüssler, M., & Weisshaar, E. 1984, A&A, 139, 435
- del Toro Iniesta (2003) del Toro Iniesta, J. C. 2003, Introduction to Spectropolarimetry (Cambridge: Cambridge Univ. Press)
- Fischer et al. (2009) Fischer, C. E., de Wijn, A. G., Centeno, R., Lites, B. W., & Keller, C. U. 2009, A&A, 504, 583
- Gandorfer et al. (2011) Gandorfer, A., Grauf, B., Barthol, P., et al. 2011, Sol. Phys., 268, 35
- Gingerich et al. (1971) Gingerich, O., Noyes, R. W., Kalkofen, W., & Cuny, Y. 1971, Sol. Phys., 18, 347
- Gonsalves (1982) Gonsalves, R. A. 1982, Optical Engineering, 21, 829
- Goode et al. (2010) Goode, P. R., Yurchyshyn, V., Cao, W., et al. 2010, ApJ, 714, L31
- Hirzberger et al. (2011) Hirzberger, J., Feller, A., Riethmüller, T. L., Gandorfer, A., & Solanki, S. K. 2011, A&A, 529, A132
- Keller (1992) Keller, C. U. 1992, Nature, 359, 307
- Kiselman et al. (2001) Kiselman, D., Rutten, R. J., & Plez, B. 2001, in Proc. IAU Symp. 203, Recent Insights into the Physics of the Sun and Heliosphere: Highlights from SOHO and Other Space Missions, ed. Pȧl Brekke, Bernhard Fleck, and Joseph B. Gurman. Published by Astronomical Society of the Pacific, 287
- Krall & Trivelpiece (1973) Krall, N. A., & Trivelpiece, A. W. 1973, Principles of Plasma Physics (Tokyo: McGraw-Hill)
- Lagg et al. (2010) Lagg, A., Solanki, S. K., Riethmüller, T. L., et al. 2010, ApJ, 723, L164
- Langangen et al. (2008) Langangen, Ø., De Pontieu, B., Carlsson, M., et al. 2008, ApJ, 679, L167
- Lites et al. (2013) Lites, B. W., Akin, D. L., Card, G., et al. 2013, Sol. Phys., 283, 579
- Martínez González et al. (2011) Martínez González, M. J., Asensio Ramos, A., Manso Sainz, R., et al. 2011, ApJ, 730, L37
- Martínez González et al. (2012) Martínez González, M. J., Bellot Rubio, L. R., Solanki, S. K., et al. 2012, ApJ, 758, LL40
- Martínez Pillet et al. (2011) Martínez Pillet, V., Del Toro Iniesta, J. C., Álvarez-Herrero, A., et al. 2011, Sol. Phys., 268, 57
- Meyer et al. (1977) Meyer, F., Schmidt, H. U., & Weiss, N. O. 1977, MNRAS, 179, 741
- Molowny-Horas & Yi (1994) Molowny-Horas, R., & Yi, Z. 1994, Internal Rep. 31, Institute of Theoretical Astrophysics (Oslo: Univ. Oslo)
- Muller (1983) Muller, R. 1983, Sol. Phys., 85, 113
- Muller & Roudier (1992) Muller, R., & Roudier, T. 1992, Sol. Phys., 141, 27
- Muller & Roudier (1984) Muller, R., & Roudier, T. 1984, Sol. Phys., 94, 33
- Muller et al. (2000) Muller, R., Dollfus, A., Montagne, M., Moity, J., & Vigneau, J. 2000, A&A, 359, 373
- Muller et al. (1989) Muller, R., Hulot, J. C., & Roudier, T. 1989, Sol. Phys., 119, 229
- Nagata et al. (2008) Nagata, S., Tsuneta, S., Suematsu, Y., et al. 2008, ApJ, 677, L145
- November (1986) November, L. J. 1986, Appl. Opt., 25, 392
- November & Simon (1988) November, L. J., & Simon, G. W. 1988, ApJ, 333, 427
- Parker (1975) Parker, E. N. 1975, Sol. Phys., 40, 291
- Paxman et al. (1996) Paxman, R. G., Seldin, J. H., Loefdahl, M. G., Scharmer, G. B., & Keller, C. U. 1996, ApJ, 466, 1087
- Piddington (1975) Piddington, J. H. 1975, Ap&SS, 34, 347
- Quintero Noda et al. (2014) Quintero Noda, C., Ruiz Cobo, B., & Orozco Suárez, D. 2014, A&A, 566, AA139
- Requerey et al. (2014) Requerey, I. S., Del Toro Iniesta, J. C., Bellot Rubio, L. R., et al. 2014, ApJ, 789, 6
- Rezaei et al. (2007) Rezaei, R., Steiner, O., Wedemeyer-Böhm, S., et al. 2007, A&A, 476, L33
- Riethmüller et al. (2014) Riethmüller, T. L., Solanki, S. K., Berdyugina, S. V., et al. 2014, A&A, 568, AA13
- Roudier et al. (1994) Roudier, T., Espagnet, O., Muller, R., & Vigneau, J. 1994, A&A, 287, 982
- Rouppe van der Voort et al. (2005) Rouppe van der Voort, L. H. M., Hansteen, V. H., Carlsson, M., et al. 2005, A&A, 435, 327
- Ruiz Cobo & del Toro Iniesta (1992) Ruiz Cobo, B., & del Toro Iniesta, J. C. 1992, ApJ, 398, 375
- Ruiz Cobo & del Toro Iniesta (1994) Ruiz Cobo, B., & del Toro Iniesta, J. C. 1994, A&A, 283, 129
- Scharmer et al. (1985) Scharmer, G. B., Pettersson, L., Brown, D. S., & Rehn, J. 1985, Appl. Opt., 24, 2558
- Schüssler (1984) Schüssler, M. 1984, A&A, 140, 453
- Shimizu et al. (2008) Shimizu, T., Lites, B. W., Katsukawa, Y., et al. 2008, ApJ, 680, 1467
- Solanki et al. (2010) Solanki, S. K., Barthol, P., Danilovic, S., et al. 2010, ApJ, 723, L127
- Spruit (1976) Spruit, H. C. 1976, Sol. Phys., 50, 269
- Title et al. (1992) Title, A. M., Topka, K. P., Tarbell, T. D., et al. 1992, ApJ, 393, 782
- Title et al. (1989) Title, A. M., Tarbell, T. D., Topka, K. P., et al. 1989, ApJ, 336, 475
- Utz et al. (2014) Utz, D., del Toro Iniesta, J. C., Bellot Rubio, L. R., et al. 2014, ApJ, 796, 79
- Viticchié et al. (2009) Viticchié, B., Del Moro, D., Berrilli, F., Bellot Rubio, L., & Tritschler, A. 2009, ApJ, 700, L145
- Wang et al. (1995) Wang, J., Wang, H., Tang, F., Lee, J. W., & Zirin, H. 1995, Sol. Phys., 160, 277
- Yi & Engvold (1993) Yi, Z., & Engvold, O. 1993, Sol. Phys., 144, 1