Revealing the accretion disc corona in Mrk 335 with multi-epoch X-ray spectroscopy
Abstract
Active galactic nuclei host an accretion disc with an X-ray producing corona around a supermassive black hole. In bright sources, such as the Seyfert 1 galaxy Mrk 335, reflection of the coronal emission off the accretion disc has been observed. Reflection produces spectral features such as an Fe K emission line, which allow for properties of the inner accretion disc and the corona to be constrained. We perform a multi-epoch spectral analysis of all XMM-Newton, Suzaku, and NuSTAR observations of Mrk 335, and we optimize our fitting procedure to unveil correlations between the Eddington ratio and the spectral parameters. We find that the disc’s ionization parameter correlates strongly with the Eddington ratio: the inner disc is more strongly ionized at higher flux. The slope of the correlation is less steep than previously predicted. Furthermore, the cut-off of the power-law spectrum increases in energy with the Eddington ratio, whereas the reflection fraction exhibits a decrease. We interpret this behaviour as geometrical changes of the corona as a function of the accretion rate. Below of the Eddington limit, the compact and optically thick corona is located close to the inner disc, whereas at higher accretion rates the corona is likely optically thin and extends vertically further away from the disc surface. Furthermore, we find a soft excess that consists of two components. In addition to a contribution from reflection in low ionization states, a second component is present that traces the overall flux.
keywords:
accretion, accretion discs – galaxies: active – X-rays: galaxies – galaxies: Seyfert – galaxies: individual: Mrk 3351 Introduction
One of the most direct probes of the physics of the inner accretion disc around an active galactic nucleus (AGN) is through its X-ray emission. As indicated by its rapid variability, the high-energy radiation is produced in the innermost regions of the accretion flow, typically only several to tens of gravitational radii (, where is the mass of the black hole and is the speed of light) from the event horizon of the black hole (e.g., Grandi et al., 1992; McHardy et al., 2006; Uttley, 2007; Zoghbi et al., 2013). This size scale is AU, which shows that it will be impossible to image the X-ray emitting regions of AGNs for the foreseeable future. X-ray spectroscopy is, therefore, the best tool to test theories of accretion physics close to the central black hole.
Fortunately, many AGNs exhibit features in their X-ray spectra that likely originate from the accretion disc (Fabian & Ross, 2010). These X-ray ‘reflection’ features are produced by the accretion disc as a result of its illumination from an external X-ray source, such as a magnetically dominated corona residing above the surface of the disc (e.g., Galeev et al., 1979; Haardt & Maraschi, 1991, 1993; Haardt et al., 1994; Di Matteo, 1998; Merloni & Fabian, 2001). The strongest feature in the X-ray reflection spectrum is typically the Fe K emission line at 6.4 keV that is due to fluorescence in a dense and relatively cold medium (e.g., Barr et al., 1985; Nandra et al., 1989; Pounds et al., 1990; George & Fabian, 1991; Nandra & Pounds, 1994). The shape of the Fe K line can be a powerful probe of the curvature of space-time (Fabian et al., 1989; Laor, 1991), leading to measurements of the spin of the super-massive black hole (e.g., Brenneman & Reynolds, 2006; Reynolds & Fabian, 2008; Reynolds, 2013). Indeed, observations over the last decade by Chandra, XMM-Newton, Suzaku and NuSTAR have uncovered several examples of relativistically broadened Fe K lines in the spectra of AGNs (e.g., Ballantyne et al., 2003; Reynolds & Nowak, 2003; Miller, 2007; Nandra et al., 2007; Fabian et al., 2009; Emmanoulopoulos et al., 2011; Nardini et al., 2012; Walton et al., 2012, 2013; Risaliti et al., 2013; Parker et al., 2014).
Models of X-ray reflection spectra (e.g. Ross & Fabian, 2005; García et al., 2013) show many features in addition to the Fe K line that collectively can constrain the ionization state of the illuminated surface (Ross et al., 1999), often parametrized by , where is the X-ray flux irradiating the reflector and is the hydrogen number density of the reflecting surface. Since the X-ray emission in AGNs likely originates from the corona, a measurement of may provide information on the density structure of the disc as well as the illuminating conditions produced by the corona. Coronal generation models suggest that the fraction of the accretion power dissipated in the corona, , can depend on the accretion rate through the disc (Stella & Rosner, 1984; Merloni & Fabian, 2002; Blackman & Pessah, 2009). Thus, there could be a dependence of on the accretion rate, which, if measured, can test ideas on the geometry of the corona and how energy flows into it. Indeed, Ballantyne et al. (2011) considered -disc accretion theory and predicted a specific relationship between and the AGN Eddington ratio that depended on various disc-corona properties such as , the viscosity parameter (Shakura & Sunyaev, 1973), and the black hole spin, . Therefore, if can be estimated for a range of Eddington ratios from a number of AGNs, significant insight into the workings of AGN coronae could be obtained.
Ballantyne et al. (2011) examined measurements of culled from the literature and showed that, although there is significant scatter, in general objects with larger Eddington ratios tend to exhibit ionized inner accretion discs. While suggestive, there was too much potential object-to-object variability in the data to draw strong conclusions from the result presented by Ballantyne et al. (2011). A significant improvement can be made by determining for several observations of a single AGN, as this should reduce the scatter and allow for a clearer interpretation of any relationship with . Fortunately, the XMM-Newton, Suzaku, and NuSTAR archives now contain many AGNs that have multiple observations with which to perform such an experiment. This paper presents the first results of this project by analysing 12 X-ray spectra of the Seyfert 1 galaxy Mrk 335 that span nearly a factor of in flux. This AGN has several properties that make it an ideal first target for this investigation: it has been observed several times by XMM-Newton, Suzaku and NuSTAR with 3 observations exceeding 100 ks of exposure time (Gondoin et al., 2002; Crummy et al., 2006; Larsson et al., 2008; Grupe et al., 2008; Grupe et al., 2012; Parker et al., 2014; Gallo et al., 2015), is known to have a relativistically broadened Fe K line (e.g., Wilkins & Gallo, 2015), an Eddington ratio that can approach unity(Vasudevan & Fabian, 2007, 2009), and a reverberation-mapped black-hole mass estimate (Peterson et al., 2004; Grier et al., 2012b). As is seen below, Mrk 335 provides an excellent test case for the predicted –Eddington ratio correlation, and a window into the physics of AGN coronae.
After describing the employed observations and the extraction of the X-ray spectra from the data (Section 2), we first analyse the spectra with a simple power-law model (Section 3). These fits indicate that spectral properties such as the shape of the iron line correlate with flux. Detailed spectral models including ionized reflection are used to quantify these correlations, including the –Eddington ratio correlation (Section 4). Finally, we interpret the observed behaviour as changes in the coronal optical depth and geometry as a function of the Eddington ratio (Section 5).
2 Observations
2.1 Observations and data products
| Observatory | Obs. ID | Start date | ||
| I | XMM-Newton | 0101040101 | 2000-12-25 | |
| II | 0306870101 | 2006-01-03 | ||
| III | 0510010701 | 2007-07-10 | ||
| IV | 0600540601 | 2009-06-11 | ||
| V | 0600540501 | 2009-06-13 | ||
| VI | Suzaku | 701031010 | 2006-06-21 | |
| VIIb | 708016010 | 2013-06-11 | ||
| VIII | 708016020 | 2013-06-14 | ||
| IXb | NuSTAR | 60001041002 | 2013-06-13 | |
| Xb | 60001041003 | 2013-06-13 | ||
| XI | 60001041005 | 2013-06-25 | ||
| XII | 80001020002 | 2014-09-20 |
a Net exposure time (excluding high-background intervals)
b Two NuSTAR observations overlap with Suzaku pointing VII
In order to explore ionized reflection over a wide range of source fluxes, we employ all available X-ray observations of Mrk 335 performed with the XMM-Newton (Jansen et al., 2001), Suzaku (Mitsuda et al., 2007), and NuSTAR (Harrison et al., 2013) observatories (Table 1). All three observatories host a focusing telescope with grazing-incidence mirrors and CCD imaging detectors that are sensitive around , where the Fe K line appears as a prominent reflection feature. With the exception of the most recent NuSTAR pointing (XII; see Table 1), all observations have been analysed before and shown to exhibit the iron line. The combined exposure time is : the most used in any detailed X-ray spectral study of Mrk 335. NuSTAR exposures IX and X are fully covered by Suzaku observation VII.
Creation of the data products for our spectral analysis is similar for all observatories. First we apply the latest calibration to the observation data. Next, an image and a light curve are created for the full detector in the full instrumental band-pass. We select source events from within a circle around the source position, and background events from an off-source region with a similar area that is devoid of other X-ray sources. By comparing the source to the detector light curve, we select times without strong background emission. This is only an issue for the XMM-Newton observations, and reduces their effective exposure time. Excluding the time intervals with background flares, we extract the source and background spectra, and we generate the accompanying response files. Neighbouring bins of the source spectra with fewer than counts are grouped, such that statistics are applicable. For most observations the source flux and the instrument’s data mode was such that pile-up was no issue, observation I being the exception. Below we describe details of this procedure for the different observatories.
2.1.1 XMM-Newton
We use data from the pn camera (Strüder et al., 2001), which is part of the European Photon Imaging Camera (EPIC). We do not include data from the MOS cameras, because of their smaller effective area, nor from the RGS, which is not sensitive in the energy band that we will consider (). Data products are created from the observation data files using the Science Analysis System (SAS) v14.0.0. At high count rates, multiple photons may be miscounted as one event (e.g., Ballet, 1999). We check for so-called pile-up by comparing the distribution of event types as a function of energy to the distribution predicted by SAS task epatplot. Substantial pile-up is only present in observation I, when the source exhibited a high flux and the detector was in “Full Window” mode with a long CCD read-out time. For that observation we exclude the piled-up part of the point-spread function, which is the inner around the source position. The outer radius of the source extraction region is , and we extract spectra in the energy range. The pn spectra typically have the highest quality among our sample, with the ratio of the source and background count rates being to (depending mostly on the source flux).
2.1.2 Suzaku
Data products for the different Suzaku instruments are created using the software package HEASOFT v6.16. For the X-Ray Imaging Spectrometer (XIS) we extract spectra in the energy range from a region around the source location. We combine the spectra of all operational front-illuminated CCDs (three for observation VI and two for VII and VIII), and we also use the back-illuminated CCD. The calibration of the front- and back-illuminated CCDs produces fluxes that differ by at most a few per cent,111See the Suzaku Data Reduction Guide v5.0 at http://heasarc.gsfc.nasa.gov/docs/suzaku/analysis/abc/ which is unnoticeable given the data quality. The ratio of source and background count rates for the XIS spectra ranges from to .
The Hard X-ray detector (HXD) is a non-imaging instrument with a collimated field of view. It has two sensors with a combined band-pass of . Above , however, the the background dominates completely, and we only consider data from the PIN silicon diodes in the range. The background is strongly dominated () by the particle background at the satellite.††footnotemark: We use the simulated non-X-ray background provided by the instrument team for the respective observations, and we employ the model of Boldt (1987)††footnotemark: to account for the small contribution from the cosmic X-ray background. From cross-calibration of Suzaku’s instruments,††footnotemark: we include an enhancement factor for the PIN spectra with respect to XIS, whose value depends on the pointing of the instruments: for observation VI and for VII and VIII.
2.1.3 NuSTAR
We employ both Focal-Plane Modules: FPMA and FPMB. Using HEASOFT v6.16 and calibration files with time stamp 7/2/2015, spectra are extracted in the energy range from a source region with radius . Whereas Suzaku’s high energy coverage is provided by a non-imaging instrument, NuSTAR’s detectors generate images for their entire band-pass. NuSTAR’s spectra above have, therefore, a substantially lower background, and the background can be much better constrained by using an off-source part of the detector. The ratios of source to background count rates are between and .
2.2 Light curves and hardness ratio
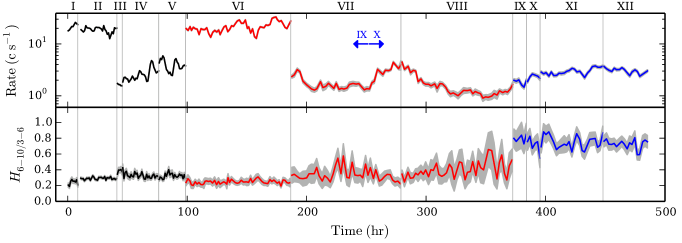
We investigate the time variability of the count rate and the hardness ratio (Fig. 1). For the latter we take the ratio of the count rate in the and bands. We show data from XMM-Newton’s EPIC pn, CCD 0 of Suzaku’s XIS, and NuSTAR’s FPMA, which all are sensitive in the two mentioned energy bands. Because of the different collecting areas and energy responses of the instruments, the count rates and hardness ratios cannot be directly compared between the different instruments. For easier comparison of the count rates, we scale the count rates such that they are comparable to XMM-Newton observations II-V. The count rate of XMM-Newton observation I is scaled up, since its effective area was reduced due to pile-up. Suzaku count rates are multiplied by a factor such that VI matches I, as the two have similar X-ray fluxes (Section 3). We scale NuSTAR by a factor , such that its count rates match on average with Suzaku during the period when observations IX and X overlap with VII. Because of the different energy responses of the instruments, these scaling corrections are only approximate. For the same reason, no scaling is applied to the hardness ratios (nor are they derived from scaled rates).
A time-scale is used for XMM-Newton and for Suzaku and NuSTAR, because of their lower effective areas. The light curves exhibit some time variability. The largest variation in the count rate is by a factor for observation VIII. The strongest variability is observed at lower count rates, where the uncertainties are correspondingly larger. Most importantly, the significance of the variations in the hardness ratio within each observation is low. This indicates that the spectral shape does not change substantially within each observation. This is consistent with previous studies, that found that the average spectra of each observation can be well fit (e.g., Wilkins & Gallo, 2015; Parker et al., 2014). We, therefore, refrain from splitting observations for a flux-resolved study (e.g., Parker et al., 2014).
2.3 Bolometric Eddington ratio
We are interested in how the properties of the accretion disc change as a function of the mass accretion rate, and we use the bolometric luminosity as a tracer of the accretion rate. From the best-fitting model to a spectrum, the luminosity in the rest frame of the host galaxy is calculated using a cosmological redshift of (Huchra et al., 1999) and assuming a flat universe with Hubble constant and cosmological constant . As most of the disc’s thermal emission is outside the X-ray band, we multiply the X-ray flux by a bolometric correction factor. We use the empirical relation derived by Zhou & Zhao (2010), which provides the bolometric correction for the unabsorbed luminosity depending on the shape of the continuum, specified by the photon index of the underlying power law. Under the assumption of isotropic emission, this provides the bolometric luminosity, .
We express the luminosity as the Eddington ratio: the ratio of to the Eddington limited luminosity, . The latter is determined as using a black-hole mass of (Peterson et al., 2004, see also Grier et al. 2012a) as well as a solar hydrogen abundance of .
The Eddington ratio’s uncertainty is dominated by systematics. The relation of Zhou & Zhao (2010) introduces a substantial systematic uncertainty from the spread in the observations that they employed. Including this uncertainty and the uncertainty in the Eddington luminosity, the mean uncertainty in is . Without these systematic uncertainties, and only including the uncertainties in and the luminosity, the mean error in is . As the in-band flux is well measured, the uncertainty is mostly set by the error in . We are interested in the correlation between parameters of a single source, so we omit the systematics from the uncertainty reported in each data point. The systematic error would only shift the observed trends with Eddington ratio.
3 Simple power-law fit
Previous analyses of these observations required a complex spectral model that includes ionized absorption at energies as well as photoionized reflection (e.g., Parker et al., 2014; Wilkins & Gallo, 2015). Before we apply a similar detailed spectral model in Section 4, however, we first fit the data with a simple power law. The observed correlation of the photon index and the X-ray flux (Sarma et al., 2015), suggests that we can gain some insight into the qualitative behaviour of the source with a simple spectral model. Following Parker et al. (2014), we fit a power law to the spectra in the energy intervals and . This avoids absorption at low energies as well as the Fe K line and the Compton hump, which are prominent reflection features. These fits provide a relatively clean look at the underlying power law. We include absorption by the Galactic interstellar medium using the the Tübingen-Boulder model (Wilms et al., 2000) with an equivalent hydrogen column of (Kalberla et al., 2005), and we use solar abundances as reported by Grevesse & Sauval (1998). A cosmological redshift is applied (Section 2.3). The spectral fits are performed using XSPEC v.12.8.2 (Arnaud, 1996), and all presented errors in the fit parameters are at .
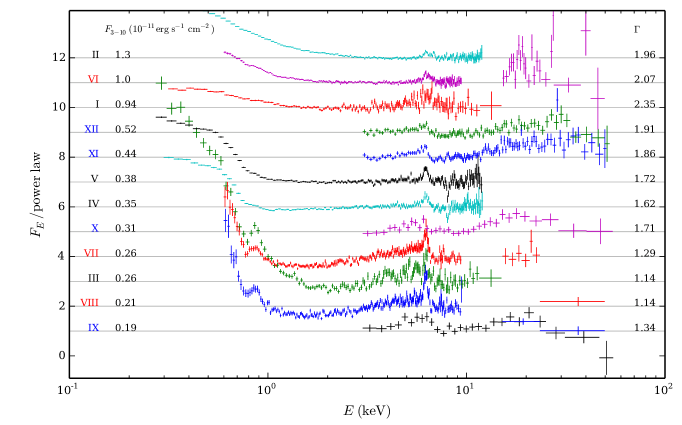
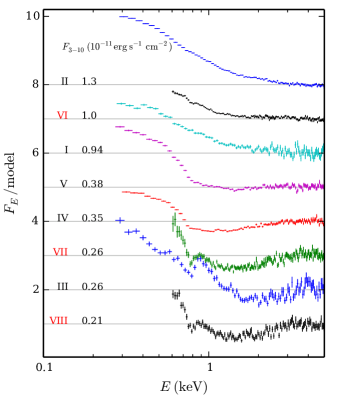
For each spectrum we determine and the power-law flux. We reproduce the logarithmic relation of and the X-ray flux with a break at higher fluxes (Sarma et al., 2015), which has also been observed in other AGN (e.g., Perola et al., 1986; Done et al., 2000; Shih et al., 2002), and we will quantify this relation with the detailed spectral analysis in Section 4. The behaviour of the spectral components that were not explicitly modelled are visualized by the ratio of the spectra to their best-fitting power law (Fig. 2). This provides a consistent picture of how the spectra evolve as a function of flux. The Fe K line and the Compton hump are visible as excesses above the power law. Considering, for example, the Suzaku spectra (VI–VIII), the strength of the line is reduced at higher flux, which is expected for a more highly ionized disc. At the low-energy side there is a strong soft excess at as well as absorption in the band. The relative strength of the soft excess appears largest at low fluxes. Also, absorption is most prominent at the lowest fluxes, whereas at the highest fluxes the soft excess extends up to . Furthermore, the data points near are consistent with the power law, except at the lowest flux values. This suggests that at low flux, the power law has a high-energy cut-off at an energy near , whereas at higher flux there is no cut-off near the considered energy band.
4 Detailed spectral analysis
Although the picture sketched above is crude, it gives us the confidence that correlations exist between various parameters and the X-ray flux, even when ignoring the absorbed part of the spectrum (; see Sarma et al. 2015 as well as the discussion in Section 5.3). Next we use a more sophisticated spectral analysis to unveil these correlations.
First we describe the detailed spectral model, which accounts for photoionized reflection off the disc. Next, we detail our strategy to mitigate model degeneracies, which forces consistency in the results of the different spectra. Finally, the fit results are presented, and we quantify the correlations of and other model parameters with flux.
4.1 Spectral model
The X-ray spectrum of Mrk 335 is rather complex, and consists of several components (e.g., Wilkins & Gallo, 2015). Thermal emission of the accretion disc dominates the spectrum in the optical and UV. This emission is reprocessed by Compton scattering off hot electrons in a corona to produce a power law that extends well into the (hard) X-ray band. In turn, the power law is reprocessed by scattering off the photoionized accretion disc. The reflection spectrum includes a strong fluorescent Fe K emission line close to , accompanying absorption edges at slightly higher energy, and a “Compton hump” at energies . Furthermore, ionized gas along the line of sight produces strong absorption below . Depending on the flux level, as many as three separate absorption components have been detected simultaneously in this source (Longinotti et al., 2013).
We employ the spectral model relxill v0.2h (García et al., 2014; Dauser et al., 2014), which combines relline (Dauser et al., 2010) and xillver (García et al., 2013). Xillver provides the illuminating power law with photon index and a high-energy exponential cut-off at energy . Furthermore, it includes the photoionized reflection variant of the power law for an accretion disc with iron abundance relative to the solar value and ionization parameter . In this paper we use , with in units of . The relative strength of the illumination and reflection components is expressed as a reflection fraction, which is calculated in the energy range.
The second part of the relxill model, relline, describes smoothing of the reflection spectrum due to relativistic effects, such as gravitational redshift and relativistic Doppler broadening. It takes into account the black-hole spin, , the inclination angle of the accretion disc with respect to the observer’s line-of-sight, and the disc’s emissivity profile from an inner radius up to an outer radius.
A second reflection component likely originates at large distance from the black hole, and its main contribution to the spectrum is a narrow Fe K line. Instead of including a full reflection model, we describe the line with a narrow unresolved Gaussian profile at , redshifted to the reference frame of the host galaxy. This simplified model is tested using NuSTAR observation XI, which has a clear detection of the narrow Fe K line and broad energy coverage. Replacing the Gaussian line by a xillver component with , we find that outside of the Fe K line it contributes at most of the total flux at any given energy. The best-fitting values of the model parameters are changed by at most , and a similar goodness of fit is obtained.
Ionized absorption is significant at energies below , and the simple analysis in Section 3 indicates that correlations of the spectral properties and the X-ray flux can be retrieved even when ignoring the absorbed part of the spectrum (see Section 5.3 for further discussion). Furthermore, prominent reflection features, such as the Fe K line and edge as well as the Compton hump, are at higher energies, so the reflection spectrum can be constrained without the low-energy part. For simplification we, therefore, ignore the spectrum below , and omit spectral components for the soft excess and ionized absorption. Absorption by an ionized gas may introduce spectral lines above . Where needed, we include narrow Gaussian profiles to fit these lines.
4.2 Reducing model degeneracies
When the above-described model is applied to spectra of limited quality, there are multiple solutions with similar goodness of fit. For example, below the uncertain nature of the soft excess and the strong absorption pose a challenge for determining the power-law parameters. We, therefore, restrict the fits to . Furthermore, the ionized and the distant reflectors can be hard to distinguish by a fit: we include a full description of the dominant component with ionized reflection and from distant reflection only the narrow Fe K emission line.
Another source of degeneracy in the model parameters is the Fe K line (e.g. Dauser et al., 2013). Because of the strong dependence of the line’s strength, shape, and energy on the ionization state of the disc, it is crucial for determining . Its properties are, however, also influenced by the reflection fraction, the disc’s iron abundance, , and the relativistic effects described with relline. The latter depend on the the black-hole spin , the inclination angle, and the disc’s emissivity profile. In total a combination of eight parameters determines the properties of the iron line. Consequently, multiple combinations of parameter values produce a similar goodness of fit. Indeed, significantly different parameter values have been obtained for individual spectra of Mrk 335 (e.g., Wilkins & Gallo, 2015), whereas one would not expect, e.g., or the inclination angle to change between observations.
To break these degeneracies, we constrain several parameters. We fix the inclination angle to , as one typically expects a relatively small angle for Seyfert 1 galaxies (the fit results are insensitive to the precise value). We take the disc emissivity to decrease with the third power of the radius (e.g., Miniutti et al., 2003). The outer radius of the disc is set to a large value of , and the inner radius is placed at the inner-most stable circular orbit, which depends on . We expect as well as to be the same for all observations. Therefore, we perform a combined fit of all XMM-Newton spectra and tie and between the different spectra, whereas all other free parameters are different for each spectrum. The XMM-Newton spectra typically have the highest quality, and including more spectra leads to an exceedingly problematic fitting procedure. We find and . When fitting the Suzaku and NuSTAR spectra, we fix and to these values.
This procedure substantially reduces the model degeneracies. Furthermore, as the fixed and tied parameters have the same values across all spectra, correlations among the other parameters are more easily retrieved.
4.3 Fit results
Using the procedure described above, we fit all spectra. For back-to-back observations with the same instrument where the spectral shape does not change significantly (Fig. 1), we combine the spectra. This is the case for XMM-Newton pointings IV and V, as well as Suzaku observations VII and VIII. NuSTAR’s IX and X were observed simultaneously with Suzaku’s VII (Fig. 1), and we fit IX and X each together with the parts of VII that overlap in time. The overlap is only a small part of the total exposure time of VII. For all spectra we obtain good fits with (Fig. 3). Unresolved red-shifted Gaussian profiles model spectral lines when needed, and we find emission lines at (in the rest frame of the host galaxy) for II and for VII and VIII as well as an absorption line at for IV and V. The presence of these lines does not significantly influence the goodness of fit.
| Observation | Reflection | ||||||
| (Table 1) | fraction | ||||||
| XMM-Newton | |||||||
| I | |||||||
| II | “ | ||||||
| III | “ | ||||||
| IV+V | “ | ||||||
| Suzaku | |||||||
| VI | |||||||
| VII+VIII | |||||||
| NuSTAR | |||||||
| IX (with VII) | |||||||
| X (with VII) | |||||||
| XI | |||||||
| XII |
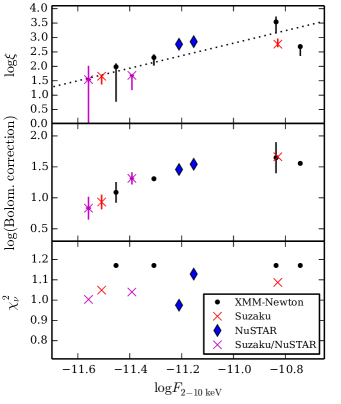
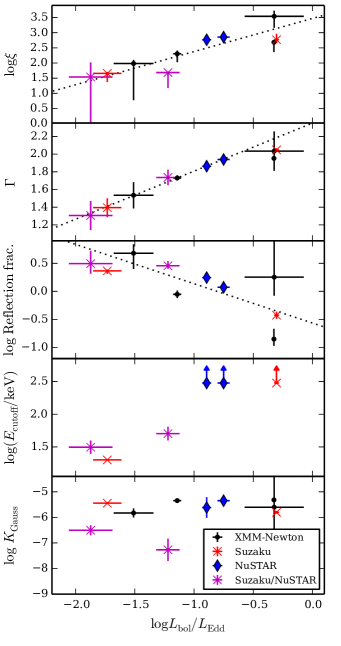
For all observations we determine the best-fitting values and uncertainties of all model parameters as well as the flux in the band (Table 2, Fig. 3 and 4). We estimate the bolometric correction depending on (Fig. 3), and calculate the Eddington ratio (Fig. 4; Section 2.3).
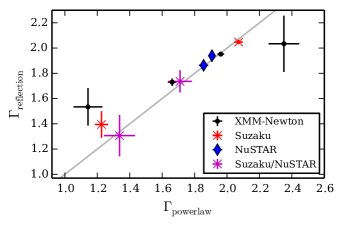
The values of that we obtain are consistent with those from the simple power-law fit in Section 3 (Fig. 5). Importantly, this means that the simple fits were sufficient for constraining the underlying power-law continuum, and that the qualitative behaviour of deviations from the power law (Fig. 2) are well described by the detailed reflection model. Therefore, the reflection model can quantify this behaviour. For example, the changes in the Fe K line apparent from the power-law fits (Fig. 2) now translate into an evolving measured with the reflection model (Fig. 3, 4).
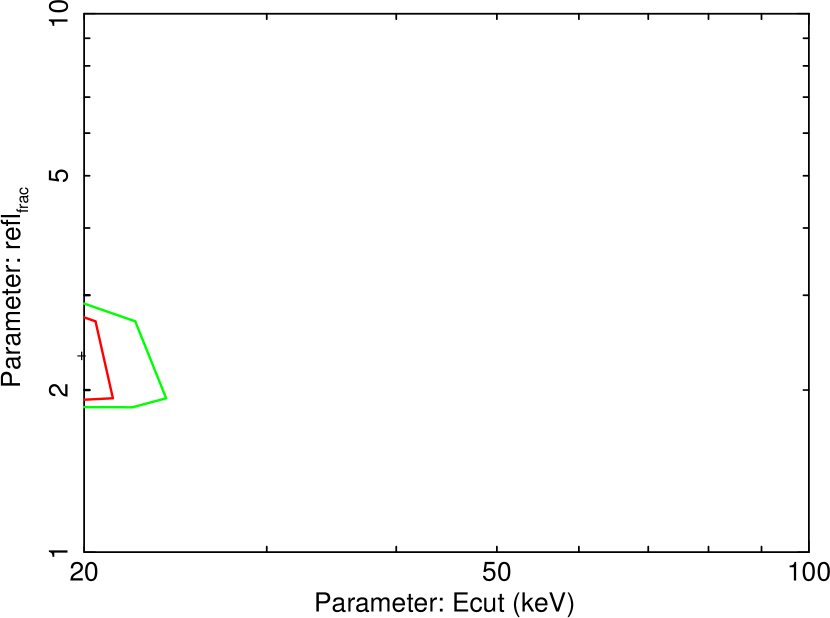
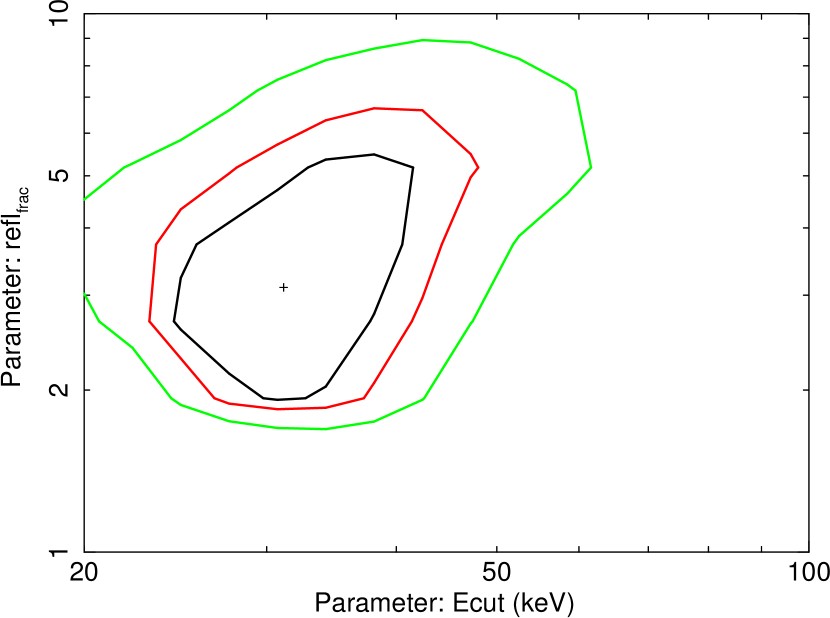
At high Eddington ratio, (equivalent to ), no high-energy cut-off of the power law is found, and we use a value of , which is far outside the energy band of our spectra.222For spectra with a higher signal-to-noise ratio, simulations find that can be measured even if it is outside the instrument band (García et al., 2015). The fits of those spectra are insensitive to the precise value of : taking changes the best-fitting values of other parameters by less than . At lower Eddington ratios, however, we measure within the energy band of Suzaku and NuSTAR. Investigation of confidence regions in space around the best fits shows that is well-constrained, and does not exhibit strong degeneracies with, e.g., the reflection fraction (see Appendix A). The lowest value, for observations VII and VIII, is at . This is the lowest value provided by the xillver model, and the actual value may therefore be somewhat smaller. XMM-Newton’s band-pass does not allow us to constrain . This may be an issue for the XMM-Newton observation with the lowest flux: III. The low flux, however, produces relatively large uncertainties, such that any deviations in the parameter values due to an incorrect are not significant.
The non-ionized reflector is likely located at a large distance from the black hole, e.g., the outer region of the disc, a torus, or the broad-line region (e.g., Nandra, 2006). The time-scale for changes to propagate to this region is years: similar to the interval covered by the observations considered in our study (Table 1). We, therefore, expect the normalization of the narrow Fe K line, , to be constant. Indeed, for four observations where is largest, its weighted mean is (Fig. 4). For all other observations is lower, which may be attributed to difficulty in separating this line from the one in the ionized reflection component. There is no evident correlation with Eddington ratio: the correlation coefficient is with a -value for no correlation of , and a linear fit yields a slope that is consistent with within .
4.4 Correlations with Eddington ratio
| Parameter | Fitted slope | Intercept | fitted slope | Intercept | ||||
| — | — | — | ||||||
| Reflection fraction |
We quantify the correlations between the logarithm of the Eddington ratio and , , and the logarithm of the reflection fraction. For we also investigate the correlation with the logarithm of the flux. The correlation coefficient, , and the -value for the null hypothesis (no correlation) are determined. Furthermore, a linear function is fit to the two parameters, taking into account the uncertainties in both, and we give the slope and intercept in Table 3. Often the goodness of fit, , is substantially larger than unity, due to the small errors in certain data points. In those cases we include a systematic error, which is added in quadrature to the uncertainties of the data points (in the “vertical” direction), such that a “perfect fit” with is obtained.
correlates strongly with . We fit a line for . The data points at highest are below this trend, which is consistent with the previously observed break in the trend at high flux (e.g., Sarma et al., 2015).
A strong correlation is found between and the X-ray flux, , as well as with the bolometric Eddington ratio. The values of the linear fit are, however, substantially larger than . The addition of a systematic error of yields for both the flux and the Eddington ratio. The obtained slope is consistent within with the previous fit. Interestingly, the slope of the linear fit is consistent within with the measurement of Ballantyne et al. (2011), who combined literature values of AGNs. Also, the intercept is consistent within ( when including the extra systematic error; Table 3). This suggests that the measured relation may be a universal property of the behaviour of these sources. Our measurement is not affected by systematic uncertainties due to differences between sources, and yields a higher correlation coefficient. Therefore, we firmly establish the presence of the correlation of and flux as well as Eddington ratio for Mrk 335.
Although the reflection fraction clearly appears to decrease for increased values of the Eddington ratio (Fig. 4), the correlation is weaker because of substantial scatter in the data points. To obtain a fit, a high systematic error of is needed, and the correlation is no longer significant.
The cut-off energy of the power law transitions from a low value of for , to at higher Eddington ratio. The transition is, however, not sampled well enough to quantify the correlation.
5 Discussion
We have performed a multi-epoch analysis of all available XMM-Newton, Suzaku, and NuSTAR observations of Mrk 335 to study the behaviour of the accretion disc corona as a function of Eddington ratio, by inferring correlations of the flux and the spectral parameters. Detailed models of ionized reflection can present degenerate solutions when applied to spectra of limited quality. Other authors have found acceptable fits to the individual spectra of Mrk 335 with alternative models, and found values of , (e.g., Wilkins & Gallo, 2015), and (e.g., Parker et al., 2014) that differ significantly from the trends that we uncover. We optimized our fitting procedure explicitly to infer consistent behaviour across multiple observations at different flux levels. This allows us to quantify strong correlations of the Eddington ratio and (see also Sarma et al., 2015), , as well as correlations with the reflection fraction and .
5.1 The ionization parameter–Eddington ratio correlation in Mrk 335
The previous section showed that Mrk 335 exhibits a strong and statistically significant correlation between and . The Ballantyne et al. (2011) -disc prediction of this relationship, assuming a radiation-pressure dominated accretion disc and a geometrically thick corona (i.e., , where is the height of the X-ray source above the disc and is the radial distance along the disc333This geometry is supported by Fe K reverberation measurements that give the distance between the corona and the disc (Reis & Miller, 2013).) is
| (1) |
where is the radiative efficiency of the disc, is the fraction of accretion energy dissipated in the corona, is the viscosity parameter (Shakura & Sunyaev, 1973), and encompass the general relativistic effects and are dimensionless functions of and (e.g., Novikov & Thorne, 1973). The spectral analysis of Mrk 335 found good fits when the inner radius of the reflecting region was at the ISCO of a black hole with (i.e., ). This removes some of the freedom present in comparing the observations to the prediction of Eq. 1, and potentially eases the physical interpretation of the results.
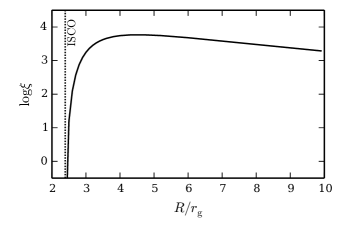
However, Eq. 1 becomes inaccurate for close to , as the functions , and begin to diverge (Krolik, 1999). This causes the disc density to increase rapidly, and therefore drops precipitously at radii close to the ISCO (Fig. 6). Such behaviour is unphysical and is not seen in numerical simulations of accretion flows close to the ISCO where the gas density is found to fall quickly as material begins to plunge towards the event horizon (e.g., Reynolds & Fabian, 2008). Thus, unlike what is seen in Fig. 6, should continue to rise as moves toward . To correct this issue, the run of with is first computed at where have not begun to strongly diverge (Fig. 6), and then this result is scaled to using the scaling predicted from Eq. 1.
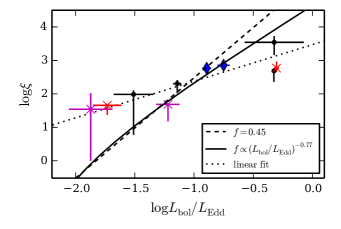
This procedure results in the two lines seen in Fig. 7, where the model predictions are plotted over the measurements of Mrk 335. The dashed line assumes a constant (Vasudevan & Fabian, 2007) and the solid line assumes (Stella & Rosner, 1984). A constant and (Davis & Laor, 2011) is also assumed for both these curves.
It is remarkable that the straightforward theoretical prediction of Eq. 1 provides such a decent description of the observations of from Mrk 335. This basic level of agreement suggests that our simple understanding of accretion discs and coronae is on the right track. Yet, it is also clear that the theoretical slope is too steep, with underpredicted at low and overpredicted at large . This result was also found by Ballantyne et al. (2011) using literature results, and indicates that Eq. 1 is missing one or more important physical effects. Ballantyne et al. (2011) speculated how changing some of the quantities in Eq. 1 (e.g., ) or the underlying disc density may help bring the predicted more in agreement with the measurements, but there were no additional constraints with which to narrow down the possibilities. However, our spectral fits of Mrk 335 provide significant new information that may allow for a clearer picture of the corona in this system.
5.2 Piecing it together: a vision for the corona of Mrk 335
Fig. 4 shows that there is evidence for an anti-correlation between the reflection fraction and in Mrk 335. The strongest reflection is found when the source is in the lowest flux state, which is consistent with light-bending enhancing the irradiation of the disc from a compact corona (e.g., Miniutti & Fabian, 2004). Our spectral model indicates a disc that is strongly irradiated at the ISCO of a spinning black hole, so, depending on the height of the X-ray source, light bending could be important in illuminating the disc. The enhancement of the irradiating flux due to light-bending is not included in the predictions of Eq. 1, so this is a natural explanation for why is underpredicted at low Eddington ratios — the flux is too low and therefore the disc is not as ionized as observed. However, this effect would cause to increase at all Eddington ratios, exacerbating the overprediction at large , unless there are changes to the coronal geometry that reduce the irradiating the flux at these Eddington ratios. The fact that the reflection fraction seems to drop at higher values of indicates that some change in coronal geometry is occurring.
The trends observed in and (Fig. 4) together support this interpretation. The primary X-ray power-law is thought to be generated by thermal Comptonization in the corona (e.g., Stern et al., 1995; Poutanen & Svensson, 1996; Petrucci et al., 2001), and depends on the coronal optical depth and temperature; e.g.,
| (2) |
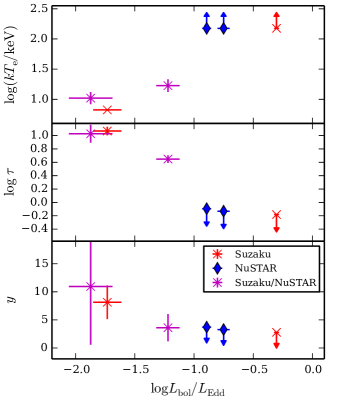
where is the optical depth and the electron temperature (e.g., Shapiro et al., 1976). The upper two panels of Fig. 8 show estimates of and (from Eq. 2) as a function of for Mrk 335. The coronal temperature is estimated using for and for larger Eddington ratios (e.g., Petrucci et al., 2001). These plots clearly suggest that the coronal optical depth diminished by about an order of magnitude as the Eddington ratio increased in Mrk 335. Once the Eddington ratio exceeded , the optical depth and the temperature remained roughly constant.
One implication of this behaviour is seen in the lower panel of Fig. 8. Here, the Compton -parameter, defined as (Petrucci et al., 2001)
| (3) |
is plotted versus . For a given geometry, a Comptonizing corona in equilibrium will adjust so that it has a fixed (e.g., Stern et al., 1995). The parameter of the Comptonizing corona of Mrk 335 changes substantially with Eddington ratio and is only relatively constant at larger Eddington ratios (Fig. 8). These results strongly imply that the coronal geometry of Mrk 335 evolves from a high optical depth configuration to a lower one as the Eddington ratio increases.
Further evidence for a change in coronal geometry can be seen by considering the compactness of the X-ray source, which is proportional to the ratio of the X-ray luminosity and the size of the corona (e.g., Guilbert et al., 1983; Fabian et al., 2015). Considerations of energy balance and radiation processes in the corona lead to various relationships between the compactness and , all of which point to an inverse relationship between the two; that is, independent of the scattering processes ongoing in the corona, the compactness is smaller for larger temperatures. Observations by NuSTAR and other missions are now showing that multiple AGNs follow such a trend (Fabian et al., 2015). Assuming the radiative processes ongoing within the corona do not change, the fact that the temperature rises with Eddington ratio in Mrk 335 implies that the compactness will fall. Since the luminosity is also increasing with a larger , then the compactness can only fall if the size scale of the radiative source increases faster than the luminosity rise.
Putting all these pieces together paints the following portrait of the evolving corona of Mrk 335. At the corona is warm, compact, optically thick and probably situated close to the black hole. This leads to significant light bending and illumination of the inner disc, increasing the reflection fraction and ionization state of the reflecting region. As the Eddington ratio increases, the corona expands and its optical depth drops, allowing the temperature to rise. The reflection fraction also begins to fall indicating that the disc is not being irradiated as strongly as before; this argues that the change in coronal geometry is more in the vertical direction away from the disc, rather than covering more disc area which would normally increase the reflection fraction. If the X-ray source is now further from the black hole, light bending would not be as important, and the flux on the disc surface would be significantly reduced. In that way, the predicted can be brought closer to the observations at .
5.3 Soft excess and absorption
The ratio of the spectra to simple power-law fits exhibits an evolving soft excess as well as absorption at low energies ( in Fig. 2). Previously, some studies have interpreted the soft excess as part of the reflection signal (Crummy et al., 2006), since reflection models predict a bump in the spectrum due to bremsstrahlung and a multitude of emission lines (e.g., García et al., 2013). Although the peak is at low energies, , the tail extends into the XMM-Newton EPIC pn and Suzaku XIS bands. At large values of the feature is weak, but at low its shape is similar to the soft excess. Wilkins & Gallo (2015) used the reflionx reflection model (Ross & Fabian, 2005) to fit the XMM-Newton and Suzaku spectra of Mrk 335, and included the data at . As the X-ray count rate peaks in the soft band, it dominates the fit, and the soft excess likely forces small values of . When they repeated their analysis with similar reflection models as in our study, no good fits were obtained. As these models present an improved description of reflection spectra, it suggests that the bump at low energies is not fully described by the reflection signal.
By ignoring the soft band in our fits, our measurement of depends more strongly on the Fe K line and (for Suzaku and NuSTAR) the Compton hump. We find that correlates with flux: as expected, stronger illumination produces a higher (Fig. 3). For a cleaner view of the soft excess and absorption, we take the ratio of the spectra to the best-fitting reflection models from Section 4 (Fig. 9). We show the ratio for XMM-Newton observations down to and for Suzaku XIS to , whereas NuSTAR is not sensitive below . The qualitative picture is the same as detailed in Section 3: absorption is stronger at low flux (see also Longinotti et al., 2013), and a soft excess is present. Reflection, therefore, does not fully account for the soft excess. Furthermore, at low flux, observations III, VII, and VIII exhibit an additional feature just below , which may signify the presence of an absorption edge.
Previous studies found absorption columns of up to (Grupe et al., 2012; Longinotti et al., 2013), which could be large enough to impact spectral parameters such as and . These studies, however, typically did not include a reflection component, and obtained poor fits when including data. As a test, we take into account warm absorption when fitting spectrum III, which may have relatively strong absorption as the source is in a low-flux state. Columns of do not significantly change the fit results, whereas for the predicted absorption is stronger than observed. Furthermore, Sarma et al. (2015) analysed the XMM-Newton spectra of Mrk 335, and obtained qualitatively and quantitatively similar results when either fitting the data or when including an ionized absorption component in fits of the full instrument band. This supports our assumption. If one nevertheless includes a strong absorption component in the spectral model, the power law component compensates with a larger photon index. For example, NuSTAR observation XII exhibits a relatively high flux, where we do not expect substantial absorption (Fig. 9). Wilkins et al. (2015) analyse this pointing in combination with contemporaneous Swift XRT data while including strong absorption (), and obtain a photon index that is per cent higher than our best fitting value. Our results can form the basis of an improved study into the nature of the soft excess and ionized absorption, which may also be responsible for some the observed spectral lines (Section 4.3).
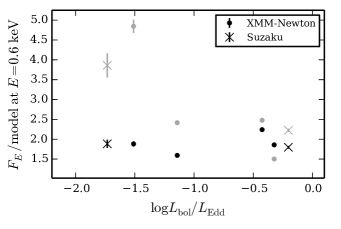
To quantify the strength of the soft excess we consider the ratio of the spectra to their best-fitting models at , which is the lowest energy that we include for Suzaku. For the power-law fits, the ratio is largest at low Eddington ratio, and decreases with luminosity (grey points in Fig. 10). This is consistent with models of reflection spectra, that predict soft emission to be stronger for low values of , which we find at low Eddington ratio (Fig. 4). Indeed, when we take the ratio of the spectra to the best-fitting reflection models, the ratios at low Eddington ratio are substantially reduced (black points in Fig. 10). They are, however, not reduced to zero, but a component remains. This component is present at both low and high Eddington ratio, and it is relatively constant with a mean value of . A constant ratio implies that it is tracks the overall flux, rather than, e.g., the reflection fraction. It may originate from the source of seed photons for coronal X-ray emission: the accretion disc. For example, the source could be a warm scattering disc atmosphere (e.g., Magdziarz et al., 1998; Done et al., 2012; Petrucci et al., 2013; Różańska et al., 2015).
6 Conclusions
Applying multi-epoch spectroscopy to XMM-Newton, Suzaku, and NuSTAR observations of Seyfert 1 galaxy Mrk 335, we have uncovered consistent behaviour of multiple spectral parameters as a function of flux and, therefore, as a function of the Eddington ratio. In particular, we find a strong correlation between the ionization state of the inner accretion disc and the Eddington ratio. The slope is consistent with a previous measurement for literature values of AGNs (Ballantyne et al., 2011), suggesting that the relation describes behaviour that is common for these sources. We firmly establish the correlation with a higher correlation coefficient, as our result is not affected by systematic uncertainties between sources. Furthermore, this correlation is close to the theoretical relation predicted by Ballantyne et al. (2011), but the measured slope is less steep, suggesting changes in the geometry of the corona. We infer the following behaviour of the evolving corona. At low values of the Eddington ratio, the corona is optically thick, compact, and close to the inner accretion disc where light bending is strong. As the accretion rate (and the Eddington ratio) increases, the corona expands, likely in the vertical direction. Above of the Eddington ratio, the corona is more extended, optically thin, and light bending is less important.
Our fits to the spectra above indicate that at lower energies the soft excess consists of components. One is due to reflection and its strength depends on the ionization state, whereas the other does not. The strength of the latter component is proportional to the overall flux, and possibly originates from the accretion disc.
Compared to previous work that considered individual spectra, we find that multi-epoch spectroscopy is essential for breaking degeneracies in the spectral fits and for obtaining accurate spectral parameters. Furthermore, we show that this method provides a powerful tool to study coronal evolution. The rich archives of the previously mentioned observatories provide the opportunity to extend this investigation to include several other bright AGN, which will reveal whether the behaviour that we found is common or unique to Mrk 335. Finally, future theoretical work needs to investigate the evolution of the coronal geometry with Eddington ratio to explain the observed behaviour of the disc’s ionization state.
Acknowledgements
The authors acknowledge support from NASA ADAP grant NNX13AI47G and NSF award AST 1008067.
References
- Arnaud (1996) Arnaud K. A., 1996, in Jacoby G. H., Barnes J., eds, ASP Conf. Ser. 101: Astronomical Data Analysis Software and Systems V. p. 17
- Ballantyne et al. (2003) Ballantyne D. R., Vaughan S., Fabian A. C., 2003, MNRAS, 342, 239
- Ballantyne et al. (2011) Ballantyne D. R., McDuffie J. R., Rusin J. S., 2011, ApJ, 734, 112
- Ballet (1999) Ballet J., 1999, A&AS, 135, 371
- Barr et al. (1985) Barr P., White N. E., Page C. G., 1985, MNRAS, 216, 65P
- Blackman & Pessah (2009) Blackman E. G., Pessah M. E., 2009, ApJ, 704, L113
- Boldt (1987) Boldt E., 1987, Phys. Rep., 146, 215
- Brenneman & Reynolds (2006) Brenneman L. W., Reynolds C. S., 2006, ApJ, 652, 1028
- Crummy et al. (2006) Crummy J., Fabian A. C., Gallo L., Ross R. R., 2006, MNRAS, 365, 1067
- Dauser et al. (2010) Dauser T., Wilms J., Reynolds C. S., Brenneman L. W., 2010, MNRAS, 409, 1534
- Dauser et al. (2013) Dauser T., Garcia J., Wilms J., Böck M., Brenneman L. W., Falanga M., Fukumura K., Reynolds C. S., 2013, MNRAS, 430, 1694
- Dauser et al. (2014) Dauser T., García J., Parker M. L., Fabian A. C., Wilms J., 2014, MNRAS, 444, L100
- Davis & Laor (2011) Davis S. W., Laor A., 2011, ApJ, 728, 98
- Di Matteo (1998) Di Matteo T., 1998, MNRAS, 299, L15
- Done et al. (2000) Done C., Madejski G. M., Życki P. T., 2000, ApJ, 536, 213
- Done et al. (2012) Done C., Davis S. W., Jin C., Blaes O., Ward M., 2012, MNRAS, 420, 1848
- Emmanoulopoulos et al. (2011) Emmanoulopoulos D., Papadakis I. E., McHardy I. M., Nicastro F., Bianchi S., Arévalo P., 2011, MNRAS, 415, 1895
- Fabian & Ross (2010) Fabian A. C., Ross R. R., 2010, Space Sci. Rev., 157, 167
- Fabian et al. (1989) Fabian A. C., Rees M. J., Stella L., White N. E., 1989, MNRAS, 238, 729
- Fabian et al. (2009) Fabian A. C., et al., 2009, Nature, 459, 540
- Fabian et al. (2015) Fabian A. C., Lohfink A., Kara E., Parker M. L., Vasudevan R., Reynolds C. S., 2015, MNRAS, 451, 4375
- Galeev et al. (1979) Galeev A. A., Rosner R., Vaiana G. S., 1979, ApJ, 229, 318
- Gallo et al. (2015) Gallo L. C., et al., 2015, MNRAS, 446, 633
- García et al. (2013) García J., Dauser T., Reynolds C. S., Kallman T. R., McClintock J. E., Wilms J., Eikmann W., 2013, ApJ, 768, 146
- García et al. (2014) García J., et al., 2014, ApJ, 782, 76
- García et al. (2015) García J. A., Dauser T., Steiner J. F., McClintock J. E., Keck M. L., Wilms J., 2015, ApJ, 808, L37
- George & Fabian (1991) George I. M., Fabian A. C., 1991, MNRAS, 249, 352
- Gondoin et al. (2002) Gondoin P., Orr A., Lumb D., Santos-Lleo M., 2002, A&A, 388, 74
- Grandi et al. (1992) Grandi P., Tagliaferri G., Giommi P., Barr P., Palumbo G. G. C., 1992, ApJS, 82, 93
- Grevesse & Sauval (1998) Grevesse N., Sauval A. J., 1998, Space Sci. Rev., 85, 161
- Grier et al. (2012a) Grier C. J., et al., 2012a, ApJ, 744, L4
- Grier et al. (2012b) Grier C. J., et al., 2012b, ApJ, 755, 60
- Grupe et al. (2008) Grupe D., Komossa S., Gallo L. C., Fabian A. C., Larsson J., Pradhan A. K., Xu D., Miniutti G., 2008, ApJ, 681, 982
- Grupe et al. (2012) Grupe D., Komossa S., Gallo L. C., Lia Longinotti A., Fabian A. C., Pradhan A. K., Gruberbauer M., Xu D., 2012, ApJS, 199, 28
- Guilbert et al. (1983) Guilbert P. W., Fabian A. C., Rees M. J., 1983, MNRAS, 205, 593
- Haardt & Maraschi (1991) Haardt F., Maraschi L., 1991, ApJ, 380, L51
- Haardt & Maraschi (1993) Haardt F., Maraschi L., 1993, ApJ, 413, 507
- Haardt et al. (1994) Haardt F., Maraschi L., Ghisellini G., 1994, ApJ, 432, L95
- Harrison et al. (2013) Harrison F. A., et al., 2013, ApJ, 770, 103
- Huchra et al. (1999) Huchra J. P., Vogeley M. S., Geller M. J., 1999, ApJS, 121, 287
- Jansen et al. (2001) Jansen F., et al., 2001, A&A, 365, L1
- Kalberla et al. (2005) Kalberla P. M. W., Burton W. B., Hartmann D., Arnal E. M., Bajaja E., Morras R., Pöppel W. G. L., 2005, A&A, 440, 775
- Krolik (1999) Krolik J. H., 1999, Active galactic nuclei : from the central black hole to the galactic environment. Princeton University Press; Princeton, N. J.
- Laor (1991) Laor A., 1991, ApJ, 376, 90
- Larsson et al. (2008) Larsson J., Miniutti G., Fabian A. C., Miller J. M., Reynolds C. S., Ponti G., 2008, MNRAS, 384, 1316
- Longinotti et al. (2013) Longinotti A. L., et al., 2013, ApJ, 766, 104
- Magdziarz et al. (1998) Magdziarz P., Blaes O. M., Zdziarski A. A., Johnson W. N., Smith D. A., 1998, MNRAS, 301, 179
- McHardy et al. (2006) McHardy I. M., Koerding E., Knigge C., Uttley P., Fender R. P., 2006, Nature, 444, 730
- Merloni & Fabian (2001) Merloni A., Fabian A. C., 2001, MNRAS, 328, 958
- Merloni & Fabian (2002) Merloni A., Fabian A. C., 2002, MNRAS, 332, 165
- Miller (2007) Miller J. M., 2007, ARA&A, 45, 441
- Miniutti & Fabian (2004) Miniutti G., Fabian A. C., 2004, MNRAS, 349, 1435
- Miniutti et al. (2003) Miniutti G., Fabian A. C., Goyder R., Lasenby A. N., 2003, MNRAS, 344, L22
- Mitsuda et al. (2007) Mitsuda K., et al., 2007, PASJ, 59, 1
- Nandra (2006) Nandra K., 2006, MNRAS, 368, L62
- Nandra & Pounds (1994) Nandra K., Pounds K. A., 1994, MNRAS, 268, 405
- Nandra et al. (1989) Nandra K., Pounds K. A., Stewart G. C., Fabian A. C., Rees M. J., 1989, MNRAS, 236, 39P
- Nandra et al. (2007) Nandra K., O’Neill P. M., George I. M., Reeves J. N., 2007, MNRAS, 382, 194
- Nardini et al. (2012) Nardini E., Fabian A. C., Walton D. J., 2012, MNRAS, 423, 3299
- Novikov & Thorne (1973) Novikov I. D., Thorne K. S., 1973, in Dewitt C., Dewitt B. S., eds, Black Holes (Les Astres Occlus). pp 343–450
- Parker et al. (2014) Parker M. L., et al., 2014, MNRAS, 443, 1723
- Perola et al. (1986) Perola G. C., et al., 1986, ApJ, 306, 508
- Peterson et al. (2004) Peterson B. M., et al., 2004, ApJ, 613, 682
- Petrucci et al. (2001) Petrucci P. O., et al., 2001, ApJ, 556, 716
- Petrucci et al. (2013) Petrucci P.-O., et al., 2013, A&A, 549, A73
- Pounds et al. (1990) Pounds K. A., Nandra K., Stewart G. C., George I. M., Fabian A. C., 1990, Nature, 344, 132
- Poutanen & Svensson (1996) Poutanen J., Svensson R., 1996, ApJ, 470, 249
- Reis & Miller (2013) Reis R. C., Miller J. M., 2013, ApJ, 769, L7
- Reynolds (2013) Reynolds C. S., 2013, Classical and Quantum Gravity, 30, 244004
- Reynolds & Fabian (2008) Reynolds C. S., Fabian A. C., 2008, ApJ, 675, 1048
- Reynolds & Nowak (2003) Reynolds C. S., Nowak M. A., 2003, Phys. Rep., 377, 389
- Risaliti et al. (2013) Risaliti G., et al., 2013, Nature, 494, 449
- Ross & Fabian (2005) Ross R. R., Fabian A. C., 2005, MNRAS, 358, 211
- Ross et al. (1999) Ross R. R., Fabian A. C., Young A. J., 1999, MNRAS, 306, 461
- Różańska et al. (2015) Różańska A., Malzac J., Belmont R., Czerny B., Petrucci P.-O., 2015, A&A, 580, A77
- Sarma et al. (2015) Sarma R., Tripathi S., Misra R., Dewangan G., Pathak A., Sarma J. K., 2015, MNRAS, 448, 1541
- Shakura & Sunyaev (1973) Shakura N. I., Sunyaev R. A., 1973, A&A, 24, 337
- Shapiro et al. (1976) Shapiro S. L., Lightman A. P., Eardley D. M., 1976, ApJ, 204, 187
- Shih et al. (2002) Shih D. C., Iwasawa K., Fabian A. C., 2002, MNRAS, 333, 687
- Stella & Rosner (1984) Stella L., Rosner R., 1984, ApJ, 277, 312
- Stern et al. (1995) Stern B. E., Poutanen J., Svensson R., Sikora M., Begelman M. C., 1995, ApJ, 449, L13
- Strüder et al. (2001) Strüder L., et al., 2001, A&A, 365, L18
- Uttley (2007) Uttley P., 2007, in Ho L. C., Wang J.-W., eds, Astronomical Society of the Pacific Conference Series Vol. 373, The Central Engine of Active Galactic Nuclei. p. 149
- Vasudevan & Fabian (2007) Vasudevan R. V., Fabian A. C., 2007, MNRAS, 381, 1235
- Vasudevan & Fabian (2009) Vasudevan R. V., Fabian A. C., 2009, MNRAS, 392, 1124
- Walton et al. (2012) Walton D. J., Reis R. C., Cackett E. M., Fabian A. C., Miller J. M., 2012, MNRAS, 422, 2510
- Walton et al. (2013) Walton D. J., Nardini E., Fabian A. C., Gallo L. C., Reis R. C., 2013, MNRAS, 428, 2901
- Wilkins & Gallo (2015) Wilkins D. R., Gallo L. C., 2015, MNRAS, 449, 129
- Wilkins et al. (2015) Wilkins D. R., Gallo L. C., Grupe D., Bonson K., Komossa S., Fabian A. C., 2015, MNRAS, 454, 4440
- Wilms et al. (2000) Wilms J., Allen A., McCray R., 2000, ApJ, 542, 914
- Zhou & Zhao (2010) Zhou X.-L., Zhao Y.-H., 2010, ApJ, 720, L206
- Zoghbi et al. (2013) Zoghbi A., Reynolds C., Cackett E. M., Miniutti G., Kara E., Fabian A. C., 2013, ApJ, 767, 121
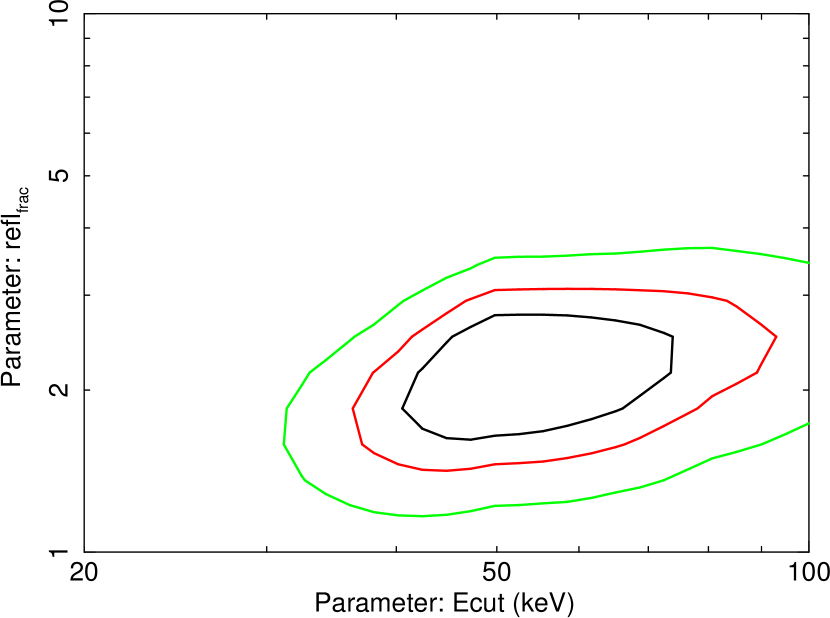
Appendix A Degeneracies in the continuum parameters
The spectral model of ionized reflection of a power-law continuum suffers from degeneracies when fit to data of limited quality. Most prominently, this is an issue for determining the parameters that shape the Fe K line. For our fitting procedure we applied a strategy (Section 4.2) that revealed strong correlations with flux for and (Section 4.4). These parameters also shape the continuum of the spectra. Degeneracies may also influence the other continuum parameters: the reflection fraction and . The correlations of these parameters with flux are weaker, or are not quantified as precisely (Fig. 4). We investigate whether a strong degeneracy between the two parameters influences our results in the three cases where we could measure (observations VII, IX, and XII; see Fig. 4). Contours of confidence intervals in -space around the best fitting values exhibit only minor asymmetries (Fig. 11), and no evidence of strong degeneracies is visible. For Suzaku observation VII, the best fit lies on the domain boundary of . Otherwise, our fit results are well localised. Furthermore, when we determined the uncertainties in the fit parameters, we took any asymmetries into account, such that our reported errors include the full extent of the contours in Fig. 11.