Tapping Into the Wells of Social Energy:
A Case Study Based on Falls Identification
Abstract
Are purely technological solutions the best answer we can get to the shortcomings our organizations are often experiencing today? The results we gathered in this work lead us to giving a negative answer to such question. Science and technology are powerful boosters, though when they are applied to the “local, static organization of an obsolete yesterday” they fail to translate in the solutions we need to our problems. Our stance here is that those boosters should be applied to novel, distributed, and dynamic models able to allow us to escape from the local minima our societies are currently locked in. One such model is simulated in this paper to demonstrate how it may be possible to tap into the vast basins of social energy of our human societies to realize ubiquitous computing sociotechnical services for the identification and timely response to falls.
keywords:
Falls identification; telecare; sociotechnical systems; agent-based simulation; role-flow<ccs2012> <concept> <concept_id>10010405.10010444.10010447</concept_id> <concept_desc>Applied computing Health care information systems</concept_desc> <concept_significance>500</concept_significance> </concept> <concept> <concept_id>10010147.10010341.10010370</concept_id> <concept_desc>Computing methodologies Simulation evaluation</concept_desc> <concept_significance>500</concept_significance> </concept> <concept> <concept_id>10003120.10003130.10003233</concept_id> <concept_desc>Human-centered computing Collaborative and social computing systems and tools</concept_desc> <concept_significance>500</concept_significance> </concept> </ccs2012>
[500]Applied computing Health care information systems \ccsdesc[500]Computing methodologies Simulation evaluation \ccsdesc[500]Human-centered computing Collaborative and social computing systems and tools
1 Introduction
I suppose it is tempting,
if the only tool you have is a hammer,
to treat everything as if it were a nail.Abraham Maslow,
The Psychology of Science
A well-known syndrome introduced by Abraham Maslow is the so-called “law of the instrument”, stating that solutions to problems are often influenced by the tools available off-the-shelf [16]. This obviously introduces limitations and inefficiencies. A typical case in point is given by information and communication technology (ICT) solutions to the problem of fall identification. Falls are the “most significant cause of injury for elderly persons” [14]—more specifically “the most serious life-threatening events that can occur” in the 65+ age group [11]. Although not a frequent event, it is one whose consequences are often of the most concern [11, 2], especially in the case proper treatment is not timely dispatched to the fallen person. A common “tool” to deal with this problem is fall detection devices. Such devices—for instance accelerometers, gyroscopes, or other sensors—constantly monitor a person and trigger an alarm when some safety threshold is reached. A major limitation and inefficiency of this approach is due to the current difficulties of our algorithms and their implementations to provide reliable assessments of real-life situations. Despite the continuing technological progress, it is still very difficult for an ICT monitoring device to determine whether a person has actually fallen or if, e.g., he or she has knelt down very quickly. The use of redundancy—by coupling, for instance, two accelerometers of different technology and design) improves the sensitivity (i.e., reduces the false negative rate), though this is often reached at the price of increasing the false alarm ratio (i.e., reducing the specificity). The already high social costs are thus exacerbated by unnecessary interventions due to false alarms.
How to deal with this problem? One way is to try and improve the current tools. Purely ICT solutions to fall detection assessment are the subject of numerous research actions, which results in improvements in both sensitivity and specificity. Despite those efforts, “no silver bullet [is] in sight [yet]” [2]. Another possibility is to widen our horizons and look for different and better approaches. In this paper we discuss one such approach. We propose to go beyond the purely technological solution and to integrate humans in the system. The resulting socio-technological system is introduced and analyzed here by means of a multi-agent simulation model. We show that by integrating information from the cyber- and the physical domain and by appointing verification tasks to a “cloud” of human agents it is possible to overcome, to some extent, the current limitations and inefficiencies of purely ICT-based solutions.
In what follows we first briefly recall in Sect. 2 a number of definitions. Section 3 then briefly summarizes the key elements of our fractal social organizations—a distributed, bio-inspired organization that we have used to structure the simulation models employed in this paper. Section 4 follows and introduces our actor classes. Two classes of simulation models corresponding to the use of either one or two fall detectors coupled with a variable number of human agents are given in Sect. 5. Results are discussed in Sect. 6, while Sect. 7 recalls the major lessons learned and concludes.
2 Figures of Interest
We now introduce the figures we focus our attention on in the course of our simulations.
Definition 1 (False positive rate)
False Positive
(FP) rate (commonly known also as
False Alarm rate) is the probability of concluding that the observed facts do imply the
identification of a situation, when in fact that is not the case.
The event did not take place, but the system “fired”.
Every occurrence of said wrong conclusion is called a FP.
In the face of a FP, assistance is delivered but results in a waste of resources. Social costs go up without providing any social returns.
Definition 2 (Specificity)
Specificity is the probability of correctly identifying that a given event has not taken place. It is equal to .
Definition 3 (False negative rate)
False negative (FN) rate is the probability of not being able to identify the occurrence of an event that took place. The event was experienced, though the system did not “fire”. Every time the system fails to identify a true fall we shall say that a FN occurred. In other words, a FN is a missed alarm: the system did not react in the face of a true fall.
Definition 4 (Sensitivity)
Sensitivity is the probability of correctly identifying that a given event has taken place. Sensitivity is equal to .
As efficaciously observed by Dr. Tom Doris, KeepUs project founder and technical lead [2],
“In any safety system, false negatives are possibly the worst kind of failure.”
This is particularly true in the case of falls. Quoting again Dr. Doris,
“the single most important factor influencing the long-term outcome [after a fall] is the length of time between the fall and getting medical attention at a hospital. A few hours more or less makes the difference between life and death.”
Evidence of a strict correlation between the time of arrival of medical caregivers and the mortality rate may be found also in [11, 1].
A problem we tackle in this paper is the well-known correlation between FP and FN. Whatever the method in use today, if one wants to reduce FN rate, usually FP rate goes up [2]. In what follows we are going to introduce a method to deal with this problem based on the use of “social energy,” which we defined in [5] as “the self-serve, self-organization, and self-adaptability potentials of our societies.”
As a first component of our solution we now briefly introduce the main elements of the organizational structure that we call “fractal social organizations.”
3 Fractal Social Organizations
Fractal Social Organizations (FSO) is an organizational structure that realizes a nested compositional hierarchy [21] (NCH): the system is a network of nodes, each of which is a network of other nodes. FSO nodes are called circles. Being a NCH means that the FSO is structured as concentric circles. Examples of said circles may be for instance an employee of a business enterprise; an office of that enterprise; the whole business enterprise; or a business ecosystem including several business bodies. In each FSO circle there is a node that coordinates that circle. Said coordinator node receives notification data from all the nodes of its circle. Notifications received by the coordinator describe the evolving of situational and context information. This means that any node state change and also any detected external change are reported111In our prototypical implementation of the FSO this was implemented via a standardized, asynchronous publish-and-subscribe mechanism [18]..
The circle coordinator is an autonomic computing agent implementing a MAPE loop. Received data is fed into the loop’s “M” component—namely, its perception organ. Once received, data is analyzed and integrated (by the “A” component) and semantically matched with the information already known to the coordinator. Deductions are fed into a the planner component (“P”), which selects a response protocol through a simple algorithm. The selected protocol is then executed by component “E”.
Protocols are associated at design time to state transitions and situation identifications. If, for instance, situation = “fall suspected in flat 145” is associated to protocol , then as soon as is identified protocol is readied for running.
A readied protocol is a protocol that has been authorized for launching though is not running yet. Protocols in fact require the availability of one or more agents. Protocol may need, e.g., the cooperation of a general practitioner, a nurse, an ambulance, an ambulance driver, and specific medical devices.
In order to launch a protocol, the coordinator needs to enroll agents: assign agents to the needed roles. This is similar to data-flow, only it requires active roles instead of data. Because of this similarity, we call this a role-flow approach. An alternative way to describe the FSO protocols is to consider them as guarded actions [10] whose guards express the successful enrollment of agents.
An important aspect of FSO is the fact that the coordinator does not care whether a candidate actor is a professional carer, a volunteer, a patient, or a machine. The agent just needs to qualify for the sought role. This means that agents need to be known beforehand in order to play significant roles in an FSO. Knowing an agent means having a semantic description of what the agent may do. More information about this ma be found in [9, 20]. No semantic processing is used in our simulation models due to their simple formulation.
If the coordinator can find agents for all the roles it requires, the protocol starts. If not, there is what we call a role exception. This means that the circle coordinator publishes a new event in the “parent circle”– the circle that includes the current circle as a node. If not all the requested agents can be enrolled in the parent circle, this results in a new role exception. Through this mechanism the coordinators “spread the news” about the missing roles throughout the levels of the network. As soon as enrollment is completed, the enrolled agents become a new transient FSO whose aim and lifespan is defined by the execution of their associated protocol. We call said transient FSO a “social overlay network.”
This realizes inter-organizational collaboration and shifts the responsibility for service response composition from the user to the “system”—more information about this is provided in [8].
FSO circles are structured as so-called service-oriented communities (SoC’s). They are described in detail in [5, 6]. A special case of SoC is given by a person and a periphery of devices that the person has access to. We call such SoC an individual SoC (iSoC).
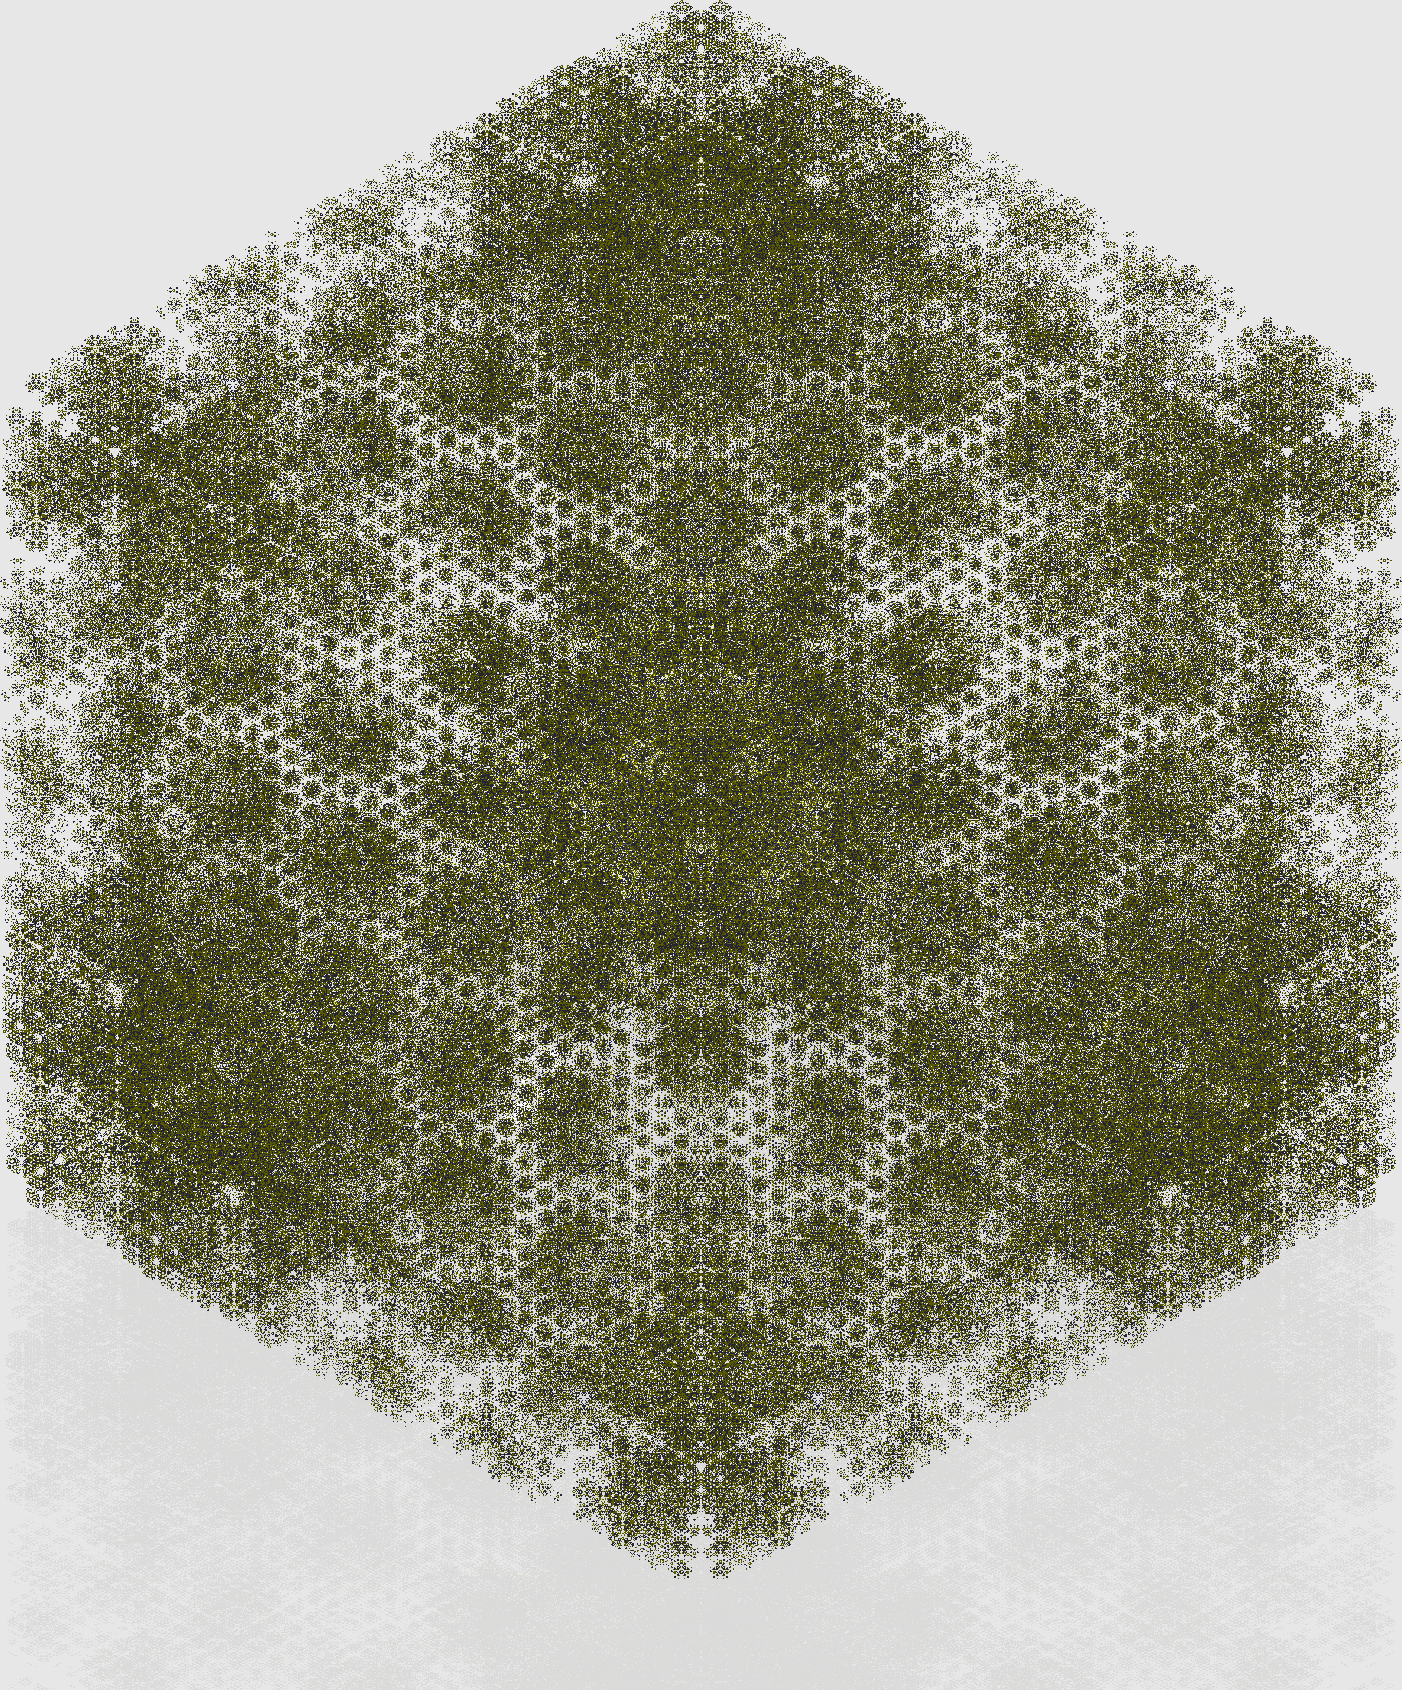
Figure 1 represents the set of all possible social overlay networks in an FSO including six roles (roles 0–5) and 12 agents distributed as follows: role 0, role 1, and role 5 are played by 3 agents each while role 2, role 3, and role 4 are played by 1 agent each.
4 Simulation Model
For our simulations we use NetLogo [22], a tool that allows agent-based rapid prototyping. Netlogo provides a simulation area that functions as a virtual world in which events are triggered on the initialized agents in discrete time steps called “ticks”. The simulation area includes several classes of agents, which are described in what follows.
Definition 5 (Elderly Agent)
Elderly agents (EA’s) are agents representing elderly or impaired persons. EA’s are assumed not to leave their house, in which their condition is monitored by Device Agents (see Definition 8).
Definition 6 (Professional Carer)
Professional carers (PC’s) represent agents able to supply certified healthcare services to other agents. Such agents are institutional, meaning that their action is regulated by rules, laws, and a professional code of service. This translates into relative high availability and guarantees of timely intervention.
Definition 7 (Informal Carer; Verification)
In- formal carers (IC’s) are mobile agents that are able to provide non-professional services. In what follows it is assumed that IC’s can move to the location of an EA and report whether that EA has truly experienced a fall or not. This operation is called in what follows verification. Symbol shall be used to represent a verification carried out by agent .
Definition 8 (Device Agent)
Device agents (DA’s) are simple purposefully-behaviored [19] devices (as, e.g., accelerometers, gyroscopes, motion sensors, cameras, combustion detectors, etc.) that are able to provide domotica or telemonitoring services. In particular an accelerometer and a gyroscope DA both trigger an alarm when they ascertain, with a certain probability, that an EA has fallen. Another example of DA is a motion sensor estimating the motion vector of an EA moving in his or her house.
As already mentioned, DA are characterized by a non-zero probability of FP’s and FN’s. Thus for instance in some cases an accelerometer may detect a fall when this is not true, while in some other cases that accelerometer may not detect a true case of fall.
Definition 9 (Mobility Agent)
Mobile agents (MA’s) are agents able to provide extended mobility services to other agents. In what follows a single type of MA is employed, which represents ambulances.
Definition 10 (Community Agent; Canon)
Com- munity agents (CA’s) are agents coordinating a “circle” of other agents. In what follows it is assumed that CA’s implement the set of rules and actions of SoC’s, namely the building blocks of the organizational structure introduced in Sect. 3. The CA rules and coordination actions are called the canon of the FSO [15]. CA’s may be implemented as middleware components as described in, e.g., [4].
4.1 Simulation FSO
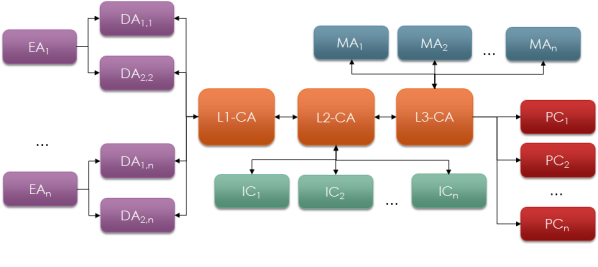
The FSO adopted in our simulations is structured into three concentric levels:
-
1.
The innermost level is constituted by iSoC’s (see Sect. 3) coupling an EA with one or more DA’s that continuously “watch” the EA in order to assess whether a fall event has taken place. Each of the iSoC also includes a CA, called in what follows “L1-CA” (level-1 CA). iSoC’s correspond to primary users of ambient assisted living (AAL) services [17]. They could be visualized, e.g., as a smart house inhabited by an elderly person.
-
2.
The middle level is an SoC that includes the iSoC’s (represented by their L1-CA’s), a number of IC agents, and a coordinating CA. The latter shall be called in what follows “L2-CA” (level-2 CA). This SoC corresponds to primary and secondary users (sensu [17]). The elderly people, their relatives, and a “cloud” of informal carers may be used to visualize the second level of our FSO.
-
3.
The outermost FSO level is constituted by the middle level SoC (represented by its L2-CA), a number of PC and MA agents, and a coordinating CA (“L3-CA”). This SoC represents all the AAL stakeholders in a certain region—including the infrastructures those stakeholder have access to.
As already discussed in Sect. 3, the agents associated with a coordinating CA send it notifications. Whenever there is a need for communication between the CA’s of distinct levels, “exception” messages are triggered. It is assumed that these messages are transmitted reliably and instantaneously. The overall FSO structure is depicted in Fig. 3.
The operation of the FSO is as follows: the EA’s in the innermost iSoC may or may not experience falls. At the same time, the DA’s associated to the EA’s may or may not issue their “fall detected” event. When they do, the event reaches L1-CA.
Four are the major protocols that may be executed:
-
1.
Protocol corresponds to a request for care requiring a PC and a MA. As both roles are missing, this triggers an exception, namely an event for L2-CA. No agents may be enrolled in the middle level of the FSO as that SoC lacks PC and MA agents. As a consequence, a new exception ensues. The event thus reaches L3-CA where agents are enrolled and the readied protocol is finally launched. Because of this, a general practitioner leaves his or her hospital with an ambulance directed to the house the “fail detected” event originated from.
-
2.
Protocol corresponds to a request for verification. As verification requires an IC agent it may be considered as a secondary care intervention. In this case the event is resolved in the middle level of the FSO. Enrollment follows and is launched. The verification step is concluded with either a confirmation or a cancellation of the “fall event”. In the latter case, a “FP event” is issued by the IC agent.
-
3.
As we have just described, an “FP event” takes place in the middle level of the FSO and readies a third protocol, . Said protocol is only used to forward the FP event to the outermost level. To do so, the protocol simply “enrolls” the L3-CA agent. Obviously L2-CA has no actor able to play role L3-CA, thus an exception is raised and delivers the FP event to its intended consignee.
-
4.
The arrival of the FP event at L3-CA triggers a fourth protocol, , which requires no roles and thus immediately cancels .
Canceling a protocol means that, if the protocol is still being executed, its execution is aborted. Actors involved in a canceled protocol are again available for enrollment in readied protocols. In the case of a PC and MA, canceling a protocol makes both agents reach their “base of operation” (i.e., a hospital.)
Note that if the execution of is very fast, the PC and MA may reach the EA sooner than the IC. In a such a case it is that is canceled. If so, the enrolled IC is “freed” and resumes its “random walk” through the virtual world.
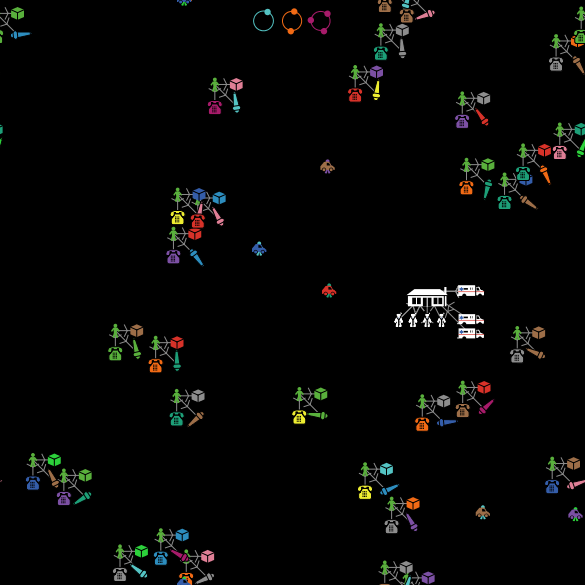
A visualization of the simulation area containing the initialized agents can be seen in Fig. 2. The green “person” shape represents the EA agents, while the connected devices represent the DA’s. The white building represents the hospital, and connected to it we have the MA’s and PC’s.
5 Simulation Scenarios
Here we first introduce in Sect. 5.1 a number of figures used to summarize the results of our simulations. Simulation scenarios are then described in Sect. 5.2.
5.1 Evaluation metrics
Definition 11 (Social Cost)
We shall call social cost (SC) of agent the number of cycles that makes use of to intervene for either a true alarm or a FP.
From its definition it is apparent that, in case of a FP, the social costs associated with the agents responding to the alarm are wasted.
Definition 12 (Cumulative Social Cost ())
Metric is defined as the overall number of cycles used by all of a community’s agents to deal with the true alarms and FP’s experienced during a simulation run.
Definition 13 (Number of Treated Cases)
The number of treated cases ( ) is the total amount of alarms—either true cases or FP—that took place in the course of a simulation run.
Definition 14 (Normalized )
Normalized cumulative social cost ( ) is given by the ratio
Definition 15 (Waiting Time)
Waiting time (WT) is the number of cycles elapsed from the event of a triggered alarm to either of the following events: the arrival of care; the canceling of the care request; confirmation of FP; the end of the simulation run.
Definition 16 (Cumulative Waiting Time ())
is the sum of all the individual WT’s that took place during a simulation run.
Definition 17 (Normalized )
Metric is given by the ratio is given by the ratio
5.2 Scenarios
In our experiments we distinguish two classes of scenarios:
-
In this scenario every EA is “guarded” by a single sensor to monitor for the occurrence of the fall event. IC’s are defined. When , there is no level-2 FSO. Scenario is described through the pseudo-code in Table 1.
As seen in Table 1, the AlarmEvent function keeps track of and returns either the number of ticks necessary to reach the corresponding or the number of ticks until a protocol is executed and the AlarmEvent is interrupted.
| Scenario | // A single DA, zero or more IC agents. | ||||
| Begin | |||||
| // : total amount of FP events | |||||
| // : total amount of FN events | |||||
| // : amount of ticks spent… | |||||
| // …to manage a “fall event” (see Sect. 4) | |||||
| // pF: probability to experience a fall | |||||
| // pFN: probability of a FN event | |||||
| // pFP: probability of a FP event | |||||
| ; | |||||
| For all ticks Do | |||||
| // Toss(pF) returns 1 with probability pF,… | |||||
| // …and 0 with probability 1 - pF | |||||
| TrueFall Toss(pF); | |||||
| If (TrueFall 1) Then | |||||
| // res is 1 with probability pFN | |||||
| res Toss(pFN); | |||||
| If (res 1) Then | |||||
| // (There is a fall) (fall goes undetected) | |||||
| FN ; | |||||
| Else | |||||
| // (There is a fall) (fall is correctly detected) | |||||
| // AlarmEvent returns the number of ticks … | |||||
| // …necessary to reach the fallen EA | |||||
| cost AlarmEvent() | |||||
| // Number of treated cases is updated | |||||
| Endif | |||||
| Else // TrueFall is not set | |||||
| // res is 1 with probability pFP | |||||
| res Toss(pFP); | |||||
| If (res 1) Then | |||||
| // (There is no fall fall) (phantom fall is detected) | |||||
| FP ; | |||||
| // AlarmEvent returns the number of ticks… | |||||
| // …until the EA is reached… | |||||
| // …or until the service is interrupted… | |||||
| // …by a call to protocol . | |||||
| cost AlarmEvent() | |||||
| // Number of treated cases is updated | |||||
| Else | |||||
| // (There is no fall) (no phantom fall is detected) | |||||
| // Thus, do nothing! | |||||
| Endif | |||||
| Endif | |||||
| + FN; | |||||
| + FP; | |||||
| + cost; | |||||
| Enddo | |||||
| End |
In scenario and we consider the following configuration of agents:
-
•
30 EA’s residing in their houses. House locations are assigned in cells chosen pseudo-randomly in the virtual world. The same distribution of cells is used in each run of the simulations.
-
•
1 hospital (Level 3 CA), located in a cell chosen as described above.
-
•
6 PC’s and 5 MA’s (ambulances) are located with the hospital.
We assume a certain probability of an actual “fall event”. Let us call pF said probability. In what follows, .
Once an actual fall takes place, we shall call pFN the probability that that fall shall not be detected. Likewise, every time a fall does not take place, we shall call pFP the probability that a fall is (erroneously) detected.
It is important to highlight how pFN and pFP are normally specific of a given sensor; to facilitate the description of our experiments, in what follows we shall assume that both and have the same pFN and pFP, respectively equal to and . Corresponding events are assumed to be independent of each other (in other words, there is no correlation between those events).
| Scenario | // Two DA’s, zero or more IC agents. | ||||
| Begin | |||||
| // : total amount of FP events | |||||
| // : total amount of FN events | |||||
| // : amount of ticks spent… | |||||
| // …to manage a “fall event” (see Sect. 4) | |||||
| // pF: probability to experience a fall | |||||
| // pFN: probability of a FN event for both and | |||||
| // pFP: probability of a FP event for either or | |||||
| , , ; | |||||
| For all ticks Do | |||||
| // Toss(pF) returns 1 with probability pF,… | |||||
| // …and 0 with probability 1 - pF | |||||
| TrueFall Toss(pF); | |||||
| If (TrueFall 1) Then | |||||
| : | res Toss(pFN); | ||||
| If (res 1) Then | |||||
| // (There is a fall) (fall is undetected by ) | |||||
| ; | |||||
| Else | |||||
| // (There is a fall) (fall is correctly detected by ) | |||||
| // AlarmEvent returns the number of ticks… | |||||
| // …necessary to reach the fallen EA | |||||
| cost AlarmEvent(); | |||||
| // Number of treated cases is updated | |||||
| Endif | |||||
| : | res Toss(pFN); | ||||
| If (res 1) Then | |||||
| // (There is a fall) (fall is undetected by ) | |||||
| ; | |||||
| Else | // (There is a fall) (fall is correctly detected by ) | ||||
| // If the fall was not already detected by … | |||||
| If () Then | |||||
| cost AlarmEvent(); | |||||
| Endif | |||||
| Endif | |||||
| FN ; | |||||
| ResetAllFlags(); | |||||
| Else // TrueFall is not set | |||||
| : | res Toss(pFP); | ||||
| If (res 1) Then | |||||
| // (There is no fall) (phantom fall is detected by ) | |||||
| ; | |||||
| Endif | |||||
| : | res Toss(pFP); | ||||
| If (res 1) Then | |||||
| // (There is no fall) (phantom fall is detected by ) | |||||
| ; | |||||
| Endif | |||||
| FP ; | |||||
| If (FP 1) Then | |||||
| // AlarmEvent returns the number of ticks… | |||||
| // …until the EA is reached or until the… | |||||
| // …service is interrupted by a call to . | |||||
| cost AlarmEvent(); | |||||
| Endif | |||||
| Endif | |||||
| ; ; | |||||
| ; | |||||
| ResetAllFlags(); | |||||
| Enddo | |||||
| End |
We now describe the results obtained in scenarios , , and .
6 Results
Experiments are run for to 40 by increasing by five IC’s per experiment. Each experiment lasts 10000 “ticks”. Results for the scenarios are shown in Table 3 while for the scenarios they are shown in Table 4.
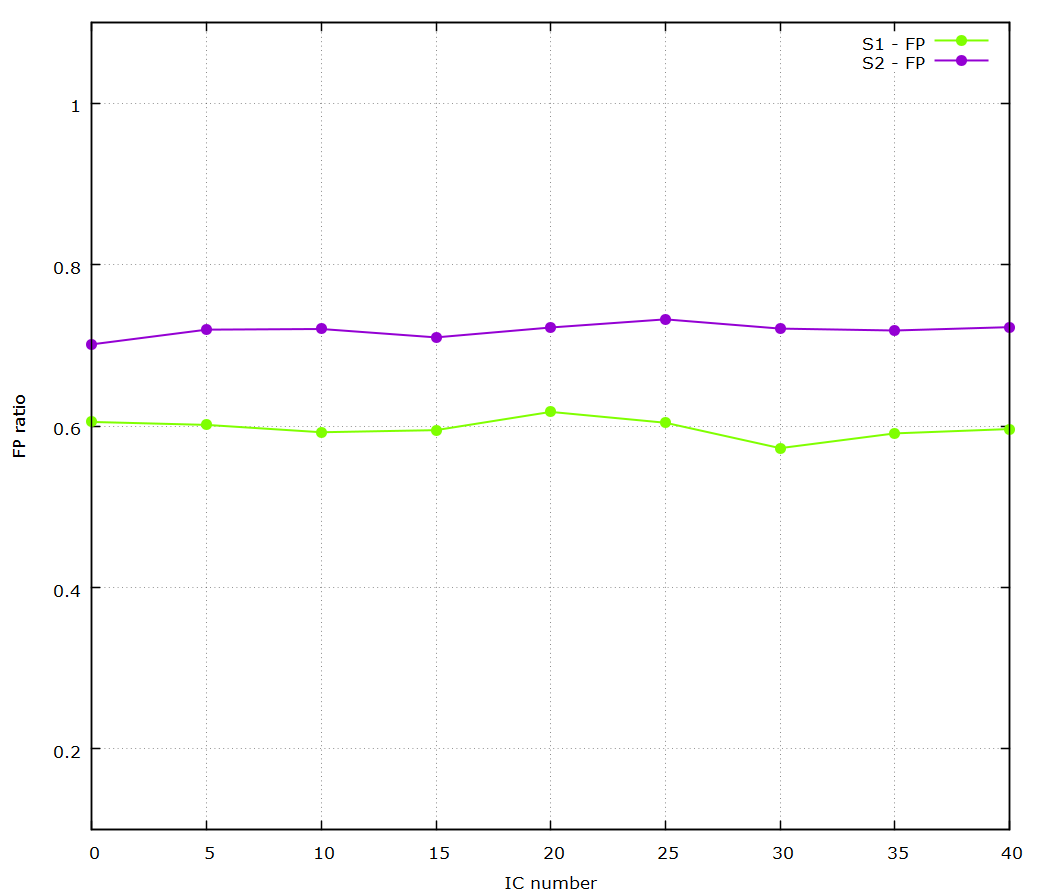
Let us first consider FP, FN, Sensitivity, and Specificity. If we compare scenario to without IC’s we can observe that in the number of FP’s increases by more than 100 FP units. This is due to the addition of a second DA: as can be seen from Table 2, with two DA’s the alarm is triggered as a result of an OR operation of the alarms of each DA [7]. Moreover, by increasing we can observe that FP events increase too. This is because the higher the number of IC’s, the sooner validation will occur.
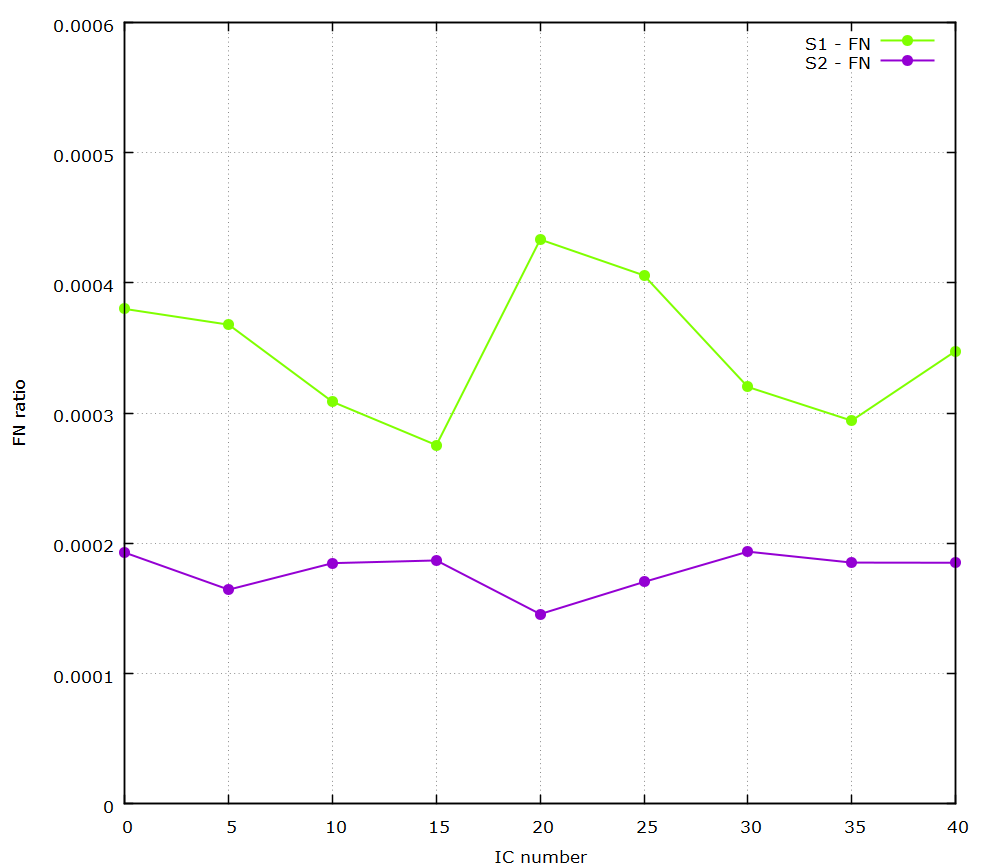
The FN values in are almost thrice those in for . This is because in an AND operation is performed between the FN outcome of DA1 and DA2 (see again Table 2). As a result the probability of having a FN decreases in , and only when we have a FN from both alarms the FN is reported. With we see that the addition of IC’s doesn’t produce improvements. This is because in our simulation models IC’s cannot identify FN’s. The graph in Figure 5 depicts the FP ratios of , and with various number of IC’s. The FN ratios are visualized in Figure 6.
A larger number of alarms and a smaller number of FN’s translates into a more sensitive system. This is because by triggering more alarms, more cases where the alarm is truly positive are covered. On the other hand, there is no difference observed with regard to the specificity parameter for each scenario. From the results in Table 3 and Table 4 we see that in , with or without volunteers, the average sensitivity is 79.55%, while for it increases to an average of 89.92%. The Specificity values stay the same for all scenarios with an average close to 99%.
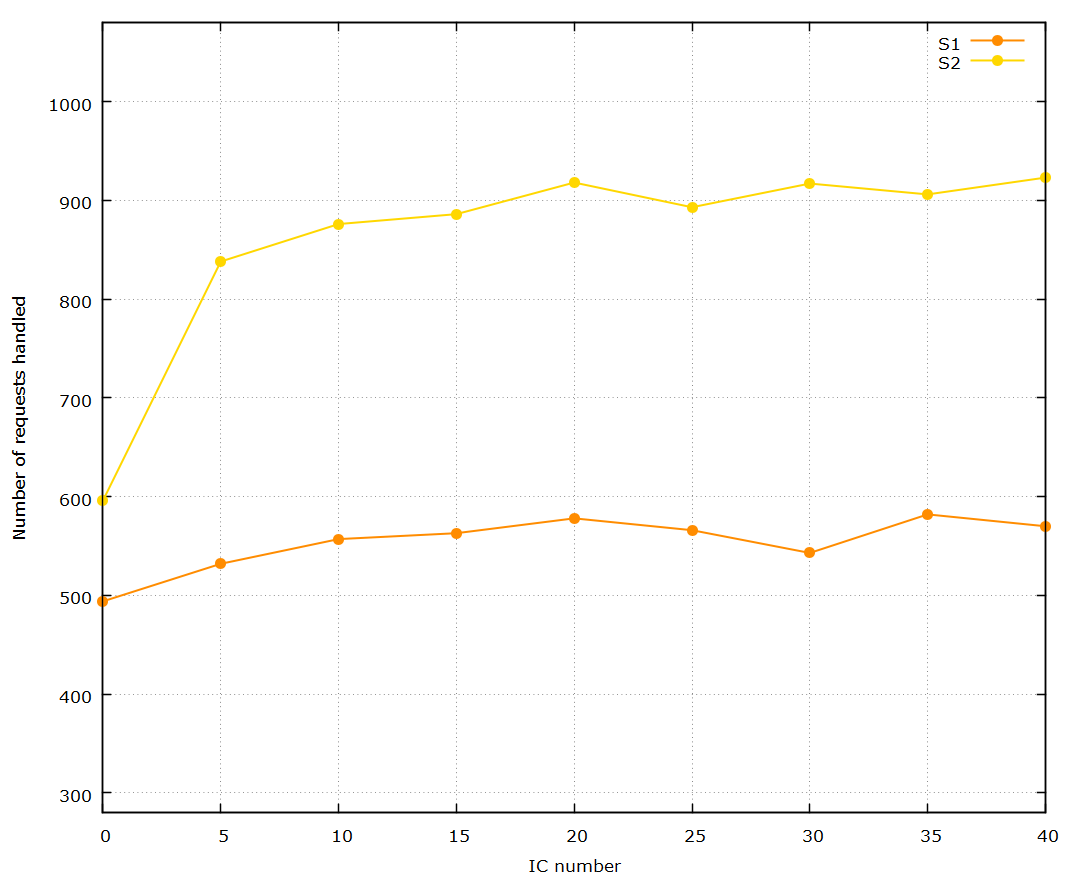
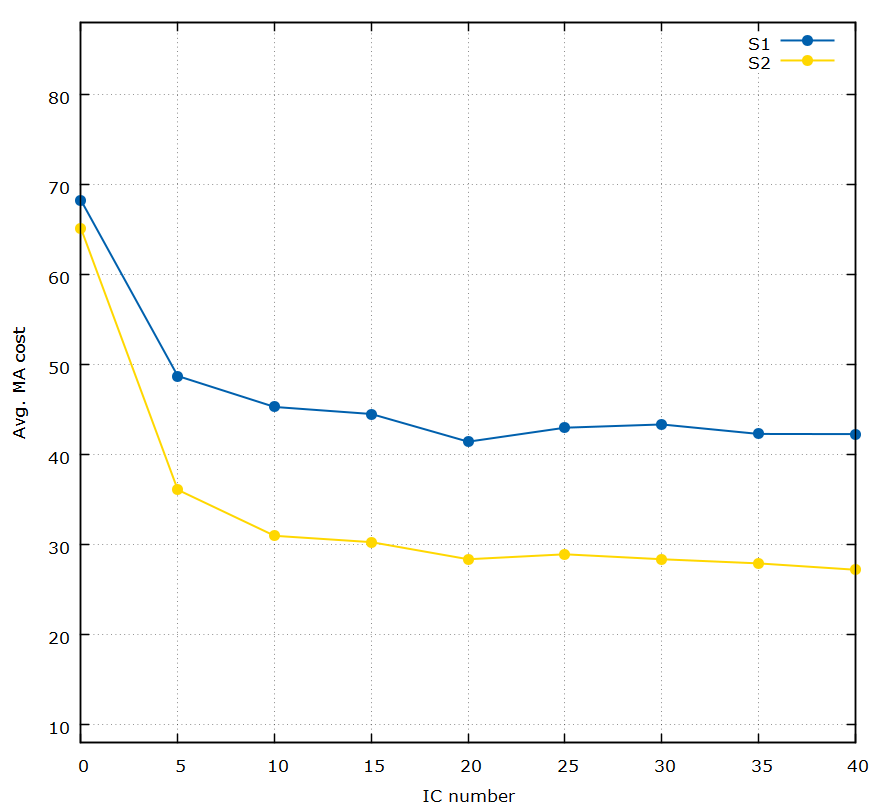
We now focus our attention to social costs. If we compare with the case where IC’s are added, we observe a significant decrease in the cost of MA’s. This is because the IC’s help verifying the actual condition of the EA agents, thus reducing the cost of MA’s. The same applies for the scenarios. Figure 7 depicts the relation between and for both scenarios. In the case of , the minimum is reached for 20 IC’s after which average social cost appears to stabilize. Another metric that shows the impact of IC’s in the MA cost is the number of alarm verification’s. In all scenarios where IC’s are present the number of verifications performed by means of MA’s is reduced drastically.
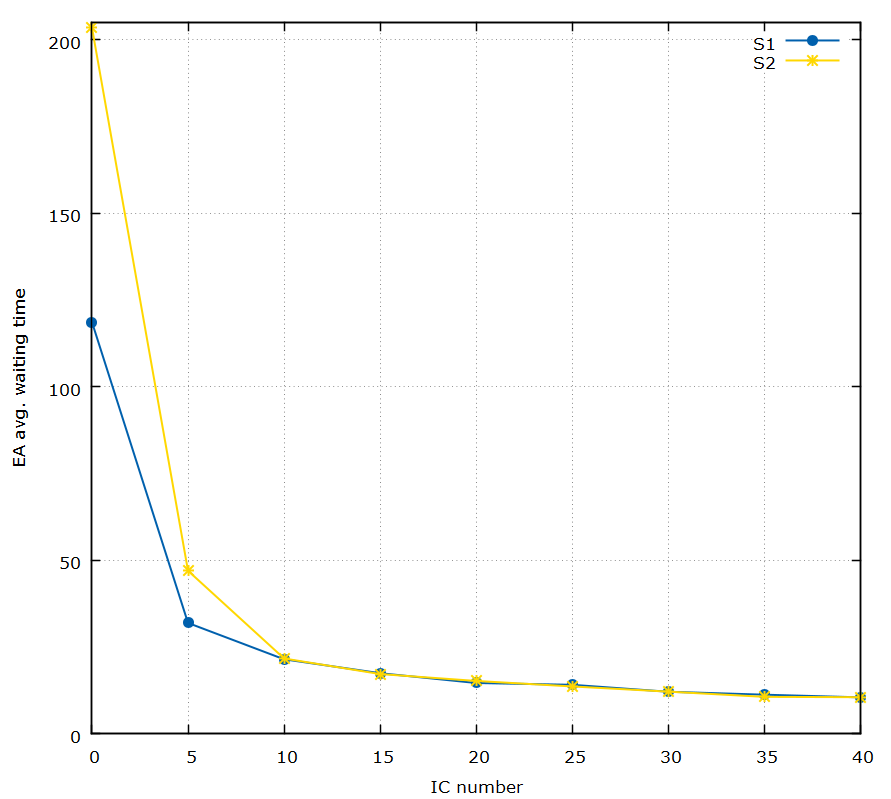
A significant metric is the average time until a triggered alarm for an EA gets verified, namely . The average waiting time reflects the reaction time of the system for a given event. The best results are obtained with 10 IC’s. Additional effort beyond this value produces little improvement. With 10 IC’s no significant differences are observed between and . A graph showing the average waiting time in function of the number of IC’s is given in Fig. 8.
We can conclude that the involvement of IC agents in the fall identification system using the FSO model helps reducing the social costs, while at the same time the average response time to fall events is reduced. Moreover, it transpires that the involvement of IC agents is beneficial up to some threshold—possibly in function of the dimensions of the virtual word and other simulation parameters.
More and more complex experiments shall follow. In particular we plan to explore the relation between the exhibited amount of social cooperation and an organization’s ability to deliver and sustain a given state of “welfare”.
| FP | 299 | 320 | 330 | 335 | 357 | 342 | 311 | 344 | 340 |
|---|---|---|---|---|---|---|---|---|---|
| FN | 56 | 63 | 51 | 46 | 74 | 68 | 52 | 48 | 58 |
| TP | 195 | 212 | 227 | 228 | 221 | 224 | 232 | 238 | 230 |
| TN | 147313 | 171175 | 165171 | 166988 | 170681 | 167515 | 162385 | 163097 | 166825 |
| Avg. FP/tick | 0.0299 | 0.032 | 0.033 | 0.0335 | 0.0357 | 0.0342 | 0.0311 | 0.0344 | 0.034 |
| Avg. FN/tick | 0.0056 | 0.0063 | 0.0051 | 0.0046 | 0.0074 | 0.0068 | 0.0052 | 0.0048 | 0.0058 |
| FP rate | 0.6052 | 0.6015 | 0.5924 | 0.595 | 0.6176 | 0.6042 | 0.5727 | 0.591 | 0.5964 |
| FN rate | 0.00038 | 0.00037 | 0.00031 | 0.00027 | 0.00043 | 0.0004 | 0.00032 | 0.00029 | 0.00035 |
| Sensivity | 77.68 | 77.09 | 81.65 | 83.21 | 74.91 | 76.71 | 81.69 | 83.21 | 79.86 |
| Specificity | 99.79 | 99.81 | 99.8 | 99.79 | 99.79 | 99.79 | 99.8 | 99.78 | 99.79 |
| (MA) | 33720 | 25928 | 25230 | 25062 | 23951 | 24333 | 23541 | 24619 | 24102 |
| (IC) | 0 | 0 | 11351 | 9252 | 7874 | 7414 | 6023 | 5963 | 5400 |
| 58617 | 16981 | 11943 | 9815 | 8451 | 7980 | 6565 | 6545 | 5969 | |
| 494 | 532 | 557 | 563 | 578 | 566 | 543 | 582 | 570 | |
| (IC) | 0 | 472 | 540 | 555 | 576 | 566 | 540 | 582 | 568 |
| (MA | 296 | 33 | 8 | 6 | 0 | 0 | 1 | 0 | 0 |
| (MA) | 193 | 211 | 225 | 227 | 220 | 222 | 231 | 235 | 230 |
| (MA) | 68.259 | 48.737 | 45.296 | 44.515 | 41.438 | 42.991 | 43.353 | 42.301 | 42.284 |
| 118.658 | 31.919 | 21.442 | 17.433 | 14.621 | 14.099 | 12.09 | 11.246 | 10.472 |
| FP | 418 | 603 | 631 | 629 | 663 | 654 | 661 | 651 | 667 |
|---|---|---|---|---|---|---|---|---|---|
| FN | 20 | 24 | 29 | 29 | 23 | 28 | 31 | 30 | 30 |
| TP | 178 | 235 | 245 | 257 | 255 | 239 | 256 | 255 | 256 |
| TN | 103699 | 145952 | 156918 | 155168 | 157907 | 164355 | 160108 | 161965 | 162078 |
| Avg. FP/tick | 0.0418 | 0.0604 | 0.0631 | 0.0629 | 0.0663 | 0.0654 | 0.0661 | 0.0651 | 0.0667 |
| Avg. FN/tick | 0.002 | 0.0024 | 0.0029 | 0.0029 | 0.0023 | 0.0028 | 0.0031 | 0.003 | 0.003 |
| FP rate | 0.7013 | 0.7195 | 0.7203 | 0.7099 | 0.7222 | 0.7323 | 0.7208 | 0.7185 | 0.7226 |
| FN rate | 0.00019 | 0.00016 | 0.00018 | 0.00019 | 0.00015 | 0.00017 | 0.00019 | 0.00018 | 0.00018 |
| Sensivity | 89.89 | 90.73 | 89.41 | 89.86 | 91.72 | 89.51 | 89.19 | 89.47 | 89.51 |
| Specificity | 99.59 | 99.58 | 99.59 | 99.59 | 99.58 | 99.6 | 99.58 | 99.59 | 99.59 |
| (MA) | 38819 | 30249 | 27141 | 26829 | 26054 | 25832 | 26026 | 25296 | 25116 |
| (IC) | 0 | 33426 | 18114 | 14344 | 13048 | 11269 | 10199 | 8723 | 8785 |
| 121316 | 39364 | 18986 | 15229 | 13965 | 12160 | 11113 | 9628 | 9707 | |
| 596 | 838 | 876 | 886 | 918 | 893 | 917 | 906 | 923 | |
| (IC) | 0 | 745 | 824 | 877 | 913 | 887 | 913 | 904 | 922 |
| (MA) | 420 | 67 | 37 | 5 | 2 | 3 | 1 | 1 | 0 |
| (MA) | 161 | 219 | 228 | 235 | 237 | 226 | 239 | 232 | 232 |
| (MA) | 65.133 | 36.097 | 30.983 | 30.281 | 28.381 | 28.927 | 28.382 | 27.921 | 27.211 |
| 203.55 | 46.974 | 21.673 | 17.188 | 15.212 | 13.617 | 12.119 | 10.627 | 10.517 |
7 Conclusions
We are greatly frustrated
by all our local, static organization
of an obsolete yesterday.Richard Buckminster Fuller,
Synergetics I
Traditional organizations are today confronted with unprecedented scenarios. As an example, the aging of the population, and even more the chronic diseases associated with aging place substantial demands on health and social care services. On the other hand, the “old recipes”, which appeared to work in a less turbulent context, now reveal all their limitations. Traditional healthcare services, even when backed by the most advanced ICT, find it difficult to meet the ensuing ever increasing demand while guaranteeing both safety and cost-effectiveness. As observed by Buckminster Fuller, this is mainly due the inflexible and static organization of those services. As observed, e.g., in [12], the new context “requires new ways of working.”
In this article we demonstrate one such way. By integrating the cost-effective context detection abilities of telecare devices with the superior cognitive functions of human beings we showed how it is possible to improve, to some extent and under certain conditions, the performance and quality of a health-critical service. Our preliminary results indicate that distributed and dynamic organizations able to tap into the wells of “social energy” [3, 5, 9] of our societies may constitute the basis for novel, smarter solutions to the new problems of our ever more complex world.
Our future experiments will aim at understanding how the size of the virtual world and the distribution of agents influence the results. For this we are considering to design an ad hoc simulator privileging performance to graphical rendering.
References
- [1] A. Bourke, P. Ven, M. Gamble, R. O’Connor, K. Murphy, E. Bogan, E. McQuade, P. Finucane, G. Olaighin, and J. Nelson. Evaluation of waist-mounted tri-axial accelerometer based fall-detection algorithms during scripted and continuous unscripted activities. Journal of Biomechanics, 43(15):3051–3057, 2010.
- [2] D. Cusano and T. Doris. Accelerometers, false positives/negatives and fall detection. http://telecareaware.com/accelerometers-false-positivesnegatives-and-fall-detection/#sthash.1wVQjfqu.dpuf, September 2014. [Online; accessed 24-August-2015].
- [3] V. De Florio. Quality Indicators for Collective Systems Resilience. Emergence: Complexity & Organization, 16(3), September 2014.
- [4] V. De Florio, M. Bakhouya, A. Coronato, and G. Di Marzo Serugendo. Models and concepts for socio-technical complex systems: Towards fractal social organizations. Systems Research and Behavioral Science, 30(6), 2013.
- [5] V. De Florio and C. Blondia. Service-oriented communities: Visions and contributions towards social organizations. In R. Meersman, T. Dillon, and P. Herrero, editors, On the Move to Meaningful Internet Systems: OTM 2010 Workshops, volume 6428 of Lecture Notes in Computer Science, pages 319–328. Springer Berlin / Heidelberg, 2010.
- [6] V. De Florio, A. Coronato, M. Bakhouya, and G. Di Marzo Serugendo. Service-oriented communities: Models and concepts towards fractal social organizations. In Proceedings of the 8th International Conference on signal, image technology and internet based systems (SITIS 2012). IEEE, 2012.
- [7] V. De Florio, S. Donatelli, and G. Dondossola. Flexible development of dependability services: An experience derived from energy automation systems. In Proc. of the 9th Annual IEEE International Conference and Workshop on the Engineering of Computer Based Systems (ECBS), Lund, Sweden, April 2002. IEEE Comp. Soc. Press.
- [8] V. De Florio and A. Pajaziti. How resilient are our societies? analyses, models, and preliminary results. In Complex Systems (WCCS), 2015 Third World Conference on. IEEE, 2015.
- [9] V. De Florio, H. Sun, and M. Bakhouya. Mutualistic relationships in service-oriented communities and fractal social organizations. In Complex Systems (WCCS), 2014 Second World Conference on, pages 756–761. IEEE, 2014.
- [10] E. W. Dijkstra. Guarded commands, nondeterminacy and formal derivation of programs. Communications of the ACM, 18(8):453–457, 1975.
- [11] N. El-Bendary, Q. Tan, F. C. Pivot, and A. Lam. Fall detection and prevention for the elderly: a review of trends and challenges. International Journal on Smart Sensing and Intelligent Systems, 6(3), 2013.
- [12] K. Taylor. Primary care: Working differently telecare and telehealth—a game changer for health and social care. Technical report, Deloitte Centre for Health Solutions, \url{http://www2.deloitte.com/content/dam/Deloitte/uk/Documents/life-sciences-health-care/deloitte-uk-telehealth-telecare.pdf}, 2012. [Online; accessed 26-August-2014].
- [13] T. Froehlich. Persistence of vision raytracer on-line documentation repository. http://wiki.povray.org/content/Documentation:Contents, 2012. [Online; accessed 19-July-2014].
- [14] Q. T. Huynh, U. D. Nguyen, S. V. Tran, A. Nabili, and B. Q. Tran. Fall detection system using combination accelerometer and gyroscope. In Proc. of the Second Int.l Conf. on Advances in Electronic Devices and Circuits (EDC 2013), 2013.
- [15] A. Koestler. The Ghost in the Machine. Macmillan, 1967.
- [16] A. H. Maslow. The Psychology of Science: A Reconnaissance. Harper & Row, New York, 1966.
- [17] C. Nedopil, C. Schauber, and S. Glende. Knowledge base — AAL stakeholders and their requirements. Technical report, Ambient Assisted Living Association, Brussels, 12 2013.
- [18] OASIS. Web services base notification 1.3 standard. Technical report, OASIS, 2006.
- [19] A. Rosenblueth, N. Wiener, and J. Bigelow. Behavior, purpose and teleology. Philosophy of Science, 10(1):18–24, 1943.
- [20] H. Sun, V. De Florio, and C. Blondia. Implementing a role based mutual assistance community with semantic service description and matching. In Proc. of the Int.l Conference on Management of Emergent Digital EcoSystems (MEDES), October 2013.
- [21] I. Tëmkin and N. Eldredge. Networks and hierarchies: Approaching complexity in evolutionary theory. In E. Serrelli and N. Gontier, editors, Macroevolution: Explanation, Interpretation, Evidence. Springer, 2014.
- [22] S. Tisue and U. Wilensky. NetLogo: a simple environment for modeling complexity. In Proc. of the Int.l Conf. on Complex Systems, 2004.