Star-Forming Brightest Cluster Galaxies at : A Transitioning Fuel Supply
Abstract
We present a multi-wavelength study of 90 brightest cluster galaxies (BCGs) in a sample of galaxy clusters selected via the Sunyaev Zel’dovich effect by the South Pole Telescope, utilizing data from various ground- and space-based facilities. We infer the star formation rate (SFR) for the BCG in each cluster, based on the UV and IR continuum luminosity, as well as the [O ii]3726,3729 emission line luminosity in cases where spectroscopy is available, finding 7 systems with SFR 100 M⊙ yr-1. We find that the BCG SFR exceeds 10 M⊙ yr-1 in 31 of 90 (34%) cases at , compared to 1–5% at from the literature. At , this fraction increases to 92%, implying a steady decrease in the BCG SFR over the past 9 Gyr. At low-, we find that the specific star formation rate in BCGs is declining more slowly with time than for field or cluster galaxies, most likely due to the replenishing fuel from the cooling ICM in relaxed, cool core clusters. At , the correlation between cluster central entropy and BCG star formation – which is well established at – is not present. Instead, we find that the most star-forming BCGs at high- are found in the cores of dynamically unrelaxed clusters. We investigate the rest-frame near-UV morphology of a subsample of the most star-forming BCGs using data from the Hubble Space Telescope, finding complex, highly asymmetric UV morphologies on scales as large as 50–60 kpc. The high fraction of star-forming BCGs hosted in unrelaxed, non-cool core clusters at early times suggests that the dominant mode of fueling star formation in BCGs may have recently transitioned from galaxy-galaxy interactions to ICM cooling.
Subject headings:
galaxies: clusters: general – galaxies: clusters: intracluster medium – galaxies: elliptical and lenticular, cD – galaxies: starburst – X-rays: galaxies: clusters1. Introduction
One of the great mysteries in astronomy today is why 90% of the baryons in the Universe, which are in diffuse gas with relatively short cooling times (e.g., Shull et al., 2012), have not cooled and formed stars. This inefficient star formation manifests as a significant disagreement between the predicted galaxy luminosity function from CDM cosmological simulations and that observed in the local Universe. In the most massive galaxies in the Universe, which are found at the centers of rich galaxy clusters, this disagreement is maximized, with central cluster galaxies being substantially less massive than predicted by simple models (see review by Silk & Mamon, 2012). This has become known as the “cooling flow problem” and can be stated simply as: “Why, given the short cooling time of the intracluster medium in the cores of some galaxy clusters, do we not observe massive starburst galaxies at the centers of these clusters?”.
Over the past couple of decades, much effort has been devoted to answering this question. Early work focused on searching for multiphase gas and star formation in brightest cluster galaxies (BCGs). Numerous studies have found evidence for ultraviolet (UV) and infrared (IR) continuum (e.g., McNamara & O’Connell, 1989; Hicks & Mushotzky, 2005; O’Dea et al., 2008; McDonald et al., 2011b; Hoffer et al., 2012; Fraser-McKelvie et al., 2014; Donahue et al., 2015), warm, ionized gas (e.g., Hu et al., 1985; Johnstone et al., 1987; Heckman et al., 1989; Crawford et al., 1999; Edwards et al., 2007; Hatch et al., 2007; McDonald et al., 2010, 2011a), and both warm and cold molecular gas (e.g., Jaffe & Bremer, 1997; Donahue et al., 2000; Edge, 2001; Edge et al., 2002; Edge & Frayer, 2003; Salomé & Combes, 2003; Hatch et al., 2005; Jaffe et al., 2005; Johnstone et al., 2007; Oonk et al., 2010; McDonald et al., 2012b) – all of which are indicative of ongoing or recent star formation. Star-forming BCGs were found preferentially in galaxy clusters with “cool cores”, as identified by a central density enhancement in the ICM (e.g., Vikhlinin et al., 2007; Santos et al., 2008; Hudson et al., 2010) or low central entropy/cooling time (e.g., Cavagnolo et al., 2008, 2009; Hudson et al., 2010). These and other works established a link between the cooling ICM and the presence of multiphase gas, suggesting that cooling flows may indeed be fueling star formation in BCGs. However, the typical star formation rates inferred from a variety of indicators were found to be only 1% of the expected ICM cooling rate (e.g., O’Dea et al., 2008). Roughly one of the two orders of magnitude in this disagreement can be accounted for by inefficient star formation (McDonald et al., 2014a), however a further order-of-magnitude disagreement between the cooling predictions and observations still remains.
Some form of feedback is necessary to prevent the bulk (90%) of the cooling ICM from becoming fuel for star formation. The leading candidate is “radio-mode” feedback (see reviews by Fabian, 2012; McNamara & Nulsen, 2012) from active galactic nuclei (AGN), which are ubiquitous at the centers of cool core clusters (Sun, 2009). The mechanical energy output from these AGN are sufficient to offset cooling on large scales, preventing runaway cooling in the majority of clusters (e.g., Bîrzan et al., 2004; Rafferty et al., 2008; Hlavacek-Larrondo et al., 2012, 2014) with a few notable exceptions (McNamara et al., 2006; McDonald et al., 2012c). The low levels of star formation and gas in multiphase filaments are understood to be local thermodynamic instabilities (e.g., Sharma et al., 2010; Gaspari et al., 2012; McCourt et al., 2012; Voit & Donahue, 2015) in regions where, locally, cooling dominates over feedback, despite the overall global balance. These star formation rates, which average a few M⊙ yr-1, may contribute a few percent to the total stellar mass of the BCG over the past 8 Gyr – the majority of the growth in these systems likely comes from “dry mergers” (mergers of gas-poor galaxies), which increase the stellar mass by a factor of 2 from to (Ruszkowski & Springel, 2009).
The picture presented here is based almost entirely on observations of nearby () galaxy clusters. This is, in part, due to the fact that these clusters are more easily studied because of their proximity (improved signal-to-noise, angular resolution, etc). Equally important, however, is the scarcity of well-understood samples of high-redshift galaxy clusters. Until recent years there were few samples of galaxy clusters with known masses at – surveys that did probe high redshift clusters were generally flux-limited or were assembled from serendipitous detections via a heterogeneous collection of methods. With the advent of large-area mm-wave surveys utilizing the Sunyaev Zel’dovich (SZ) effect (Sunyaev & Zeldovich, 1972) to detect galaxy clusters, this situation has changed dramatically over the past several years, with the latest surveys achieving nearly redshift-independent detection of clusters above a fixed mass threshold at . Most recently, the completed 2500 deg2 SZ survey with the South Pole Telescope (SPT; Carlstrom et al., 2011) has discovered more than 500 massive galaxy clusters, the majority of which are at (Bleem et al., 2015). In this work, we focus on a subsample of this survey which has been targeted for X-ray follow-up (McDonald et al., 2013b) and spans a redshift range of . The availability of optical photometry and spectroscopy for the majority of the BCGs in this sample, along with archival UV (GALEX) and IR (WISE) data allows us to study star formation in BCGs at high redshift for a complete, mass-selected sample.
The remainder of this paper is structured as follows. In §2 we define the sample used in this work, and present the multiwavelength data and analysis techniques that will enable us to identify star-forming BCGs. In §3 we isolate the sample of star-forming BCGs and attempt to determine whether there is any evolution in their properties or the properties of their host clusters. In §4 we discuss these results, addressing bias and selection concerns, while trying to draw a broad picture of galaxy and galaxy cluster evolution within which these results fit. We finish in §5 with a brief summary of the important results of this work, and a look toward the future. Throughout this work we assume H0 = 70 km s-1 Mpc-1, = 0.27, = 0.73, and a Salpeter (1955) initial mass function (IMF).
2. Data & Analysis
2.1. Cluster Sample and BCG Selection
We initially define the sample to include all 83 clusters from McDonald et al. (2013b), which were selected from the SPT 2500 deg2 survey (Bleem et al., 2015) and subsequently observed in the X-ray with the Chandra X-ray Observatory. To this sample, we add an additional 8 clusters from Bleem et al. (2015) that have archival Chandra data from other sources (SPT-CLJ0106-5943, SPT-CLJ0232-4421, SPT-CLJ0235-5121, SPT-CLJ0516-5430, SPT-CLJ0522-4818, SPT-CLJ0658-5556, SPT-CLJ2011-5725, SPT-CLJ2332-5053). X-ray data products, such as central entropy (K0), are presented for this full sample of 91 clusters in McDonald et al. (2013b) – we direct the reader there for a full description of our X-ray methodology.
For each cluster, we have obtained some combination of ground-based optical imaging, ground-based J, H, K near-IR imaging, and Spitzer IRAC 3.6m, 4.5m imaging, as described in detail in Bleem et al. (2015). These data have been used to provide optical confirmation of the SZ-selected clusters, and to estimate a photometric redshift based on the member galaxy colors. We remove from our sample all clusters for which the optical-IR follow-up was performed in 2 filters, preventing a reliable fit to the stellar continuum. After this cut, we were left with a sample of 82 clusters. From this follow-up imaging, we select the BCG111We note here that the term “BCG” is largely inappropriate for this work, since there may be brighter galaxies within the virial radius (e.g., AGN). The more appropriate monicker would be “central cluster galaxy”, but we opt for BCG throughout this paper since it is more commonly used. initially as the brightest red-sequence galaxy within an aperture of R200 centered on the SZ peak, following Song et al. (2012). We then visually inspect each cluster and select a new BCG if one, or both, of two conditions are met: i) there is a similarly-bright galaxy that is significantly closer to the X-ray peak (29% of systems); ii) there is a bright blue galaxy on or near the X-ray peak that was not selected due to our initial preference for red galaxies (3% of systems). Wherever possible, we use HST imaging from the SPT weak-lensing follow-up programs with IDs 12246, 12477, 13412 (PIs: Stubbs, High, Schrabback) to aid in the visual identification of the BCG.
In all cases where it was not clear which galaxy was the BCG, we retain the original red BCG, allowing for two BCGs in these clusters. In this case, we give each BCG a 50% weight when performing statistical analysis and include the limiting cases in our error estimates (i.e., upper limit contains star-forming BCG, lower limit contains passive BCG). This procedure resulted in a sample of 90 BCGs in 82 clusters. The net effect of allowing multiple BCGs in cases where identification of a single object was challenging is to increase our uncertainties, increasing the likelihood that the “true” answer lies without our error bars.
2.2. X-ray Analysis: Central Entropy and Luminosity
Several studies have found correlations between the amount of star formation in the BCG and the core entropy (e.g., Cavagnolo et al., 2008; O’Dea et al., 2008; Voit et al., 2015) and luminosity-derived cooling rate (e.g., Crawford et al., 1999; O’Dea et al., 2008; McDonald et al., 2010, 2011b). This has led to the conclusion that star formation is being fueled in the BCG by residual cooling flows (Voigt & Fabian, 2004; Tremblay et al., 2012; McDonald et al., 2014a). In order to test whether this trend was established at high-, we require estimates of the core entropy and cooling rate for each cluster. Given that we only have 2000 X-ray counts per cluster, modeling the central entropy (e.g., Cavagnolo et al., 2009) or estimating the spectroscopically-derived cooling rate (e.g., Voigt & Fabian, 2004) is not feasible. Instead, we compute spectroscopic quantities (bolometric luminosity, temperature) from a circular aperture with radius of 0.075 R500 (where R500 was derived based on the YX–M500 relation of Vikhlinin et al., 2009), which should roughly correspond to the deprojected core temperature (see e.g., McDonald et al., 2014b). X-ray spectra extracted from this aperture are modeled with a photometric absorption (phabs) and plasma (apec) model, allowing the temperature, metallicity, and normalization of the plasma model to vary. This choice of aperture is meant to capture the “core” properties, reflecting the realistic fuel reservoir that the BCG may have access to.
The “central” density is computed based on the deprojected X-ray surface brightness profile, following Vikhlinin et al. (2006) and McDonald et al. (2013b). Since the measurement of electron density requires far fewer X-ray counts than the measurement of spectroscopic temperature, the central density is measured at R500, or roughly 10 kpc for a typical cluster in this sample. We combine the projected core temperature and deprojected core density to arrive at a pseudo-deprojected core entropy ().
Unlike our previous work (McDonald et al., 2013b), here we measure “central” quantities at the X-ray peak, rather than the large-scale centroid. In general, the BCG is located closer to the X-ray peak than the centroid in cases of merging clusters, which motivated this choice. We will discuss in later sections the effects of this choice. For a more detailed description of our X-ray analysis techniques, we direct the reader to McDonald et al. (2013b) and McDonald et al. (2014b).
2.3. UV–Optical–IR Photometry and SED Modeling
Ground-based optical and/or near-infrared imaging for all clusters in this sample have been obtained at a variety of wavelengths as part of a confirmation and photometric redshift follow-up campaign. The acquisition, reduction, and calibration of these data are presented in detail in Song et al. (2012) and Bleem et al. (2015). Aperture photometry for the BCG was obtained from SExtractor (Bertin & Arnouts, 1996), following Song et al. (2012) and Bleem et al. (2015).
In addition to these existing data, we have acquired new ground-based -band imaging with Megacam (McLeod et al., 2015) on the Magellan Clay telescope for 49 clusters in this sample. These 49 clusters were those that had the least restrictive upper limits on the BCG SFR at other wavelengths, generally lacking in spectroscopic or deep GALEX coverage. The exposure time for these observations was chosen to provide an overall sensitivity of our survey to obscured star formation rates of 10 M⊙ yr-1 – without these additional data, our sensitivity limit would vary significantly with redshift. These data were reduced using the standard photometric pipeline described in Bleem et al. (2015).
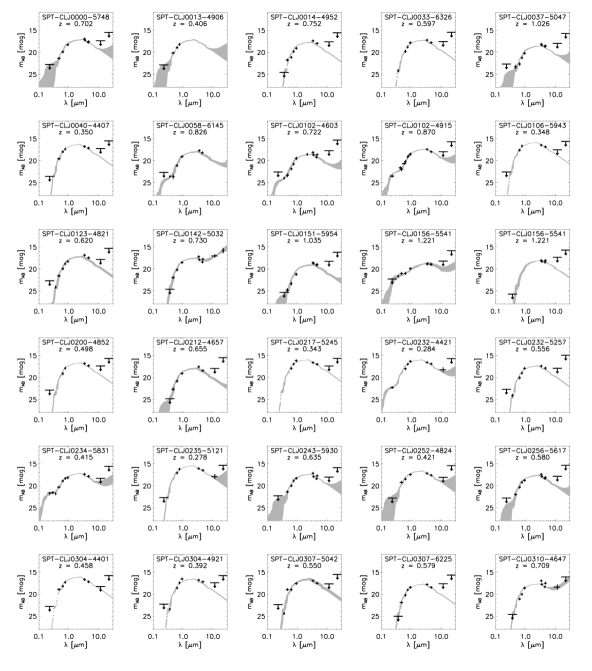
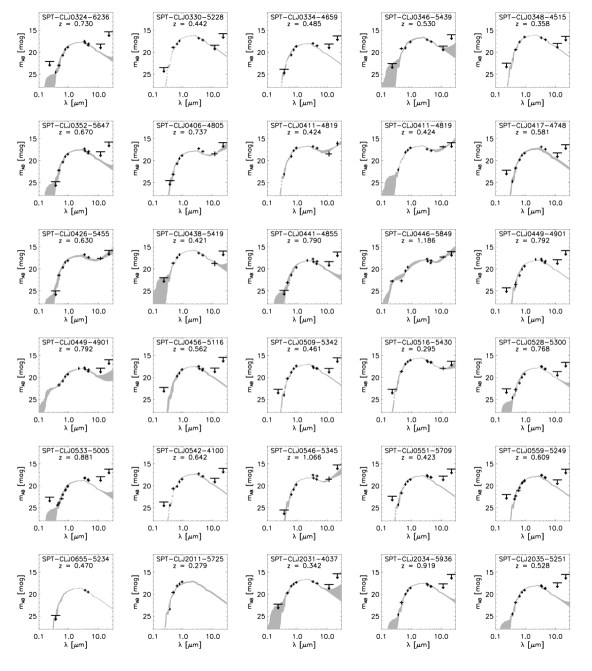
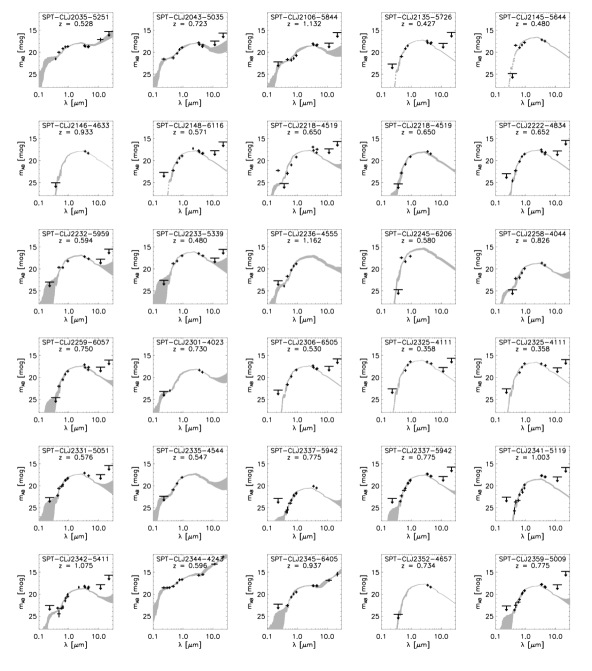
The position of each BCG was cross-referenced with the GALEX222http://galex.stsci.edu/GR6/ (Morrissey et al., 2007) and WISE333http://irsa.ipac.caltech.edu/Missions/wise.html (Wright et al., 2010) archives, assuming a maximum offset of 2′′, from which we obtained near-UV (NUV) and near–mid IR (NIR, MIR) photometry for each BCG. If the BCG was undetected by either of these surveys, we instead obtained upper limits. Spitzer 3.6m, 4.5m, and WISE 4-band photometry was converted from Vega to AB magnitudes following Price et al. (2004). The resulting UV–optical–IR spectral energy distributions (SEDs), which span 2000Å to 22m in the observed frame, are shown in Figure A.1 for our sample of 90 BCGs. As mentioned above, we have discarded all BCGs for which we have 2 photometric measurements (excluding upper limits).
The observed SEDs are fit in two stages. First, we model the full SED with a single-age population with formation redshift , solar metallicity, and a Salpeter (Salpeter, 1955) initial mass function. We assume a uniformly-distributed range of from 2–5 in our models, which leads to some uncertainty in our resulting stellar masses and star formation rates. The spectrum for this old stellar population was generated using Starburst99 (Leitherer et al., 1999) and was convolved with our broadband filter set. The model spectrum was fit to the data using mpfitfun444http://www.physics.wisc.edu/craigm/idl/down/mpfitfun.pro, which minimizes with respect to the two free parameters (normalization, redshift). The redshift was allowed to vary within the measured uncertainty from Bleem et al. (2015), while the normalization, which corresponds to the stellar mass of the old population, was left free.
Beyond this single-component model, we also consider additional components in the UV and IR representing contributions from a young stellar population and warm dust, respectively. At short wavelengths, we model excess emission using Starburst99, assuming a constant star formation rate over the past 30 Myr (roughly the AGN duty cycle). We note that adjusting this timescale down to 10 Myr or up to 100 Myr results in deviations in the derived SFR of 20%. We assume that the emission from young stars is obscured by dust, incorporating the Calzetti et al. (2000) extinction law and an intrinsic reddening of – this range is based on observations of nearby star-forming BCGs (Crawford et al., 1999; McDonald et al., 2012a). The young stellar component has a single free parameter, corresponding to the ongoing, extinction-corrected star formation rate. At long wavelengths, we mimic a dusty component with a mid-infrared power-law (), following Casey (2012). This dust component is artificially truncated at shorter wavelengths, so that it will not add UV flux. We only include the young and dusty components if their inclusion improves the , which is the case for 34% (31/90) of the BCGs in our sample. For the remaining 66% (59/90), the “passive-evolution” model yields a suitable fit to the data. The results of this SED-fitting are shown in Figure A.1.
2.4. Optical Spectroscopy
For 36 of the 95 BCGs in this sample, we have optical spectroscopy from a combination of the IMACS (Dressler et al., 2011) and LDSS3 spectrographs on Magellan. These spectra were initially obtained as part of a spectroscopic redshift campaign which targeted, primarily, red sequence galaxies. The full details of this spectroscopic follow-up is provided in Ruel et al. (2013) and Bleem et al. (2015). For each spectrum, we measure the [O ii] and H equivalent widths and the 4000Å break strength (D4000), via indices defined by Balogh et al. (1999). [O ii] equivalent widths are converted to emission line fluxes using the continuum level, as determined by the SED modeling described in §2.2, at rest-frame 3727Å. From these 36 spectra we find significant (3) [O ii] emission in 5 systems, one of which is the Phoenix cluster (McDonald et al., 2012c). This system allows us an opportunity to compare the index-based measurement of [O ii] to the total, flux from deep integral-field spectroscopy (McDonald et al., 2014c). Using the long-slit data, the index-based technique of Balogh et al. (1999) combined with our best-fit optical SED yields a line flux of ergs s-1 cm-2 for the central galaxy in the Phoenix cluster, while the total measured flux from McDonald et al. (2013a) is ergs s-1 cm-2. Thus, for this single comparison, the index-based approach does an adequate job of reproducing the measurement made via emission-line modeling of significantly higher-quality data.
When correcting the [O ii] emission line flux for extinction, we assume that the ionized gas has a factor of two higher reddening than the stellar continuum, following Calzetti et al. (2000); Calzetti (2001). This assumption is motivated by the idea that the warm ionized gas traces the highly-ionizing O and B stars, which tend to be embedded in dusty, star-forming regions.
2.5. Star Formation Rates and Their Uncertainties
2.5.1 UV-Derived SFRs
The calculation of star formation rates (SFRs) from the UV photometry is straightforward. In §2.3 we describe our SED-fitting procedure, which includes an intrinsically-reddened, continuously-star forming population derived from Starburst99 models. The normalization of this component yields the current star formation rate, under the assumption of constant star formation for the past 30 Myr.
The uncertainty in the UV-derived SFR is dominated by our uncertainty in the amount of intrinsic extinction () and, to a lesser extent, the formation redshift of the old stellar population (). In order to propagate our uncertainty in these quantities to our estimate of the SFR we perform 100 fits to each SED, varying and in each fit. We assume a normal distribution for , with , motivated by observations of nearby star-forming BCGs (Crawford et al., 1999; McDonald et al., 2012a). For the old stellar population, we assume a uniform distribution of formation epochs, from Gyr. This Monte-Carlo approach results in typical uncertainties in the UV-derived SFRs of 0.38 dex, or a factor of 2.5.
2.5.2 [O ii]-Derived SFRs
As described in §2.3, [O ii] fluxes are derived from a combination of indices (Balogh et al., 1999), which provide an estimate of the equivalent line width, and SED fitting, which provides the interpolated continuum level at 3727Å. We convert the measured emission line flux to a SFR, assuming SFR L[OII] (Kewley et al., 2004). As in §2.5.1, we assume a normal distribution of intrinsic reddening, with , following Calzetti et al. (2000); Calzetti (2001). As is the case for the UV-derived SFRs, our uncertainty in this extinction corrections dominates the uncertainty in the inferred SFR. Propagating this uncertainty through the fitting procedure via a Monte Carlo approach yields typical uncertainties of 0.19 dex, or a factor of 1.5.
2.5.3 IR-Derived SFRs
In the mid-infrared, we derive the SFR by first extrapolating our power-law fit from observed 22m to rest-frame 24m. The uncertainty on this calculation is both redshift dependent, since at higher redshift we are extrapolating over a larger wavelength range, and dependent on the assumed power-law slope. We incorporate the uncertainty in the power-law slope (; Casey, 2012) in our calculation of the 24m luminosity by assuming a normal distribution of values and performing 100 fits to the data. The average resulting uncertainty in L24μm is 0.2 dex, or a factor of 1.6. These extrapolated values of L24μm are then converted into an estimate of the SFR, following Calzetti et al. (2007).
2.5.4 Comparison of SFR Estimates
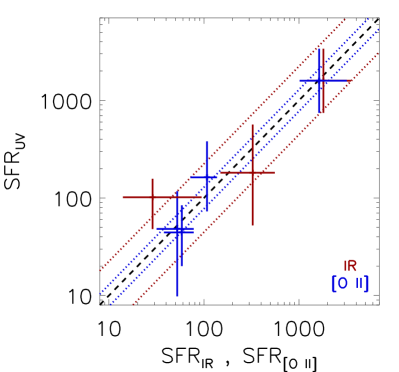
In Figure 1, we compare SFRs derived from the three indicators described above. We have only limited overlap between the three subsamples, with only 3 BCGs having both IR- and UV-derived SFRs and an additional 4 BCGs with both UV- and [O ii]-derived SFRs. Only a single BCG (SPT-CLJ2344-4243) has SFRs inferred from all three methods. Nonetheless, we proceed to compare how well these estimates agree for systems in common. In general, SFR estimates from different indicators agree within the systematic errors. Assuming a one-to-one relation, we measure a scatter of 0.37 dex between UV- and IR-derived SFRs, and 0.15 dex between UV- and [O ii]-derived SFRs. The better agreement between the UV- and [O ii]-derived SFRs is most likely due to the fact that the dominant systematic uncertainties (extinction, old stellar population age) are correlated between these SFR estimates. SFRs for each BCG are listed in Table A.1, along with relevant information about the host cluster.
2.6. AGN Contamination
Before presenting results from this survey, we would like to draw attention to one potential issue with our approach. All three indicators of star formation employed here – UV continuum, [O ii] line emission, and IR continuum – are also indicators of active nuclei. The relative amounts of contamination at each of these wavelengths depends on the type of AGN considered. For example, in the Phoenix cluster, more than half of the total IR continuum comes from a dusty QSO. On the other hand, this AGN contributes 5% to the UV and [O ii] emission. Several of the SEDs shown in Figure A.1 exhibit a powerlaw shape that is consistent with both a dusty starburst and an AGN.
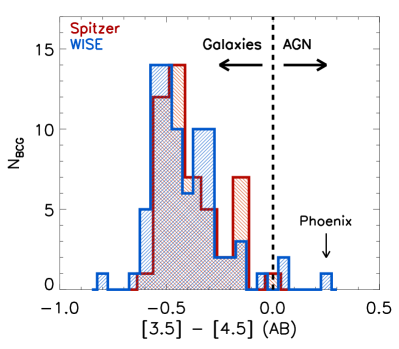
In an attempt to quantify the contamination due to AGN in this sample, we consider in Figure 2 the 3.5m – 4.5m color for 49 BCGs with Spitzer data and 82 BCGs with WISE data. Color corrections from Stern et al. (2012) have been applied to match data from these telescopes to a common photometric system. Following Stern et al. (2005, 2012), we classify systems with mid-IR colors as AGN, while those with redder colors are either passive or star-forming galaxies. In this color space, the Phoenix cluster (McDonald et al., 2012c) is the only BCG harboring a strong AGN. At most, we estimate that 4 clusters in this sample may harbor strong AGN at their centers, based on this mid-IR color selection. This lack of AGN contamination is further confirmed by visual inspection of the Chandra data for each cluster, which show a general lack of strong X-ray point sources coincident with the BCG in all clusters with the exception of Phoenix.
We proceed with this work assuming that all systems identified as star-forming are, indeed, star-forming, but remain cognizant of the fact that some fraction of these may host an AGN. We will return to this dilemma in the discussion section.
 |
 |
3. Results
Below, we summarize the key results to emerge from this data set. We defer a detailed discussion of these results to the discussion section.
3.1. Star Formation Rates in BCGs at 0.25 z 1.2
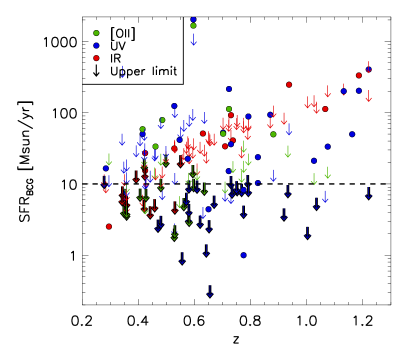
In Figure 3 we show the star formation rates, derived via three different methods, for the sample of BCGs described in §2.1. This plot demonstrates that the WISE mid-IR data typically provide the best upper limits at low-redshift, but are unable to provide meaningful upper limits on the star formation rate for BCGs at . At , the most restrictive limit generally comes from our deep -band follow-up program, which was designed to achieve a redshift-independent sensitivity. For the most part, we are sensitive to SFRs higher than 10 M⊙ yr-1, with 10% of systems having limits higher than this threshold.
In the right panel of Figure 3, we combine the constraints from the three different SF indicators. This plot shows a significant number of BCGs with SFRs from 10-300 M⊙ yr-1 at . One quarter (7/31) of the star-forming BCGs have SFR 100 M⊙ yr-1 – of these, 5 are at . For comparison, prior to this work there were only four confirmed clusters with extinction-corrected SFR 100 M⊙ yr-1 in their BCG: Abell 1835 (McNamara et al., 2006), RX J1504.1-0248 (Ogrean et al., 2010), MACS J1931.8-2634 (Ehlert et al., 2011), and the Phoenix cluster (McDonald et al., 2012c). The median star formation rate for the 31 star-forming BCGs identified over the full redshift range is 50 M⊙ yr-1. It is worth noting that 5 of the 7 most star-forming BCGs (SFR 100 M⊙ yr-1) are at , despite the fact that only 15% of the clusters in this sample are at such high redshift. Likewise, 3 of the 5 most star-forming BCGs are at , despite this representing 6% of the sample.
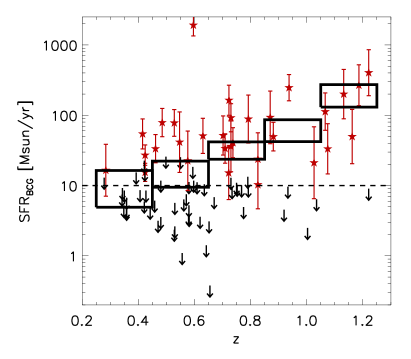
We also show in the right panel of Figure 3 the average SFR as a function of redshift in five redshift bins. These averages, provided in Table 1, have uncertainties that are derived by bootstrapping errors on individual data points. For non-detections, we assume zero SFR for the lower-bound of the uncertainty and the upper limit for the upper bound. Thus, the ranges shown encompass both the statistical uncertainty in the mean from detections and the uncertainty in the true value of the non-detections. This analysis reveals a strong evolution in the average star formation rate in BCGs over the past 9 Gyr. This increase in the average SFR is driven largely by a decrease in the number of non-detections at high-, which we will discuss next.
3.2. The Evolving Fraction of Star-Forming BCGs
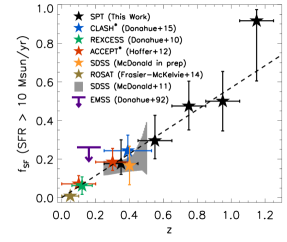
In Figure 4 we show how the fraction of BCGs with SFR 10 M⊙ yr-1 (hereafter ) has evolved over time. Within the sample presented here, this fraction evolves from 20% at , to 50% at , to 90% at . This evolution is visible in Figure 3 as a relative lack of non-detections at the highest redshifts compared to the lowest redshifts. This result indicates that the fraction of clusters harboring a starburst in their central, most-massive galaxy grows by a factor of 3 between and .
Even more intriguing is that, at , % (Donahue et al., 2010; Fraser-McKelvie et al., 2014), suggesting an even more dramatic decline since . We compile in Figure 4 estimates of from various surveys, spanning . These surveys include both optically-selected (McDonald, 2011, McDonald et al. in prep) and X-ray-selected (Donahue et al., 1992, 2010; Hoffer et al., 2012; Fraser-McKelvie et al., 2014; Donahue et al., 2015) clusters, and are being compared here to an SZ-selected sample. For the ACCEPT (Cavagnolo et al., 2009) and CLASH (Donahue et al., 2015) samples, we apply a small correction due to the fact that both of these cluster samples are biased towards cool core clusters. This bias correction assumes that the true, underlying fraction of cool core clusters is 30% (Haarsma et al., 2010; Hudson et al., 2010; McDonald et al., 2013b) and that non-cool cores do not have star-forming BCGs at (O’Dea et al., 2008; Cavagnolo et al., 2008; McDonald et al., 2010). This well-motivated correction brings the observed value of in line with other, more representative samples. Encouragingly, at there are five distinct measurements of , based on three different selection methods, which all agree that the fraction of star-forming BCGs is %. The agreement between our measurement of from SPT at and these earlier works suggests that our methodology is sound.
We show, in Figure 4, a linear fit to the star-forming BCG fraction, , as a function of redshift. The best-fitting line passes through the origin and has a slope of 0.57, implying a rapid evolution in over the past 9 Gyr. Such a fit is not physically well-motivated, and does not capture the rapid growth at late times. However, regardless of the choice of parametrization, it is clear from Figure 4 that the fraction of clusters harboring a strongly star-forming BCG at is significantly (3) higher than at . This evolution is perhaps unsurprising, since galaxies in general were more star-forming at early times. To address this comparison, we next compare the BCG evolution to that observed in field galaxy and other cluster members over similar redshift intervals.
3.3. Specific Star Formation Rates of
BCGs at
When comparing BCGs to other galaxies, it is necessary to normalize by the stellar mass of the individual galaxy. For a typical BCG, with M M⊙, a SFR of 10 M⊙ yr-1 is negligible in terms of contributing to the overall mass of the cluster, requiring 100 Gyr to double the stellar mass. However, this same star formation rate in a low-mass galaxy like M82 is enough to power massive outflows and modify the galaxy morphology and stellar content on short (Myr) timescales (Förster Schreiber et al., 2003). Thus, if we want to compare BCG evolution to field galaxy evolution, we must consider instead the specific star formation rate, or sSFR, defined as sSFR SFR/M∗.
| Ncl | ||||
|---|---|---|---|---|
| [1012 M⊙] | [M⊙ yr-1] | [Gyr-1] | ||
| 0.25 0.45 | 19 | 2.09 | 4.0 15 | 0.002 0.007 |
| 0.45 0.65 | 28 | 1.97 | 7.0 24 | 0.004 0.012 |
| 0.65 0.85 | 22 | 1.47 | 20 41 | 0.013 0.028 |
| 0.85 1.05 | 8 | 1.39 | 42 84 | 0.030 0.061 |
| 1.05 1.25 | 6 | 1.54 | 89 320 | 0.058 0.205 |
Note. — Average values for BCGs in five redshift bins, as shown in Figures 3 and 5. The ranges quoted on and correspond to the combined uncertainty in the measurements (bootstrapping errors), the uncertainty in the BCG choice, and the added uncertainty associated with stacking non-detections. The total number of clusters is less than the number of BCGs due to the fact that we consider multiple potential BCGs for several clusters.
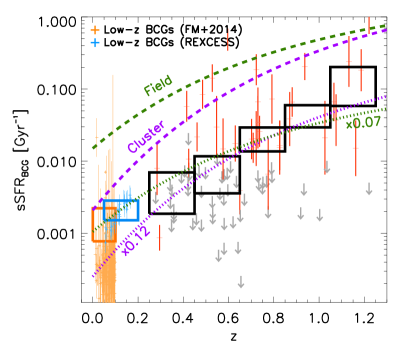
In Figure 5 we show the sSFR for BCGs in this work, as well as BCGs in similar-mass, low- clusters from Haarsma et al. (2010); Fraser-McKelvie et al. (2014). In calculating the sSFR, we use the stellar mass of the old population obtained in the SED-fitting process (see §2.3). For comparison, we show the average sSFR for field and cluster galaxies from Alberts et al. (2014). This earlier work showed that, at present, cluster galaxies have suppressed star formation compared to the field. However, at , galaxies in clusters are as star-forming as their field counterparts, and are evolving more rapidly. To match the analysis of Alberts et al. (2014), who calculate sSFR(z) by stacking far-IR data on galaxy positions, we estimate average sSFR values for our data by separately summing the total SFR and total stellar mass for galaxies in five redshift bins. For BCGs with upper limits on their SFR, we assume two limiting cases: the case where the SFR is equal to the upper limit, and the case where the SFR is zero. The net result of this stacking is shown in Figure 5 and Table 1, where the height of the black boxes represents the combined uncertainty in the measurements (bootstrapping errors), the uncertainty in the BCG choice, and the added uncertainty associated with stacking non-detections.
Figure 5 demonstrates that, at , BCGs are evolving similarly to the cluster member galaxies suggesting a common fueling mechanism. At low- (), the evolution of BCGs is less rapid than in the cluster environment, suggesting that the quenching processes acting on member galaxies (e.g., ram pressure stripping, strangulation) may not be affecting the central galaxy. This change in slope may be due to the gas reservoir being replenished in BCGs by cooling of the ICM, which is likely fueling star formation in the lowest redshift BCGs (e.g., McDonald et al., 2011b). We will return to this idea in the discussion below. At there is marginal evidence that BCGs may be evolving more rapidly than the member galaxies, suggesting a preferential quenching in the cluster core.
3.4. Which Clusters Host Star-Forming BCGs?
At low-, star-forming BCGs are, with very few exceptions, found in low-entropy, relaxed “cool core” clusters (e.g., Cavagnolo et al., 2008). This appears to still be the case for CLASH clusters out to (Donahue et al., 2015), and for individual clusters at higher redshift (e.g. McDonald et al., 2012c). However, it has not yet been established whether the presence of a cool core at high- correlates with a star-forming BCG.
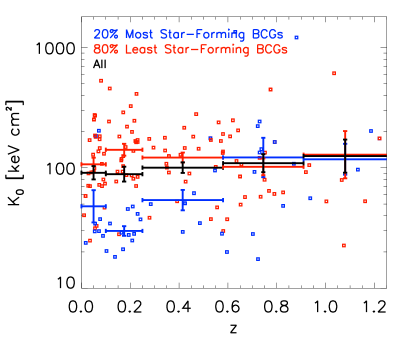
In Figure 6, we show the distribution of central entropy (K0) as a function of redshift for clusters hosting the most star-forming BCGs compared to those hosting the most passive BCGs. Specifically, in each redshift bin we separately compute the average central entropy for the clusters harboring the 20% most star-forming BCGs (e.g., Perseus, Abell 1835, Phoenix, etc) and for those harboring the 80% most passive BCGs. At , we show clusters from the ACCEPT sample (Cavagnolo et al., 2009), where the SFRs are inferred from archival infrared data (; Fraser-McKelvie et al., 2014) or the H line luminosity (; Crawford et al., 1999). We have recomputed the central entropy in a 15 kpc aperture (0.015R500) for clusters at to match our more coarse, high- aperture, and to avoid resolution bias (e.g., Panagoulia et al., 2013). We include only clusters with M M⊙ (based on LX–M relation from Pratt et al., 2009), to mimic the SPT selection. We find, in agreement with previous works (Cavagnolo et al., 2008), that clusters hosting the most star-forming BCGs have a typical central entropy of K keV cm2, while those hosting the least star-forming BCGs have K keV cm2. As the redshift increases, the average core entropy in clusters hosting the most star-forming BCGs increases to 40 keV cm2 (), and then to 100 keV cm2 (). In the two highest-redshift bins (), there is no statistical difference between the distribution of core entropy in clusters with star-forming and passive BCGs. We find no strong evolution in the core entropy of the full sample, or in the subsample of clusters with passively-evolving BCGs. This seems to suggest that, while ICM cooling is likely responsible for providing the fuel for star formation in low- clusters, a different mechanism is responsible for star formation in the high- BCGs.
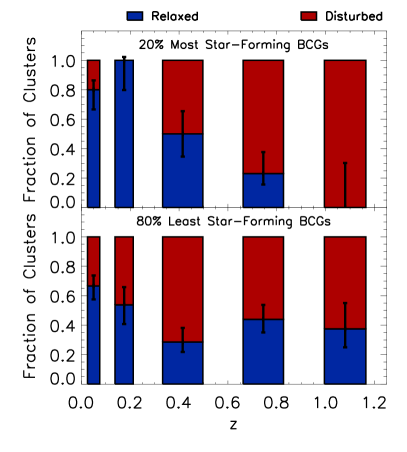
Another mechanism for forming stars in BCGs is via mergers with gas-rich galaxies. Under the assumption that such mergers happen most often shortly after the infall of a group or other massive halo, which provides an influx of new galaxies along orbits that may not be stable, we would expect BCGs with star formation being fueled by mergers to reside in clusters with disturbed X-ray morphology. In Figure 7, we test this scenario. For clusters in the SPT sample, we define X-ray morphology using the “” parameter, following Nurgaliev et al. (2013), with a relaxed critereon of . This quantity is less biased to signal-to-noise than other indicators, such as power ratios and centroid shift, but is consistent with these in the limit of high signal to noise, as is demonstrated by Nurgaliev et al. (2013). At low-, we use the recently-compiled list of “symmetry” measurements from Mantz et al. (2015), using overlapping clusters to determine a common “relaxed” criterion. As before, for clusters at and , we use BCG star formation rates from Fraser-McKelvie et al. (2014) and Crawford et al. (1999), respectively, cutting on mass (M M⊙) in order to ensure uniformity in the samples.
Figure 7 confirms that, at , the most star-forming BCGs tend to reside in relaxed, cool core clusters. The star formation in these BCGs is most likely being fueled by the cooling ICM, where cooling flows are most commonly found in relaxed clusters. On the contrary, at 0.6, the most star-forming BCGs are found more often in clusters with disturbed X-ray morphology, with 90% of the most star-forming BCGs at being found in such systems. This implies that, at early times, star formation in the BCG is more strongly correlated with the dynamic state, rather than the cooling state, of the ICM – the inverse to what is observed in the nearby Universe.
Figures 6 and 7 suggest that there is a transition between star formation in low- BCGs being linked to low-entropy, cool core clusters, to star formation in high- BCGs being related more to a disturbed cluster morphology than to the cooling properties of the ICM. Below we will discuss possible interpretations of this result, and others presented thus far, while also addressing any potential systematic biases in this study.
4. Discussion
4.1. Comparing X-ray and UV Morphology for Individual Star-Forming BCGs
Based on Figures 6 and 7, there appears to be an evolving connection between star formation in the BCG and the host cluster morphology. In order to investigate the fuel source for this star formation (i.e., cooling, gas-rich mergers, etc), and determine whether this is linked to the dynamical state of the cluster, we require rest-frame UV imaging at significantly higher angular resolution. Fortunately, many of the high- clusters in this sample have been observed by the Hubble Space Telescope (HST) as part of various weak-lensing programs (PIs: Stubbs, High, Schrabback). These observations are all in the F606W filter, which corresponds to rest-frame -band at and 3000Å at . These data provide a detailed view of the young stellar populations in a subsample (10/14) of high- star-forming BCGs.
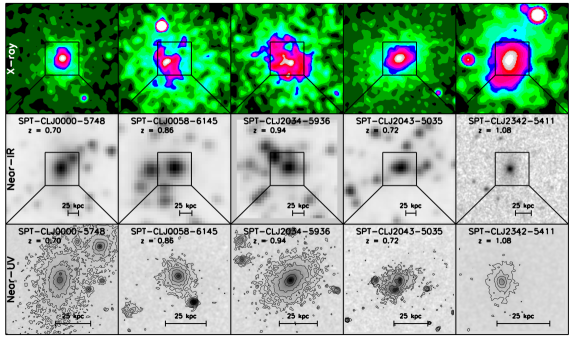
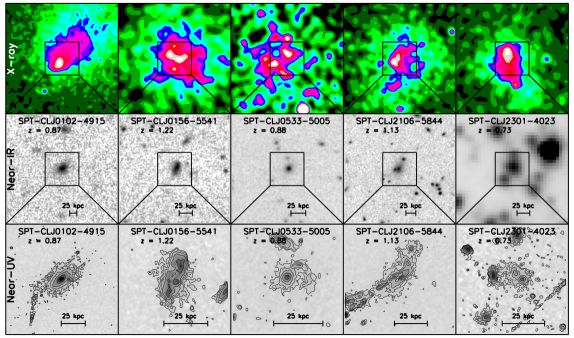
In Figures 8 and 9 we highlight the X-ray and UV morphology of the cluster and BCG, respectively, for all 10 clusters with available rest-frame -band (or bluer) HST imaging at . For each cluster, we also show a near-IR image of the core region, to demonstrate that these star-forming galaxies do indeed have the highest stellar mass of all the galaxies in the core, consistent with being the BCG. We have divided these 10 clusters by X-ray morphology into two subsamples of relaxed ( and K keV cm2) and unrelaxed ( or K keV cm2). The five most relaxed clusters (Figure 8), in general, have relatively smooth, symmetric UV morphologies that resemble the underlying old stellar (near-IR) distribution. We caution that much of this near-UV emission may originate in the old stellar populations (see e.g. Hicks et al., 2010) – we require either far-UV imaging or equally high angular resolution imaging in a near-IR band (allowing subtraction of the old population) to determine the morphology of the excess UV emission due exclusively to young stars. Two of the BCGs shown in Figure 8 (SPT-CLJ0000-5748, SPT-CLJ2043-5035) appear to be in the midst of major mergers, based on both the near-IR and near-UV imaging, despite the fact that these two BCGs reside in the two most relaxed high- clusters in our sample. None of the star-forming BCGs in this high-, relaxed cluster subsample show evidence for extended, asymmetric filaments of star formation which are commonly found in analogous low- systems (e.g., O’Dea et al., 2010; McDonald et al., 2011b; Donahue et al., 2015, Tremblay et al. 2015). Instead, the UV emission is concentrated in the BCG center for 4 out of 5 BCGs, perhaps indicating that these systems are experiencing either nuclear starbursts or are AGN misidentified as star-forming galaxies.
On the other hand, in the five least relaxed clusters (Figure 9) the UV emission in and around the BCG is clumpy and filamentary. In particular, SPT-CLJ0102-4915 and SPT-CLJ2106-5844 exhibit clumpy UV emission extending 61 kpc and 57 kpc from the BCG center, respectively. This is comparable to the most extended star-forming filaments found in Abell 1795 (50 kpc; McDonald & Veilleux, 2009) and Perseus (60 kpc; Conselice et al., 2001; Canning et al., 2014). In all five of these BCGs, there are a minimum of two distinct UV peaks – in several systems, the brightest UV peak is offset from the BCG nucleus. Unlike the five BCGs in the more relaxed clusters, none of these systems are consistent with being purely AGN, given their complex morphology.
While incomplete, these HST data suggest a qualitative difference in UV morphology between BCGs in relaxed, cool-core clusters and those in unrelaxed systems. In relaxed, cool-core clusters, where low- surveys tend to find star-forming BCGs, we find (in 4/5 cases) smooth, centrally concentrated UV morphologies. In the more morphologically-disturbed systems (based on X-ray imaging), we find (in 5/5 cases) clumpy or filamentary UV emission, with several (3) distinct emission peaks. Follow-up studies involving deep, high spatial resolution imaging at both far-UV and near-IR of a larger sample of high- BCGs are necessary to determine whether this emerging trend is merely coincidence or evidence for a link between central star formation and the dynamical state of the cluster core.
4.2. An Evolving Fuel Supply?
The results presented in §3 suggest that, at high-, the potential for star formation in the BCG is maximized when that BCG belongs to a dynamically-active cluster. This is contrary to the established wisdom, based on numerous studies of low- clusters, that the most relaxed, cool core clusters tend to harbor the most star-forming BCGs (e.g., Crawford et al., 1999; Edwards et al., 2007; Cavagnolo et al., 2008; Donahue et al., 2010). We proceed with a discussion of these results under the assumption that the X-ray morphology traces the dynamical state of the cluster, or, more specifically, that morphologically-disturbed clusters in the X-ray are undergoing (or have recently undergone) a major merger.
At early times, the cores of galaxy clusters contained a higher fraction of star-forming galaxies than they do today – this is known as the “Butcher-Oemler Effect” (Butcher & Oemler, 1984). This trend continues with increasing redshift, such that at , the star formation rate in the field and in the cluster environment are indistinguishable (Brodwin et al., 2013; Alberts et al., 2014; Wagner et al., 2015, see also Figure 5). Thus, we would expect that there is a significantly higher fraction of gas-rich galaxies in our high- subsample than in the low- systems, particularly in the inner cores where gas depletion is most effective at low-. Regardless of the impact angle of a cluster-cluster merger (as long as it is a bound system), the cores will typically pass through one another within 2 crossings (e.g., Ricker & Sarazin, 2001; Poole et al., 2006). The crossing of these two cores will result in both an increase in the effectiveness of ram-pressure stripping, due to the high relative velocities of the cores, and an increased rate of galaxy-galaxy mergers and harassment. Each of these elevated processes result in the removal of cool gas from member galaxy halos. Assuming that this gas remains cool, this would lead to an increase in the availability of fuel for star formation in the cores of merging clusters. This is not the case in low- systems, since galaxies in the cores of low- clusters tend to be gas-poor (hence the low star formation rates), so very little gas is available to be removed from their halos and contributed to the core.
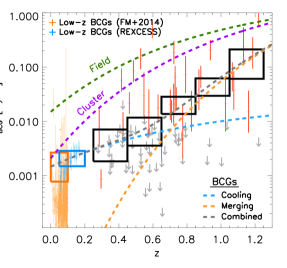
With this scenario in mind, we reexamine Figure 5, modeling the observed evolution in BCG star formation with two distinct evolutionary components. These models, shown in Figure 10, assume that the evolution can be described as the sum of two power laws in time (). The best-fitting models have decay times of 4 Gyr (low-) and 0.7 Gyr (high-), compared to 1.5 Gyr and 2.2 Gyr for high- cluster and field galaxies, respectively, from Alberts et al. (2014). This model is meant to provide a qualitative assessment of what may be driving star formation in BCGs over time – there is no shortage of models with an equal number of free parameters that would provide an equivalently good fit to these data.
The models shown in Figure 5 were chosen to illustrate two epochs of declining star formation. From to , the sSFR declines more rapidly ( Gyr) than both the field ( Gyr) and cluster ( Gyr) environment, implying that the BCG is quenched more rapidly than the other cluster members. This is consistent with an extrapolation from the field to the cluster environment from Alberts et al. (2014), indicating that (unsurprisingly) quenching of star formation is a strong function of local galaxy density. At late time, from to , the sSFR of BCGs is evolving more slowly ( Gyr) than both the field and cluster environment. Considering that field galaxy evolution is approximately passive, this implies that BCGs have an additional source of fuel – presumably the cooling ICM in relaxed systems. The non-zero slope of this evolution may be due to an ever-improving balance between ICM cooling and AGN feedback in the cores of galaxy clusters, leading to a reduction in the efficiency of ICM cooling over time.
In summary, there appears to be a transition in the source of fuel for star formation in BCGs over the past 10 Gyr. In nearby clusters, star formation is likely to be fueled by the cooling ICM, and regulated by feedback from the central AGN. At early times, the most star-forming BCGs are found in dynamically unrelaxed clusters, suggesting that star formation may be predominantly fueled by interactions with other galaxies, similar to the other, non-BCG members.
4.3. Lowering the Precipitation Threshold in Mergers
Several recent studies have suggested that the condition for thermal instability in the hot ICM can be described as , where is the cooling time, and is the local free-fall time (McCourt et al., 2012; Sharma et al., 2012; Gaspari et al., 2012; Voit & Donahue, 2015; Voit et al., 2015). This threshold can be interpreted as the ratio of the cooling time to the mixing time. Assuming that AGN feedback is anisotropic, preventing local thermal instabilities requires that the heated gas mixes with the cooling gas on timescales shorter than the local cooling time.
In order to cross this threshold, one of two conditions can be met. The gas can cool, reducing the local cooling time, . In the precipitation-driven feedback scenario of Voit et al. (2015), this leads to rapid precipitation of cold clouds, which fuel AGN feedback, leading to an increase of . This cycle can repeat indefinitely, until a more energetic process drives to much larger values (1 Gyr). Alternatively, if the free-fall time is increased, gas at a fixed density and temperature will more readily condense out of the hot phase. This criteria is, in principle, met if the dense core of a galaxy cluster is dislodged from the minimum of the dark matter potential, as is the case during an interaction with another massive group or cluster. It remains unclear, however, whether increasing the free-fall time of the gas in this way would, in fact, lead to more favorable cooling. Strictly speaking, a dislodged cool core would have a lower value of , but the simulations which arrived at the threshold of for thermal instability assumed relaxed clusters. In the case of a relaxed cluster, is a proxy for the convective timescale of the hot gas. However, in a merging cluster, bulk flows will likely drive mixing on faster timescales, perhaps leading to less efficient cooling.
This represents an alternate scenario which would lead to a link between enhanced star formation in the BCG and an unrelaxed dynamical state of the cluster core at early times. We lean toward the merger-induced SF scenario to explain the uptick in star-forming BCGs at early times, but stress that follow-up studies, including spatially-resolved far-UV (e.g., HST) and far-IR (e.g., ALMA) imaging and optical spectroscopy, of these BCGs are necessary to provide additional insights into the mechanism for enhancing star formation in these high- BCGs.
4.4. AGN Contamination
As we discussed in §2.6, it is possible that many of the BCGs that we have identified as star-forming may, instead, be AGN. With the inhomogeneous data set in hand, it is challenging to differentiate between starburst and AGN, or composite systems, in a uniform way for the full sample. Thus, it may be that both the estimated fraction of star-forming BCGs and the absolute star formation rates of these BCGs may be biased high.
Considering only clusters at (the two highest redshift bins in Figure 4) we detect star formation in 9–10 out of 22 (41–45%) of BCGs, where the uncertainty represents cases where multiple BCGs were identified in a given cluster. This is a factor of two higher than the fraction of star-forming BCGs at . If we consider only the subsample of clusters with HST follow-up, and label systems with symmetric, nuclear UV emission as non-star forming (see Figures 8 and 9), we find evidence of extended, asymmetric star formation in 4 of 10 (40%) of BCGs. Given the reduction in sample size by requiring HST follow-up, the uncertainty on this fraction is larger, with the 95% confidence interval being 16.7–69.2%. While this is consistent with the observed star-forming fraction of 18% at (McDonald, 2011; Donahue et al., 2015), it is inconsistent with the lower value of 5% measured at (Donahue et al., 2010; Fraser-McKelvie et al., 2014). Thus, while we can say with high confidence that the fraction of star-forming BCGs has evolved significantly from to , our inability to differentiate between central AGN and nuclear starbursts limits our ability to say with certainty whether this fraction continues to grow.
It is important to note, however, that the fraction of nearby BCGs harboring AGN that are bright in the UV or IR continuum is low – the vast majority of cluster-centric AGN are radio galaxies which appear quiescent at most other wavelengths. If the high fraction of systems identified here as star-forming are instead AGN, it implies a high accretion rate onto the supermassive black hole at early times (e.g., Russell et al., 2013). Of the hundreds of known BCGs at low-, there are only a handful of systems that appear to harbor rapidly-accreting, radiatively-efficient AGN (e.g., Russell et al., 2010; O’Sullivan et al., 2012; Ueda et al., 2013; Kirk et al., 2014; Reynolds et al., 2014; Walker et al., 2014). Thus, we can say with confidence that there is a dramatic increase in the amount of “activity” in BCGs from to – whether that activity refers to massive bursts of star formation or the rapid growth of central supermassive black holes remains an open question.
5. Summary
We present multiwavelength observations and inferred star formation rates for 90 brightest cluster galaxies (BCGs) in SPT-selected galaxy clusters at , all of which have archival X-ray data. The main results from this study can be summarized as follows:
We find a significant number of BCGs (31/90) with SFR 10 M⊙ yr-1, representing a much higher occurrence rate than that observed in galaxy clusters at (1–5%; Donahue et al., 2010; Fraser-McKelvie et al., 2014). Of these 31 BCGs, one quarter (7/31) have SFR 100 M⊙ yr-1.
The fraction of clusters harboring a star-forming (SFR 10 M⊙ yr-1) BCG is found to be 20% at , consistent with many earlier works based on optical and X-ray cluster selection. This fraction rises rapidly at , to a measured value of 90% at .
The specific star formation rate () of BCGs has evolved more slowly ( Gyr) in recent times () than the overall cluster ( Gyr) and field ( Gyr) populations. This is most likely due to a replenishment of gas in the BCG via cooling of the ICM. At early times, the evolution was more rapid ( Gyr), with the sSFR in BCGs dropping from 0.1 Gyr-1 at to 0.02 Gyr-1 at .
At there is no significant correlation between the central entropy of the host cluster and the presence of star formation signatures in the BCG, contrary to what is observed in nearby clusters.
While, at , star-forming BCGs are found in the centers of relaxed, cool core clusters, this trend appears to reverse at high-. At , the most star-forming BCGs in this sample are found in the cores of morphologically-disturbed clusters (based on X-ray asymmetry).
Excluding the Phoenix cluster, the most strongly star-forming systems in this sample have SFRs of order 100–300 M⊙ yr-1. Based on rest-frame near-UV follow-up of a subsample of high- systems with HST, we find that this star formation can be extended on scales of 50–60 kpc.
The observation that an enhancement in BCG star formation correlates with the dynamical state of the cluster at high- suggests that star formation may have been fueled by interactions with gas-rich satellites at early times. Further studies, utilizing deep, high angular resolution far-IR and far-UV imaging and integral field spectroscopy of a larger sample of BCGs will help determine if such mergers are, indeed, the dominant source of star formation in BCGs at early times.
Acknowledgements
We thank Mark Voit and John ZuHone for helpful conversations. M. M. acknowledges support by NASA through contracts HST-GO-13456.002A (Hubble) and GO4-15122A (Chandra), and Hubble Fellowship grant HST-HF51308.01-A awarded by the Space Telescope Science Institute, which is operated by the Association of Universities for Research in Astronomy, Inc., for NASA, under contract NAS 5-26555. The South Pole Telescope program is supported by the National Science Foundation through grants ANT-0638937 and PLR-1248097. Partial support is also provided by the NSF Physics Frontier Center grant PHY-0114422 to the Kavli Institute of Cosmological Physics at the University of Chicago, the Kavli Foundation, and the Gordon and Betty Moore Foundation. Support for X-ray analysis was provided by NASA through Chandra Award Numbers 12800071, 12800088, and 13800883 issued by the Chandra X-ray Observatory Center, which is operated by the Smithsonian Astrophysical Observatory for and on behalf of NASA. Galaxy cluster research at Harvard is supported by NSF grant AST-1009012 and at SAO by NSF grants AST-1009649 and MRI-0723073. The McGill group acknowledges funding from the National Sciences and Engineering Research Council of Canada, Canada Research Chairs program, and the Canadian Institute for Advanced Research. Argonne National Laboratory’s work was supported under U.S. Department of Energy contract DE-AC02-06CH11357. This work is based in part on observations made with the Spitzer Space Telescope, which is operated by the Jet Propulsion Laboratory, California Institute of Technology under a contract with NASA. J.E.C. acknowledges support from National Science Foundation grants PLR-1248097 and PHY-1125897. CR acknowledges support from the University of Melbourne and from the Australian Research Council s Discovery Projects scheme (DP150103208). DA and TS acknowledge support from the German Federal Ministry of Economics and Technology (BMWi) provided through DLR under projects 50 OR 1210, 50 OR 1308, and 50 OR 1407.
Facilities: Blanco (MOSAIC), CXO (ACIS), GALEX, HST (ACS), Magellan:Baade (FourStar, IMACS), Magellan:Clay (LDSS3, Megacam), Max Planck:2.2m (WFI), NTT (EFOSC), Spitzer (IRAC), Swope (SITe3), VLT:Antu (FORS2), WISE, XMM (OM)
References
- Alberts et al. (2014) Alberts, S., Pope, A., Brodwin, M., et al. 2014, MNRAS, 437, 437
- Balogh et al. (1999) Balogh, M. L., Morris, S. L., Yee, H. K. C., Carlberg, R. G., & Ellingson, E. 1999, ApJ, 527, 54
- Bertin & Arnouts (1996) Bertin, E., & Arnouts, S. 1996, A&AS, 117, 393
- Bîrzan et al. (2004) Bîrzan, L., Rafferty, D. A., McNamara, B. R., Wise, M. W., & Nulsen, P. E. J. 2004, ApJ, 607, 800
- Bleem et al. (2015) Bleem, L. E., Stalder, B., de Haan, T., et al. 2015, ApJS, 216, 27
- Brodwin et al. (2013) Brodwin, M., Stanford, S. A., Gonzalez, A. H., et al. 2013, ApJ, 779, 138
- Butcher & Oemler (1984) Butcher, H., & Oemler, Jr., A. 1984, ApJ, 285, 426
- Calzetti (2001) Calzetti, D. 2001, PASP, 113, 1449
- Calzetti et al. (2000) Calzetti, D., Armus, L., Bohlin, R. C., et al. 2000, ApJ, 533, 682
- Calzetti et al. (2007) Calzetti, D., Kennicutt, R. C., Engelbracht, C. W., et al. 2007, ApJ, 666, 870
- Cameron (2011) Cameron, E. 2011, PASA, 28, 128
- Canning et al. (2014) Canning, R. E. A., Ryon, J. E., Gallagher, J. S., et al. 2014, MNRAS, 444, 336
- Carlstrom et al. (2011) Carlstrom, J. E., Ade, P. A. R., Aird, K. A., et al. 2011, PASP, 123, 568
- Casey (2012) Casey, C. M. 2012, MNRAS, 425, 3094
- Cavagnolo et al. (2008) Cavagnolo, K. W., Donahue, M., Voit, G. M., & Sun, M. 2008, ApJ, 683, L107
- Cavagnolo et al. (2009) —. 2009, ApJS, 182, 12
- Conselice et al. (2001) Conselice, C. J., Gallagher, III, J. S., & Wyse, R. F. G. 2001, AJ, 122, 2281
- Crawford et al. (1999) Crawford, C. S., Allen, S. W., Ebeling, H., Edge, A. C., & Fabian, A. C. 1999, MNRAS, 306, 857
- Donahue et al. (2000) Donahue, M., Mack, J., Voit, G. M., et al. 2000, ApJ, 545, 670
- Donahue et al. (1992) Donahue, M., Stocke, J. T., & Gioia, I. M. 1992, ApJ, 385, 49
- Donahue et al. (2010) Donahue, M., Bruch, S., Wang, E., et al. 2010, ApJ, 715, 881
- Donahue et al. (2015) Donahue, M., Connor, T., Fogarty, K., et al. 2015, ArXiv e-prints, arXiv:1504.00598
- Dressler et al. (2011) Dressler, A., Bigelow, B., Hare, T., et al. 2011, PASP, 123, 288
- Edge (2001) Edge, A. C. 2001, MNRAS, 328, 762
- Edge & Frayer (2003) Edge, A. C., & Frayer, D. T. 2003, ApJ, 594, L13
- Edge et al. (2002) Edge, A. C., Wilman, R. J., Johnstone, R. M., et al. 2002, MNRAS, 337, 49
- Edwards et al. (2007) Edwards, L. O. V., Hudson, M. J., Balogh, M. L., & Smith, R. J. 2007, MNRAS, 379, 100
- Ehlert et al. (2011) Ehlert, S., Allen, S. W., von der Linden, A., et al. 2011, MNRAS, 411, 1641
- Fabian (2012) Fabian, A. C. 2012, ARA&A, 50, 455
- Förster Schreiber et al. (2003) Förster Schreiber, N. M., Genzel, R., Lutz, D., & Sternberg, A. 2003, ApJ, 599, 193
- Fraser-McKelvie et al. (2014) Fraser-McKelvie, A., Brown, M. J. I., & Pimbblet, K. A. 2014, MNRAS, 444, L63
- Gaspari et al. (2012) Gaspari, M., Ruszkowski, M., & Sharma, P. 2012, ApJ, 746, 94
- Haarsma et al. (2010) Haarsma, D. B., Leisman, L., Donahue, M., et al. 2010, ApJ, 713, 1037
- Hatch et al. (2007) Hatch, N. A., Crawford, C. S., & Fabian, A. C. 2007, MNRAS, 380, 33
- Hatch et al. (2005) Hatch, N. A., Crawford, C. S., Fabian, A. C., & Johnstone, R. M. 2005, MNRAS, 358, 765
- Heckman et al. (1989) Heckman, T. M., Baum, S. A., van Breugel, W. J. M., & McCarthy, P. 1989, ApJ, 338, 48
- Hicks & Mushotzky (2005) Hicks, A. K., & Mushotzky, R. 2005, ApJ, 635, L9
- Hicks et al. (2010) Hicks, A. K., Mushotzky, R., & Donahue, M. 2010, ApJ, 719, 1844
- Hlavacek-Larrondo et al. (2012) Hlavacek-Larrondo, J., Fabian, A. C., Edge, A. C., et al. 2012, MNRAS, 421, 1360
- Hlavacek-Larrondo et al. (2014) Hlavacek-Larrondo, J., McDonald, M., Benson, B. A., et al. 2014, ArXiv e-prints, arXiv:1410.0025
- Hoffer et al. (2012) Hoffer, A. S., Donahue, M., Hicks, A., & Barthelemy, R. S. 2012, ApJS, 199, 23
- Hu et al. (1985) Hu, E. M., Cowie, L. L., & Wang, Z. 1985, ApJS, 59, 447
- Hudson et al. (2010) Hudson, D. S., Mittal, R., Reiprich, T. H., et al. 2010, A&A, 513, A37
- Jaffe & Bremer (1997) Jaffe, W., & Bremer, M. N. 1997, MNRAS, 284, L1
- Jaffe et al. (2005) Jaffe, W., Bremer, M. N., & Baker, K. 2005, MNRAS, 360, 748
- Johnstone et al. (1987) Johnstone, R. M., Fabian, A. C., & Nulsen, P. E. J. 1987, MNRAS, 224, 75
- Johnstone et al. (2007) Johnstone, R. M., Hatch, N. A., Ferland, G. J., et al. 2007, MNRAS, 382, 1246
- Kewley et al. (2004) Kewley, L. J., Geller, M. J., & Jansen, R. A. 2004, AJ, 127, 2002
- Kirk et al. (2014) Kirk, B., Hilton, M., Cress, C., et al. 2014, ArXiv e-prints, arXiv:1410.7887
- Leitherer et al. (1999) Leitherer, C., Schaerer, D., Goldader, J. D., et al. 1999, ApJS, 123, 3
- Mantz et al. (2015) Mantz, A. B., Allen, S. W., Morris, R. G., et al. 2015, MNRAS, 449, 199
- McCourt et al. (2012) McCourt, M., Sharma, P., Quataert, E., & Parrish, I. J. 2012, MNRAS, 419, 3319
- McDonald (2011) McDonald, M. 2011, ApJ, 742, L35
- McDonald et al. (2013a) McDonald, M., Benson, B., Veilleux, S., Bautz, M. W., & Reichardt, C. L. 2013a, ApJ, 765, L37
- McDonald et al. (2014a) McDonald, M., Roediger, J., Veilleux, S., & Ehlert, S. 2014a, ApJ, 791, L30
- McDonald & Veilleux (2009) McDonald, M., & Veilleux, S. 2009, ApJ, 703, L172
- McDonald et al. (2011a) McDonald, M., Veilleux, S., & Mushotzky, R. 2011a, ApJ, 731, 33
- McDonald et al. (2012a) McDonald, M., Veilleux, S., & Rupke, D. S. N. 2012a, ApJ, 746, 153
- McDonald et al. (2010) McDonald, M., Veilleux, S., Rupke, D. S. N., & Mushotzky, R. 2010, ApJ, 721, 1262
- McDonald et al. (2011b) McDonald, M., Veilleux, S., Rupke, D. S. N., Mushotzky, R., & Reynolds, C. 2011b, ApJ, 734, 95
- McDonald et al. (2012b) McDonald, M., Wei, L. H., & Veilleux, S. 2012b, ApJ, 755, L24
- McDonald et al. (2012c) McDonald, M., Bayliss, M., Benson, B. A., et al. 2012c, Nature, 488, 349
- McDonald et al. (2013b) McDonald, M., Benson, B. A., Vikhlinin, A., et al. 2013b, ApJ, 774, 23
- McDonald et al. (2014b) —. 2014b, ArXiv e-prints, arXiv:1404.6250
- McDonald et al. (2014c) McDonald, M., Swinbank, M., Edge, A. C., et al. 2014c, ApJ, 784, 18
- McLeod et al. (2015) McLeod, B., Geary, J., Conroy, M., et al. 2015, PASP, 127, 366
- McNamara & Nulsen (2012) McNamara, B. R., & Nulsen, P. E. J. 2012, New Journal of Physics, 14, 055023
- McNamara & O’Connell (1989) McNamara, B. R., & O’Connell, R. W. 1989, AJ, 98, 2018
- McNamara et al. (2006) McNamara, B. R., Rafferty, D. A., Bîrzan, L., et al. 2006, ApJ, 648, 164
- Morrissey et al. (2007) Morrissey, P., Conrow, T., Barlow, T. A., et al. 2007, ApJS, 173, 682
- Nurgaliev et al. (2013) Nurgaliev, D., McDonald, M., Benson, B. A., et al. 2013, ApJ, 779, 112
- O’Dea et al. (2008) O’Dea, C. P., Baum, S. A., Privon, G., et al. 2008, ApJ, 681, 1035
- O’Dea et al. (2010) O’Dea, K. P., Quillen, A. C., O’Dea, C. P., et al. 2010, ApJ, 719, 1619
- Ogrean et al. (2010) Ogrean, G. A., Hatch, N. A., Simionescu, A., et al. 2010, MNRAS, 406, 354
- Oonk et al. (2010) Oonk, J. B. R., Jaffe, W., Bremer, M. N., & van Weeren, R. J. 2010, MNRAS, 405, 898
- O’Sullivan et al. (2012) O’Sullivan, E., Giacintucci, S., Babul, A., et al. 2012, MNRAS, 424, 2971
- Panagoulia et al. (2013) Panagoulia, E. K., Fabian, A. C., & Sanders, J. S. 2013, MNRAS, arXiv:1312.0798
- Poole et al. (2006) Poole, G. B., Fardal, M. A., Babul, A., et al. 2006, MNRAS, 373, 881
- Pratt et al. (2009) Pratt, G. W., Croston, J. H., Arnaud, M., & Böhringer, H. 2009, A&A, 498, 361
- Price et al. (2004) Price, S. D., Paxson, C., Engelke, C., & Murdock, T. L. 2004, AJ, 128, 889
- Rafferty et al. (2008) Rafferty, D. A., McNamara, B. R., & Nulsen, P. E. J. 2008, ApJ, 687, 899
- Reynolds et al. (2014) Reynolds, C. S., Lohfink, A. M., Babul, A., et al. 2014, ApJ, 792, L41
- Ricker & Sarazin (2001) Ricker, P. M., & Sarazin, C. L. 2001, ApJ, 561, 621
- Ruel et al. (2013) Ruel, J., Bazin, G., Bayliss, M., et al. 2013, ArXiv e-prints, arXiv:1311.4953
- Russell et al. (2010) Russell, H. R., Fabian, A. C., Sanders, J. S., et al. 2010, MNRAS, 402, 1561
- Russell et al. (2013) Russell, H. R., McNamara, B. R., Edge, A. C., et al. 2013, MNRAS, 432, 530
- Ruszkowski & Springel (2009) Ruszkowski, M., & Springel, V. 2009, ApJ, 696, 1094
- Salomé & Combes (2003) Salomé, P., & Combes, F. 2003, A&A, 412, 657
- Salpeter (1955) Salpeter, E. E. 1955, ApJ, 121, 161
- Santos et al. (2008) Santos, J. S., Rosati, P., Tozzi, P., et al. 2008, A&A, 483, 35
- Sharma et al. (2012) Sharma, P., McCourt, M., Quataert, E., & Parrish, I. J. 2012, MNRAS, 420, 3174
- Sharma et al. (2010) Sharma, P., Parrish, I. J., & Quataert, E. 2010, ApJ, 720, 652
- Shull et al. (2012) Shull, J. M., Smith, B. D., & Danforth, C. W. 2012, ApJ, 759, 23
- Silk & Mamon (2012) Silk, J., & Mamon, G. A. 2012, Research in Astronomy and Astrophysics, 12, 917
- Song et al. (2012) Song, J., Zenteno, A., Stalder, B., et al. 2012, ApJ, 761, 22
- Stern et al. (2005) Stern, D., Eisenhardt, P., Gorjian, V., et al. 2005, ApJ, 631, 163
- Stern et al. (2012) Stern, D., Assef, R. J., Benford, D. J., et al. 2012, ApJ, 753, 30
- Sun (2009) Sun, M. 2009, ApJ, 704, 1586
- Sunyaev & Zeldovich (1972) Sunyaev, R. A., & Zeldovich, Y. B. 1972, Comments on Astrophysics and Space Physics, 4, 173
- Tremblay et al. (2012) Tremblay, G. R., O’Dea, C. P., Baum, S. A., et al. 2012, MNRAS, 424, 1042
- Ueda et al. (2013) Ueda, S., Hayashida, K., Anabuki, N., et al. 2013, ApJ, 778, 33
- Vikhlinin et al. (2007) Vikhlinin, A., Burenin, R., Forman, W. R., et al. 2007, in Heating versus Cooling in Galaxies and Clusters of Galaxies, ed. H. Böhringer, G. W. Pratt, A. Finoguenov, & P. Schuecker, 48
- Vikhlinin et al. (2006) Vikhlinin, A., Kravtsov, A., Forman, W., et al. 2006, ApJ, 640, 691
- Vikhlinin et al. (2009) Vikhlinin, A., Burenin, R. A., Ebeling, H., et al. 2009, ApJ, 692, 1033
- Voigt & Fabian (2004) Voigt, L. M., & Fabian, A. C. 2004, MNRAS, 347, 1130
- Voit & Donahue (2015) Voit, G. M., & Donahue, M. 2015, ApJ, 799, L1
- Voit et al. (2015) Voit, G. M., Donahue, M., Bryan, G. L., & McDonald, M. 2015, Nature, 519, 203
- Wagner et al. (2015) Wagner, C. R., Brodwin, M., Snyder, G. F., et al. 2015, ApJ, 800, 107
- Walker et al. (2014) Walker, S. A., Fabian, A. C., Russell, H. R., & Sanders, J. S. 2014, MNRAS, 442, 2809
- Wright et al. (2010) Wright, E. L., Eisenhardt, P. R. M., Mainzer, A. K., et al. 2010, AJ, 140, 1868
Appendix A Spectral Energy Distributions
| Cluster | M∗ | SFRUV | SFR[OII] | SFR24μm | |||
|---|---|---|---|---|---|---|---|
| [∘] | [∘] | [1012 M⊙] | [M⊙ yr-1] | [M⊙ yr-1] | [M⊙ yr-1] | ||
| SPT-CLJ0000-5748 | 0.702 | 0.2501 | 57.8093 | 2.54 | 52 | 51 | 85 |
| SPT-CLJ0013-4906 | 0.406 | 3.3306 | 49.1099 | 0.98 | 50 | 8.6 | – |
| SPT-CLJ0014-4952 | 0.752 | 3.7041 | 49.8851 | 1.68 | 10. | – | 92 |
| SPT-CLJ0033-6326 | 0.597 | 8.4710 | 63.4449 | 2.45 | 1300 | 12 | 43 |
| SPT-CLJ0037-5047 | 1.026 | 9.4478 | 50.7890 | 1.00 | 21 | 14 | 170 |
| SPT-CLJ0040-4407 | 0.350 | 10.2080 | 44.1307 | 1.79 | 8.5 | – | 14 |
| SPT-CLJ0058-6145 | 0.826 | 14.5842 | 61.7669 | 1.54 | 24 | – | – |
| SPT-CLJ0102-4603 | 0.722 | 15.6779 | 46.0710 | 0.73 | 15 | – | 79 |
| SPT-CLJ0102-4915 | 0.870 | 15.7407 | 49.2720 | 2.43 | 93 | – | 88 |
| SPT-CLJ0106-5943 | 0.348 | 16.6197 | 59.7201 | 3.38 | 20 | 5.1 | 7.3 |
| SPT-CLJ0123-4821 | 0.620 | 20.7956 | 48.3563 | 2.09 | 3.6 | – | 39 |
| SPT-CLJ0142-5032 | 0.730 | 25.5401 | 50.5410 | 1.39 | 7.7 | – | 92 |
| SPT-CLJ0151-5954 | 1.035 | 27.8634 | 59.9062 | 0.63 | 6.4 | – | 140 |
| SPT-CLJ0156-5541 | 1.221 | 29.0436 | 55.6985 | 0.33 | 400 | – | 210 |
| SPT-CLJ0156-5541 | 1.221 | 29.0382 | 55.7029 | 1.79 | 9.0 | – | 530 |
| SPT-CLJ0200-4852 | 0.498 | 30.1421 | 48.8712 | 3.12 | 34 | 26 | 29 |
| SPT-CLJ0212-4657 | 0.655 | 33.0986 | 46.9537 | 1.47 | 1.0 | – | 49 |
| SPT-CLJ0217-5245 | 0.343 | 34.3122 | 52.7604 | 2.88 | 450 | – | 9.2 |
| SPT-CLJ0232-4421 | 0.284 | 38.0773 | 44.3467 | 2.07 | 17 | – | 11 |
| SPT-CLJ0232-5257 | 0.556 | 38.2058 | 52.9531 | 1.85 | 1.1 | – | 26 |
| SPT-CLJ0234-5831 | 0.415 | 38.6761 | 58.5236 | 0.94 | 50 | 59 | 7.0 |
| SPT-CLJ0235-5121 | 0.278 | 38.9387 | 51.3512 | 3.45 | 13 | – | 14 |
| SPT-CLJ0243-5930 | 0.635 | 40.8628 | 59.5172 | 1.67 | 100 | 10. | 35 |
| SPT-CLJ0252-4824 | 0.421 | 43.2083 | 48.4162 | 1.24 | 59 | 26 | 5.9 |
| SPT-CLJ0256-5617 | 0.580 | 44.1056 | 56.2978 | 1.45 | 11 | – | 35 |
| SPT-CLJ0304-4401 | 0.458 | 46.0707 | 44.0256 | 3.22 | 30 | 17 | 6.1 |
| SPT-CLJ0304-4921 | 0.392 | 46.0673 | 49.3571 | 2.14 | 35 | – | 15 |
| SPT-CLJ0307-5042 | 0.550 | 46.9605 | 50.7012 | 1.97 | 64 | – | 25 |
| SPT-CLJ0307-6225 | 0.579 | 46.8195 | 62.4465 | 1.12 | 4.0 | 14 | 44 |
| SPT-CLJ0310-4647 | 0.709 | 47.6354 | 46.7856 | 2.19 | 8.3 | 11 | 34 |
| SPT-CLJ0324-6236 | 0.730 | 51.0511 | 62.5988 | 1.73 | 13 | – | 57 |
| SPT-CLJ0330-5228 | 0.442 | 52.7374 | 52.4704 | 2.99 | 15 | – | 4.8 |
| SPT-CLJ0334-4659 | 0.485 | 53.5457 | 46.9958 | 0.93 | 8.7 | 79 | 18 |
| SPT-CLJ0346-5439 | 0.530 | 56.7308 | 54.6487 | 2.41 | 120 | – | 5.7 |
| SPT-CLJ0348-4515 | 0.358 | 57.0719 | 45.2498 | 2.32 | 22 | 4.7 | 5.7 |
| SPT-CLJ0352-5647 | 0.670 | 58.2397 | 56.7977 | 1.93 | 6.8 | – | 50 |
| SPT-CLJ0406-4805 | 0.737 | 61.7302 | 48.0826 | 1.57 | 10.0 | 21 | 41 |
| SPT-CLJ0411-4819 | 0.424 | 62.7957 | 48.3277 | 2.17 | – | 5.5 | 15 |
| SPT-CLJ0411-4819 | 0.424 | 62.8154 | 48.3175 | 2.54 | 12 | – | 27 |
| SPT-CLJ0417-4748 | 0.581 | 64.3461 | 47.8132 | 2.33 | 93 | 3.8 | 28 |
| SPT-CLJ0426-5455 | 0.630 | 66.5171 | 54.9253 | 2.89 | 4.7 | – | 51 |
| SPT-CLJ0438-5419 | 0.421 | 69.5734 | 54.3224 | 3.98 | 31 | 23 | 24 |
| SPT-CLJ0441-4855 | 0.790 | 70.4497 | 48.9233 | 1.38 | 13 | – | 61 |
| SPT-CLJ0446-5849 | 1.186 | 71.5157 | 58.8304 | 1.46 | 200 | – | 330 |
| SPT-CLJ0449-4901 | 0.792 | 72.2819 | 49.0214 | 1.36 | 10. | – | 84 |
| SPT-CLJ0449-4901 | 0.792 | 72.2669 | 49.0276 | 1.21 | 88 | 27 | 81 |
| SPT-CLJ0456-5116 | 0.562 | 74.1171 | 51.2764 | 1.48 | 79 | 6.3 | 32 |
| SPT-CLJ0509-5342 | 0.461 | 77.3393 | 53.7035 | 1.54 | 32 | 33 | 16 |
| SPT-CLJ0516-5430 | 0.295 | 79.1556 | 54.5004 | 2.90 | 13 | 27 | 2.5 |
| SPT-CLJ0528-5300 | 0.768 | 82.0222 | 52.9981 | 1.59 | 10. | 15 | 34 |
| SPT-CLJ0533-5005 | 0.881 | 83.4033 | 50.0958 | 0.75 | 16 | 50 | 130 |
| SPT-CLJ0542-4100 | 0.642 | 85.7085 | 41.0001 | 1.86 | 1.4 | – | 28 |
| SPT-CLJ0546-5345 | 1.066 | 86.6573 | 53.7588 | 1.70 | 8.0 | – | 110 |
| SPT-CLJ0551-5709 | 0.423 | 87.8931 | 57.1451 | 0.69 | 37 | – | 17 |
| SPT-CLJ0559-5249 | 0.609 | 89.9301 | 52.8242 | 1.11 | 11 | 16 | 19 |
| SPT-CLJ0655-5234 | 0.470 | 103.9760 | 52.5674 | 0.36 | 3.1 | – | – |
| Cluster | M∗ | SFRUV | SFR[OII] | SFR24μm | |||
|---|---|---|---|---|---|---|---|
| [∘] | [∘] | [1012 M⊙] | [M⊙ yr-1] | [M⊙ yr-1] | [M⊙ yr-1] | ||
| SPT-CLJ2011-5725 | 0.279 | 302.8620 | 57.4196 | 0.71 | – | – | – |
| SPT-CLJ2031-4037 | 0.342 | 307.9720 | 40.6252 | 1.33 | 51 | – | 7.5 |
| SPT-CLJ2034-5936 | 0.919 | 308.5390 | 59.6042 | 1.97 | 4.5 | – | 99 |
| SPT-CLJ2035-5251 | 0.528 | 308.7950 | 52.8564 | 0.72 | 2.8 | 2.4 | 41 |
| SPT-CLJ2035-5251 | 0.528 | 308.7930 | 52.8539 | 0.55 | 120 | – | 31 |
| SPT-CLJ2043-5035 | 0.723 | 310.8230 | 50.5923 | 0.88 | 210 | 110 | 89 |
| SPT-CLJ2106-5844 | 1.132 | 316.5190 | 58.7411 | 0.83 | 200 | – | 260 |
| SPT-CLJ2135-5726 | 0.427 | 323.9060 | 57.4418 | 1.07 | 13 | 8.5 | 13 |
| SPT-CLJ2145-5644 | 0.480 | 326.4660 | 56.7482 | 2.30 | 3.6 | 26 | – |
| SPT-CLJ2146-4633 | 0.933 | 326.6470 | 46.5505 | 1.96 | 9.6 | 34 | – |
| SPT-CLJ2148-6116 | 0.571 | 327.1780 | 61.2795 | 1.04 | 7.5 | – | 39 |
| SPT-CLJ2218-4519 | 0.650 | 334.7470 | 45.3145 | 1.12 | 4.4 | – | 55 |
| SPT-CLJ2218-4519 | 0.650 | 334.7500 | 45.3162 | 1.06 | 1.0 | – | – |
| SPT-CLJ2222-4834 | 0.652 | 335.7110 | 48.5764 | 1.47 | 3.1 | – | 52 |
| SPT-CLJ2232-5959 | 0.594 | 338.1410 | 59.9980 | 2.27 | 110 | 18 | 33 |
| SPT-CLJ2233-5339 | 0.480 | 338.3150 | 53.6526 | 2.58 | 86 | 12 | 13 |
| SPT-CLJ2236-4555 | 1.162 | 339.2140 | 45.9295 | 3.29 | 50 | – | – |
| SPT-CLJ2245-6206 | 0.580 | 341.2590 | 62.1272 | 7.09 | 5.2 | – | – |
| SPT-CLJ2258-4044 | 0.826 | 344.7010 | 40.7418 | 0.62 | 10. | – | – |
| SPT-CLJ2259-6057 | 0.750 | 344.7540 | 60.9595 | 2.15 | 11 | – | 84 |
| SPT-CLJ2301-4023 | 0.730 | 345.4700 | 40.3868 | 1.04 | 36 | – | – |
| SPT-CLJ2306-6505 | 0.530 | 346.7230 | 65.0882 | 1.34 | 14 | 2.6 | 39 |
| SPT-CLJ2325-4111 | 0.358 | 351.2990 | 41.2037 | 3.01 | 9.8 | 11 | 6.7 |
| SPT-CLJ2325-4111 | 0.358 | 351.3000 | 41.1991 | 1.96 | 14 | 5.0 | 8.4 |
| SPT-CLJ2331-5051 | 0.576 | 352.9630 | 50.8650 | 1.53 | 23 | – | 46 |
| SPT-CLJ2335-4544 | 0.547 | 353.7850 | 45.7391 | 1.40 | 41 | 6.7 | – |
| SPT-CLJ2337-5942 | 0.775 | 354.3550 | 59.7058 | 0.13 | 1.00 | – | – |
| SPT-CLJ2337-5942 | 0.775 | 354.3650 | 59.7013 | 2.08 | 4.9 | 40 | 76 |
| SPT-CLJ2341-5119 | 1.003 | 355.3010 | 51.3291 | 1.15 | 2.5 | – | 170 |
| SPT-CLJ2342-5411 | 1.075 | 355.6910 | 54.1847 | 0.90 | 33 | 17 | 240 |
| SPT-CLJ2344-4243 | 0.596 | 356.1830 | 42.7201 | 3.95 | 2000 | 1700 | 2000 |
| SPT-CLJ2345-6405 | 0.937 | 356.2510 | 64.0927 | 1.20 | 71 | – | 250 |
| SPT-CLJ2352-4657 | 0.734 | 358.0680 | 46.9602 | 1.64 | 9.5 | – | – |
| SPT-CLJ2359-5009 | 0.775 | 359.9280 | 50.1672 | 1.25 | 8.2 | 21 | 84 |
Note. — Positions and star formation rates of BCGs used in this study. UV- and [O ii]-derived SFRs are corrected for intrinsic extinction assuming and a gray extinction curve from Calzetti et al. (2000). Systematic uncertainties, which are dominated by the extinction correction in the blue bands and extrapolation to 24m in the IR band, are quoted for all detections. These uncertainties are discussed in detail in §2.5.