11email: tjitske@astro.rug.nl 22institutetext: Harvard-Smithsonian Center for Astronomy, 60 Garden Street, Cambridge, MA 02138, USA 33institutetext: Department of Physics and Astronomy, University of California, Riverside, CA 92521, USA
Dark influences II: gas and star formation in minor mergers of dwarf galaxies with dark satellites
Abstract
Context. It has been proposed that mergers induce starbursts and lead to important morphological changes in galaxies. Most studies so far have focused on large galaxies, but dwarfs might also experience such events, since the halo mass function is scale-free in the concordance cosmological model. Notably, because of their low mass, most of their interactions will be with dark satellites.
Aims. In this paper we follow the evolution of gas-rich disky dwarf galaxies as they experience a minor merger with a dark satellite. We aim to characterize the effects of such an interaction on the dwarf’s star formation, morphology, and kinematical properties.
Methods. We performed a suite of carefully set-up hydrodynamical simulations of dwarf galaxies that include dark matter, gas, and stars merging with a satellite consisting solely of dark matter. For the host system we vary the gas fraction, disk size and thickness, halo mass, and concentration, while we explore different masses, concentrations, and orbits for the satellite.
Results. We find that the interactions cause strong starbursts of both short and long duration in the dwarfs. Their star formation rates increase by factors of a few to or more. They are strongest for systems with extended gas disks and high gas fractions merging with a high-concentration satellite on a planar, radial orbit. In contrast to analogous simulations of Milky Way-mass galaxies, many of the systems experience strong morphological changes and become spheroidal even in the presence of significant amounts of gas.
Conclusions. The simulated systems compare remarkably well with the observational properties of a large selection of irregular dwarf galaxies and blue compact dwarfs. This implies that mergers with dark satellites might well be happening but not be fully evident, and may thus play a role in the diversity of the dwarf galaxy population.
Key Words.:
Galaxies: dwarf – Galaxies: evolution – Galaxies: interactions – Galaxies: irregular – Galaxies: starburst – (Cosmology:) dark matter1 Introduction
In the lambda cold dark matter (CDM) paradigm, small dark matter halos are abundant. Most of these halos, with , are predicted to be strongly affected by reionization, photo-evaporation, and/or supernova feedback (Gnedin 2000; Hoeft et al. 2006; Kaufmann et al. 2007; Okamoto et al. 2008; Gnedin et al. 2009; Li et al. 2010; Sawala et al. 2013; Taylor & Webster 2005; Warren et al. 2007, but see also). These processes thus cause progressively larger numbers of small dark matter halos to be almost completely dark. The existence of such dark galaxies is a solution that is often suggested to the missing satellites problem (Klypin et al. 1999; Moore et al. 1999).
Dwarf galaxies are known to be very inefficient at forming stars (Blanton et al. 2001; Robertson & Kravtsov 2008), to have very low baryon fractions (Gnedin 2000; Hoeft et al. 2006; Crain et al. 2007), and to generally be gas-rich if in the field. This is consistent with the expectation that the stellar-to-halo-mass ratio must decrease steeply toward lower masses (Behroozi et al. 2013; Moster et al. 2013; Kormendy & Freeman 2014; Garrison-Kimmel et al. 2014; Sawala et al. 2015). On the other hand, the halo mass function is predicted to be almost completely scale-free (van den Bosch et al. 2005; van den Bosch & Jiang 2014), i.e., similar for field dwarf and large disk galaxies. However, the subhalos of dwarf galaxies must have much lower baryonic component masses, and so most of their satellites will be dark (Helmi et al. 2012).
Mergers of gas-rich galaxies are often thought to give rise to bursts of star formation (Mihos & Hernquist 1994a, b; Teyssier et al. 2010; Bournaud et al. 2011), although simulations suggest this depends on the merger mass ratio (e.g., Di Matteo et al. 2007). From the observational perspective, (see e.g., Ellison et al. 2011; Willett et al. 2015), even minor mergers have been shown to significantly contribute to local star formation (Kaviraj 2014a, b; Willett et al. 2015). In the case of dwarf galaxies it has been suggested that interactions are responsible for the class of blue compact dwarfs (BCDs) (Paudel et al. 2015): dwarf galaxies with a significant, centrally concentrated young stellar population (e.g., Gil de Paz et al. 2003). In general many dwarf systems with increased star formation rates have been found to be irregular or to show signs of disturbances (Taylor et al. 1995; Ekta & Chengalur 2010; López-Sánchez 2010; Holwerda et al. 2013; Lelli et al. 2014b; Knapen & Cisternas 2015), but in a number of cases no visible companion has been found (Brosch et al. 2004; Ekta & Chengalur 2010; López-Sánchez 2010; Lelli et al. 2014b). Other possible origins of the increase in star formation and the irregular morphology are cosmological gas inflows (see for example Verbeke et al. 2014) or re-accretion of material blown out by previous starbursts, and varying internal instabilities (e.g., Meurer et al. 1998; van Zee et al. 2001; Lelli et al. 2014a; Elmegreen et al. 2012; Bekki & Freeman 2002).
In view of the above discussion, it appears plausible that some of these starbursts could be induced by interactions with dark satellites. Following the first paper by Starkenburg & Helmi (2015) here we focus on the effect of a merger on a gas rich dwarf galaxy. Starkenburg & Helmi (2015) ran a suite of collissionless simulations of dwarf galaxies and their dark satellites, and showed that these could severely alter the morphology and kinematics of the dwarf. In this paper we extend these simulations to dwarf galaxies with varying gas fractions and study the effects of the merger on the star formation rates, gas and stellar morphology and kinematics. The initial conditions of the dwarf galaxies and their satellites and the parameters for the simulations are described in Sect. 2. We report our results and their dependence on properties of the systems and the interactions in Sect. 3. We compare these SPH-results with the collissionless simulations from Starkenburg & Helmi (2015) in Sect. 4 and to observational results in Sect. 5. We conclude by discussing our results in Sects. 6 and give a summary of our main findings in Sect. 7.
2 Models
We perform a suite of controlled simulations of isolated dwarf galaxies and mergers with their (dark) satellites. The simulations are run using the OWLS version (last described in Schaye et al. 2010) of the N-body/SPH-code Gadget-3 (based on Springel et al. 2001; Springel 2005) with implementations for star formation and feedback as described in Schaye & Dalla Vecchia (2008); Dalla Vecchia & Schaye (2008).
2.1 Initial conditions
The setup of the initial conditions is based on Springel et al. (2005); Schaye & Dalla Vecchia (2008); Dalla Vecchia & Schaye (2008) and a more complete description can be found in Starkenburg & Helmi (2015). Here we briefly describe the initial structure of the dwarf galaxy and of the satellite. The values of the structural and orbital parameters for all the simulations are listed in Tables 1 and 2.
2.1.1 Main (disky dwarf) galaxies
The host dwarf galaxies have several components including a dark halo, a stellar disk and a gaseous disk. The dark matter halo follows a Hernquist profile (Hernquist 1990),
| (1) |
where the parameters and are set by an equivalent NFW (Navarro et al. 1996) profile, such that the total mass of the Hernquist halo equals the virial mass of the NFW halo and their profiles have similar inner densities () (Springel et al. 2005).
We consider three different concentrations for the halos: 5, 9 and 15. The latter two are consistent with the mass – concentration relation found in large cosmological simulations (Macciò et al. 2008; Muñoz-Cuartas et al. 2011) for the mass-scale considered here. The lowest corresponds to the best-fit NFW model for the Fornax dwarf spheroidal galaxy from Breddels & Helmi (2013). The velocities of the halo particles are set using the distribution function of a Hernquist halo. Since the contribution of the disk is hereby initially neglected, the halo shows a slight adiabatic contraction at the start of the simulations, which stabilizes within approximately 0.5 Gyr.
The stellar masses of the systems follow generally (extrapolated) stellar mass – halo mass relations available in the literature (Behroozi et al. 2013; Moster et al. 2013; Garrison-Kimmel et al. 2014; Sawala et al. 2015). The gas fraction, , ranges from to in agreement with observational estimates (Huang et al. 2012; McQuinn et al. 2015). This means that the baryonic mass can be quite high, and that in the most gas-rich systems .
Both the stellar and gaseous disk follow an exponential surface density profile with radius. The scale lengths of the stellar disks are close to the values expected from Mo et al. (1998); Springel & White (1999) for the and systems, and also for the lowest mass dwarf () with dark matter halo, assuming that the disk angular momentum fration equals the disk mass fraction (). For completeness we explore for two systems ( and ) smaller disk scale lengths. For all disks the exponential radial profiles and the scale lengths are stable during evolution in isolation. The stellar disk is further described by an isothermal vertical distribution with a constant scale height such that :
| (2) |
We consider thicker disks for the lowest mass simulated galaxies. This is in concordance with observations (Yoachim & Dalcanton 2006; Sánchez-Janssen et al. 2010) and also expected since gas cooling is less efficient in smaller halos (Kaufmann et al. 2007; Robertson & Kravtsov 2008).
We explore two different scale lengths of the gaseous disk in comparison to the stellar disk, namely , and . The vertical distribution of the gas is determined by requiring hydrostatic equilibrium,
| (3) |
Using an effective equation of state (EOS), with , this can be written as
| (4) |
In our simulations we use the effective equation of state of the multiphase ISM model by Schaye & Dalla Vecchia (2008); Dalla Vecchia & Schaye (2008). The gas is governed by the effective equation of state when the density of the gas is above the threshold for star formation as set by the subgrid physics discussed in Sect. 2.3, while at lower densities the gas is assumed to follow an isothermal equation of state.
The vertical distribution of the gas can be iteratively determined as a function of radius using a fine logarithmic grid in the – plane (Springel et al. 2005), where the surface density of the gas, , is set by the exponential radial profile and the chosen scale length,
| (5) |
To calculate the potential in Eq. (4) we follow Springel et al. (2005) in using a tree code and a discretized mass distribution to represent the disk components, adding contribution of the dark matter halo analytically, and use a grid of in the radial, vertical and azimuthal directions.
In Starkenburg & Helmi (2015) we adapted the way in which the velocity structure of the stellar disks is set up. Contrary to large galaxies, for lower mass systems the epicyclic approximation breaks down in a large part of the disk which, if used, can cause a non-physical streaming velocity. Therefore we set up the velocity structure only assuming the epicyclic approximation in the part of the disk where it is still valid and fit a smooth quadratical curve to the rotation curve closer in. Moreover, the potential of the model dwarf galaxies is dominated by their dark matter halo at all radii, so we assume that the velocity ellipsoid is aligned with the spherical coordinate system instead of the cylindrical coordinate system of the disks. For the gas, the initial azimuthal streaming velocity is determined through the gravitional, pressure, and centrifugal forces:
| (6) |
2.1.2 Satellites
The satellite consists solely of a dark matter halo with a mass of of the dwarf galaxy’s halo mass in most of our simulations. Its concentration is determined by following the mass – concentration relation from Muñoz-Cuartas et al. (2011). In Sect. 3.2.2 we explore the effect of a two or four times smaller mass and a higher concentration for the satellite.
Most of the satellite orbits we consider are close to completely radial with initially none or a small (prograde) tangential velocity, although we also explore more circular orbits (see Table 2 and Sect. 3.2.1). At the start of the simulations the satellite is placed at a distance of from the center of the host with a radial velocity that is small with respect to the local circular velocity (so the satellite is initially close to apocenter). The orbit is either in the plane of the host disk or has an inclination of 30 (or in one case 60) degrees, similar to other studies of disk thickening (Villalobos & Helmi 2008; Moster et al. 2010).
2.2 Numerical parameters
We consider two different numerical setups for the host dwarf galaxies. For the disk3-gas (models C4 and C5) and FNX-gas (models E1 and E2) systems that we compare to the collissionless simulations of Starkenburg & Helmi (2015), we use particles to represent the dwarf’s dark matter halo and particles for the gaseous and for the stellar disk irrespective of the value of . For all other hosts the baryonic particles are divided among gas and stars according to so that all gas and star particles have initially equal mass, and the dark halo is represented by particles.
The satellite is in all cases represented by particles which gives a dark matter particle mass for the satellite of . The softening lengths used are kpc and kpc for the host halo and satellite respectively, and kpc for both the gas and stars. These values are chosen following Villalobos & Helmi (2008) and Athanassoula et al. (2000) and produce stable systems. All numerical parameters are summarized in Table 3.
2.3 Star formation and feedback prescription
We use the star formation and stellar feedback prescription from Schaye & Dalla Vecchia (2008) and Dalla Vecchia & Schaye (2008). The star formation prescription is based on empirical laws and has very good numerical properties. Schaye & Dalla Vecchia (2008) have shown how the gas surface densities in the Kennicutt-Schmidt law (Kennicutt 1998) can be related to pressure by assuming that the scale height of the gas disk is of order of the local Jeans scale and that the gas is in local hydrostatic equilibrium and self-gravitating. This is combined with a polytropic effective equation of state for the multiphase interstellar medium with a slope of , which always ensures a constant Jeans mass (so independent of the local gas density). We follow Schaye (2004) in using a density threshold which corresponds to a surface density threshold of and a temperature threshold of K (Schaye & Dalla Vecchia 2008). We do include radiative cooling but no metals and therefore no metal-line cooling or chemical enrichment.
The feedback model is described in Dalla Vecchia & Schaye (2008) and consists of kinetic supernova winds. The model is governed by the wind speed , and mass loading , which are related to the fraction of the kinetic energy injected by supernovae (SNe) per solar mass, , also called the feedback efficiency as
| (7) |
Following Dalla Vecchia & Schaye (2008) we set which is appropriate for a Chabrier (2003) initial mass function, a stellar mass range – and all stars above ending as core-collapse SNe. The wind particles remain as such for and during that time are not able to be kicked again by another SN or participate in star formation, but they are not decoupled hydrodynamically.
Both observational data (Schwartz & Martin 2004; Martin 2005) and theoretical models (Okamoto et al. 2010; Lagos et al. 2013) suggest that wind velocities are lower and the mass loading rates are higher for low mass galaxies and low star formation rates. Therefore, rather than making a single choice for the numerical parameters, we experimented with a selection of different parameters values as described in the next section.
2.4 Evolution in isolation
2.4.1 Exploration of subgrid parameters
To identify a reasonable default model for the dwarf galaxies we explored a small set of combinations of the large parameter space and varied two of the stellar feedback parameters, namely the wind speed (, , , , and km/s) and the mass loading (2, 8, 10, 20, 30, 40, 50).
Our goal is for a galaxy in isolation to have a fairly continuous star formation rate on a timescale comparable to that of the merger. This is important to be able to pin down to the effect of the merger. However since we do not model fresh gaseous infall all star formation rates will decline due to gas depletion. We also pay attention to ensure that the gas is not all converted into stars or blown away by stellar feedback too quickly. Nonetheless, a tight correlation exists between the initial gas mass and its distribution and the early star formation rate. Via the threshold for star formation, this also depends on the gravitational potential (and hence on the mass and concentration of the dark matter halo and the mass, scale length, and scale height of the stellar disk).
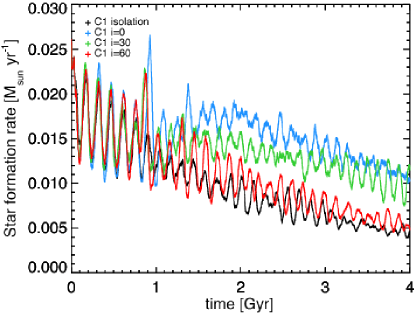
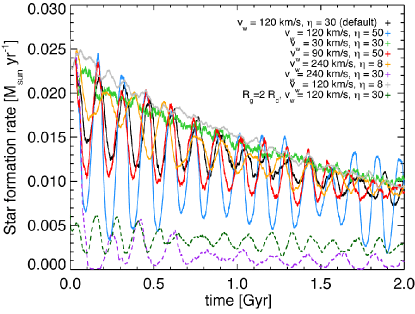
The star formation rate over a period of 2 Gyr for the dwarf galaxy model C1 (, , , and ), for varying feedback parameters is shown in Fig. 1. The star formation rates for all prescriptions are within a factor of a few of each other and in all cases star formation is sustained over a long timescale. For the more extended gas disk (, dashed dark green) the star formation rates are about a quarter of the -case (black). For the most efficient feedback ( and so , dashed purple) the gas disk is blown apart right after the onset of star formation and subsequent star formation occurs at a similar rate as for the more extended gas disk. The periodicity seen in the first Gyr is driven by the fact that star formation starts in the whole disk at the same time. This is enhanced if the disk is not perfectly centered in the potential but is reduced at later times and for lower star formation rates. The amplitude of the oscillations in star formation also depends on the star formation and feedback parameters. For example the amplitude of the periodicity is larger for higher mass loading of the wind (compare for example the gray, black, and blue star formation rates in Fig. 1). Reassuringly, the evolution is very similar for settings with comparable feedback efficiencies (see for example the red, yellow, and black curves in Fig. 1 all with ).
We tested the influence of decoupling the wind particles from star formation by comparing with a run without decoupling, and found that this does not change the star formation rate and evolution of the gas disk. We further explored the effects of using higher values for the density threshold (1 and 10 cm-3), as proposed in the recent literature (e.g., Governato et al. 2010), but found that this restricts star formation to the very center of the galaxy and does not enhance the fragmentation of the disk gas as we do not include metal-line cooling, and therefore does not lead to a more realistic system.
As default model we take the star formation and feedback parameters corresponding to the black curve in Fig. 1 for (dark green for ). The default wind velocity is km/s with a mass loading of , resulting in .
2.4.2 The default model
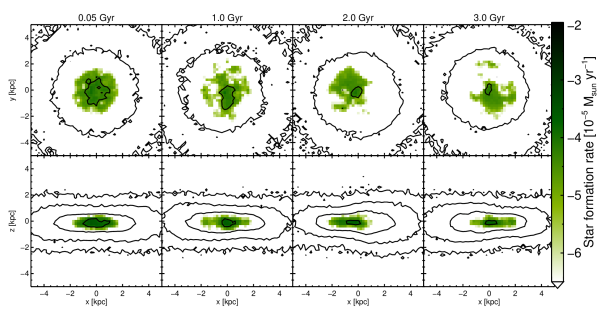
Figure 2 shows snapshots of the gas distribution and state for one of the most massive dwarf galaxies, model A ( and ), evolved in isolation. For all plots in this paper the plane of the disk is defined as the plane perpendicular to the angular momentum vector of the inner 50% of the initial stellar disk particles. As mentioned above the stellar feedback parameters are set such that the star formation rate and the disk of the dwarf galaxy are reasonably stable for several Gyr. Since the gas in the outskirts of the disk is not dense enough, most of the star formation takes place within the central for this model). Due to the stellar feedback which blows gas away that eventually falls back again, the star formation is patchy and locally bursty.
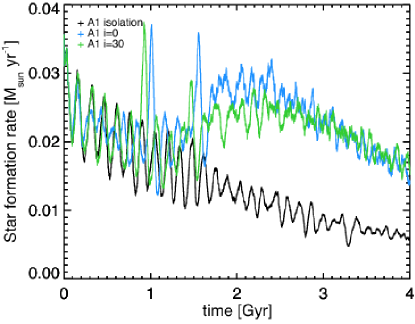
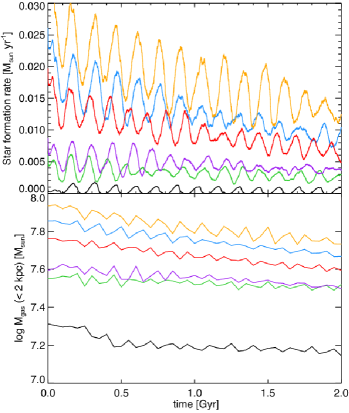
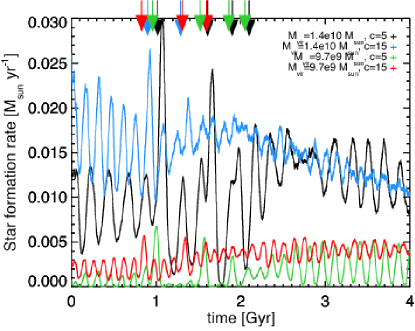
The star formation rates (SFR) for a subset of the dwarf galaxies run in isolation using our default star formation and feedback parameters are plotted in the top panel of Fig. 3. The average amplitude of the star formation rate clearly depends on the total mass of the galaxy, the amount of gas in the disk and its initial extent. Indeed, for a more extended disk set up in equilibrium, a smaller fraction of gas will be above the density threshold for star formation.
The amount of gas in the central part of the disk is shown in the bottom panel of Fig. 3. That both the gas fraction and the mass of the dwarf galaxy are important is made explicit by comparing model B (, and , red) and model C1 (, , , blue). The bottom panel of Fig. 3 shows that although the more massive dwarf galaxy model B has times more mass in dark matter and stars initially, the lower mass system model C1 actually has a slighty higher gas mass ( versus , due to the higher gas fraction) and a higher star formation rate. After 2 Gyr the stellar masses of the two systems are similar and also the gas fractions are more comparable than initially.
Although the simulated systems have slowly declining star formation rates in general (as a result of the lack of external gas infall), they agree quite well with observations, also in terms of gas content (Hunter & Elmegreen 2006; Weisz et al. 2012; Ott et al. 2012; Warren et al. 2012; Huang et al. 2012; McQuinn et al. 2015). However, the lower mass disks tend to be more extended, slightly thinner, and have lower surface brightness compared to observations. We make a more detailed comparison with observations of the isolated and merger remnant dwarf galaxies in Sect. 5.
3 Starbursting dwarfs as the result of an interaction
In this Section we compare first the behaviour of one of the highest (model A) and one of the lowest (model D1) mass dwarfs, as they interact with a dark satellite. We describe the general properties and then address in more detail how the interacting systems vary depending on the properties of the satellite, its orbit, and the host. In all cases explored the evolution is quite different from the dwarfs in isolation, as the majority of the systems experience starbursts of varying strength.
3.1 Two examples
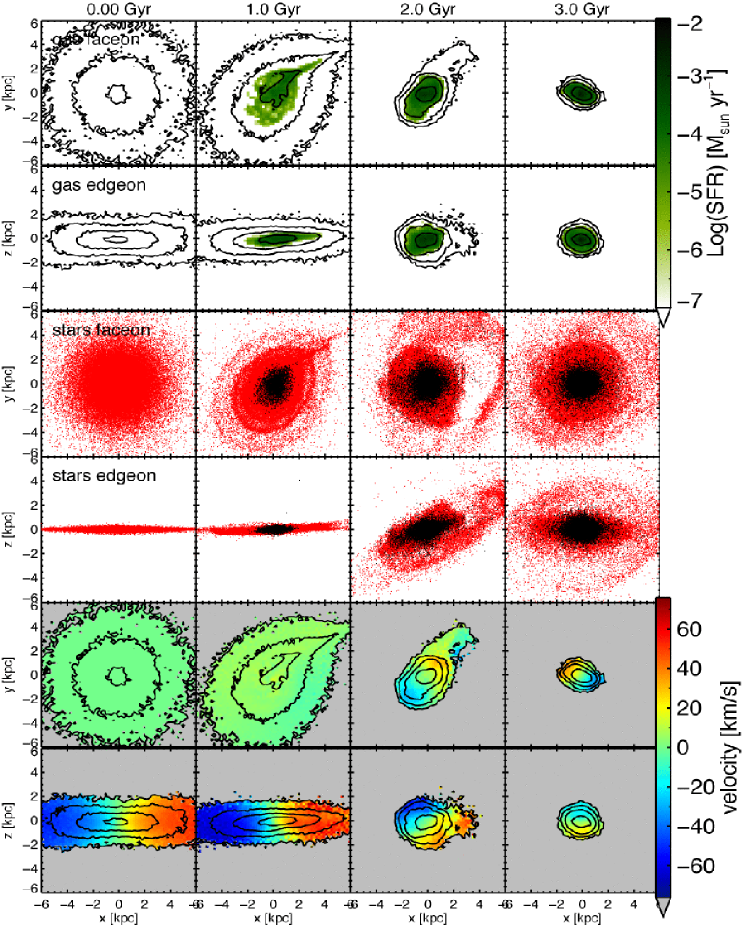
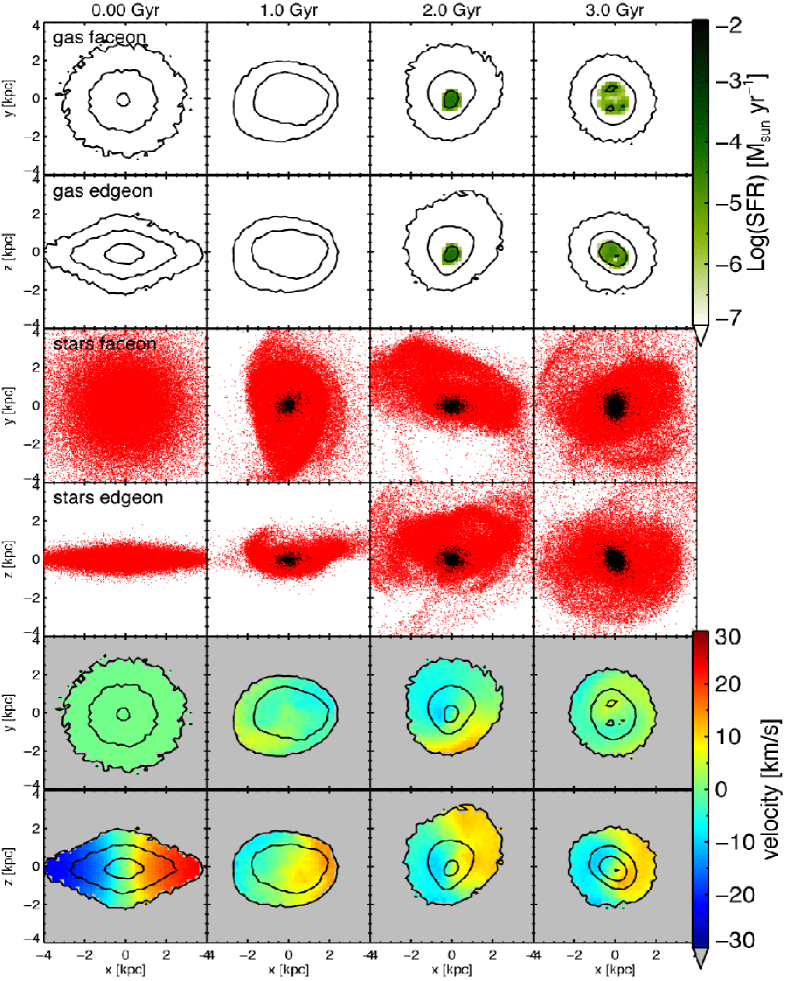
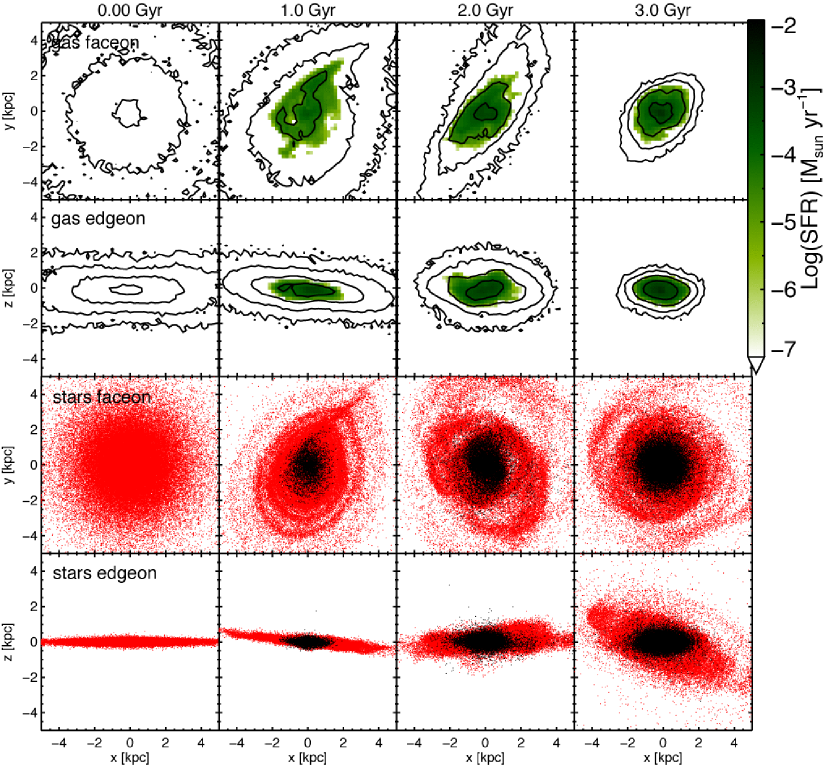
Figure 4 shows a series of snapshots of the evolution of the system of Fig. 2, model A () with , now merging with a satellite on a co-planar very radial orbit. The stellar disk thickens, tilts, and develops tidal arms and rings. The gaseous disk depicts minor tidal arms and becomes quite asymmetric. Most importantly gas is driven into the center of the dwarf galaxy due to tidal torques, which leads to a strong increase of the star formation rate as we discuss below.
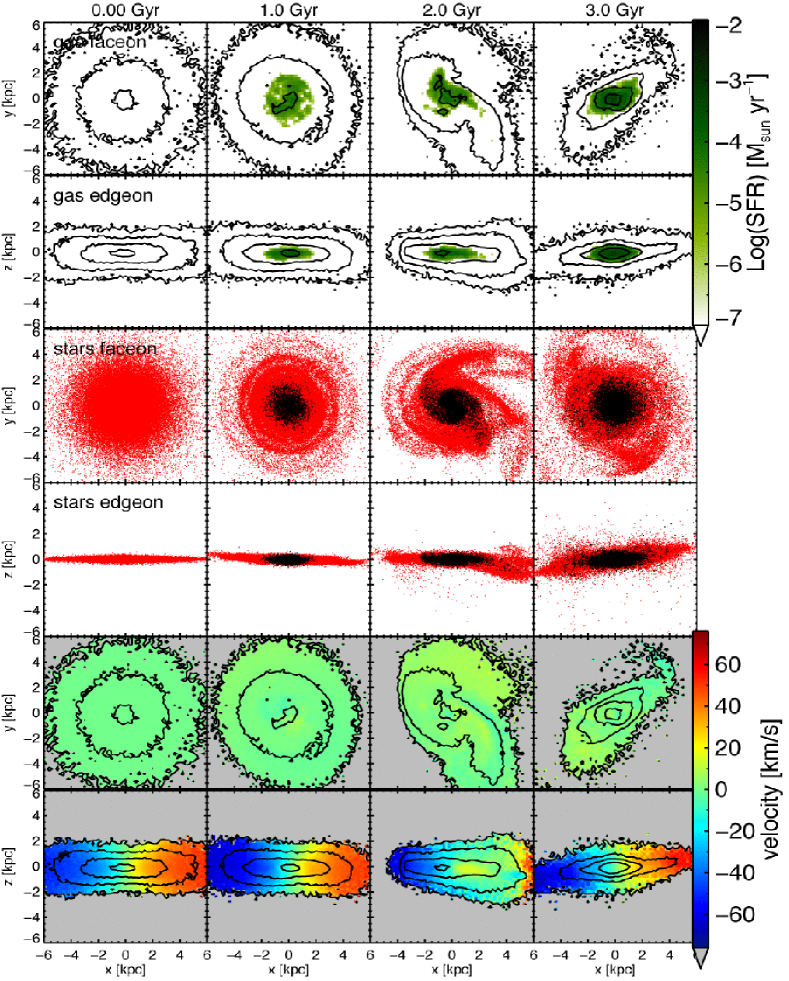
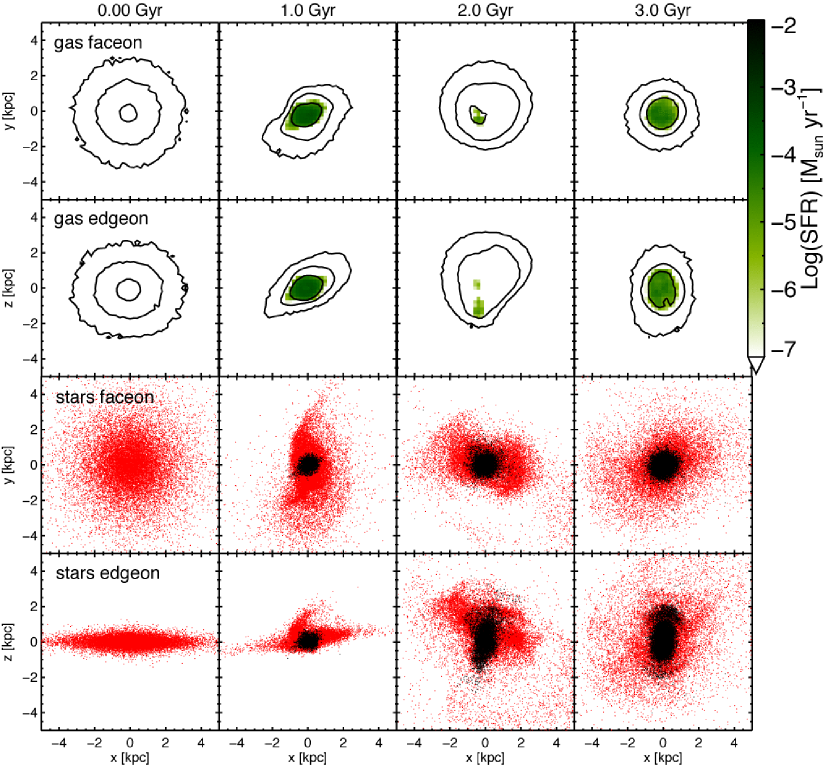
Fig. 5 shows the evolution for the lower mass model D1 () merging with the satellite on a very radial 30 degrees inclined orbit. Similar to what was found in Starkenburg & Helmi (2015), for this smaller mass object the effect of the satellite on the stellar disk is much stronger. The stellar morphology of the remnant is spheroidal, for both the old and the newly formed stellar populations (see the rightmost panels of Fig. 5). The gas disk is severely disturbed, although no strong tidal tails form. As can be seen in the third panel of the top two rows, the presence of the satellite can cause off-center starbursts.
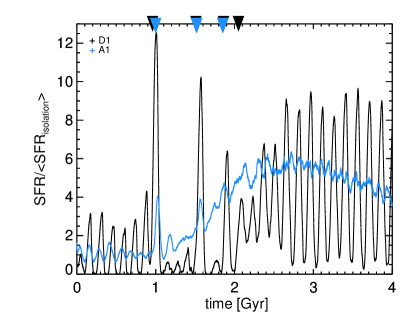
Fig. 6 shows clearly the effect of the merger on the SFR for these two systems. Both for model A (blue) and D1 (black) the star formation rates are increased by factors 3 up to 12. This happens not only during the merger process itself with sharp strong peaks at or just after pericenter passages, but more strinkingly for a rather extended period. The relative amplitude of the increase in the SFR is similar for both systems, although in an absolute sense, the more massive object naturally has a higher SFR, reaching values of yr-1. Note as well from Figs. 4 and 5 that in both cases the gas disk at the end of the simulation is much more compact than initially.
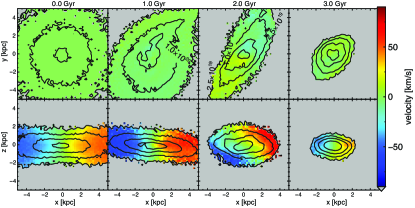
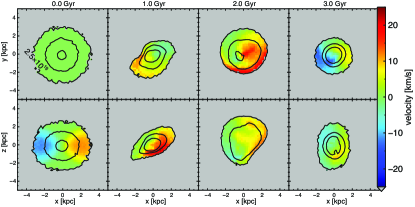
In Figures 7 and 8 we plot the evolution in the rotational velocity for the two systems shown in Figs. 4 and 5, respectively. The rotational motion of the gas disk of model A seems to increase first (see the left middle panel of Fig. 7) and then strongly decreases as the gas disk shrinks until the significantly smaller maximum circular velocity km/s is reached. Nonetheless, the velocity field generally remains rather robust during the merger. For the lower mass system, which depicts a smaller amplitude of rotation initially, the velocity field is much less conspicuous and ordered during and after the merger. Note that at the end, the maximum rotation signal is found for what we have defined as the “face-on” view of the system, although this characterization is debatable given the spheroidal shape of the remnant.
3.2 Variation in properties of the satellite
For a significant effect, the satellite must reach the stellar and gas disks of the dwarf galaxy within a short timescale to be apparent in our simulations. Satellites on orbits that are close to circular will take a longer time to sink to the center. This is longer than the few Gyr run-time of our non-cosmological simulations to limit environmental and cosmological effects, such as the lack of cosmic gas inflow. Moreover, the strength of the perturbation depends on the average density ratios of the satellite to the host. To explore the dependencies of the mergers on the satellite’s properties we consider a number of different orbits, and satellites with different concentrations (and central densities), for three different mass ratios: (our default), , and .
3.2.1 The satellite orbit
Figure 9 compares the star formation rates for the dwarf galaxy model A experiencing a 1:5 merger with the same (high concentration) satellite on three different orbits. For less radial orbits the disk forms large tidal spiral arms (compare for example Figs. 18 and 19 in the Appendix) and the subsequent increase in star formation only starts when the satellites comes within of the center. For the most extreme example shown here (the red line in Fig. 9) this happens only at – Gyr, i.e. at the end of the simulation run.
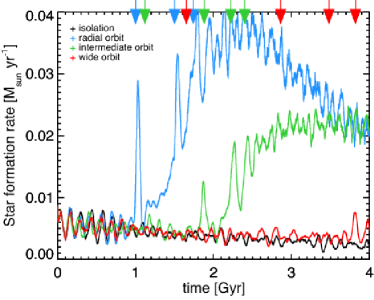
For more circular orbits the spiral arms that are generated in the gas (and stellar) disk are more pronounced. Nevertheless, for the radial orbit the gas is much more concentrated after the merger, which suggests that more gas is funnelled to the center due to tidal torques.
We also experimented with different inclinations for the satellite orbit with respect to the plane of the disk (see Figs. 20 and 21 for examples). In general we find that an inclination of 30 degrees has a larger effect on the morphology and kinematics of the stellar disk (see also our collissionless simulations described in Starkenburg & Helmi 2015) but drives less gas to the center and produces a smaller increase in star formation rates compared to a co-planar orbit.
3.2.2 Satellite mass and concentration
For our default setup the satellite mass is 20% of the virial mass of the host dwarf galaxy. This choice is motivated by the fact that interactions with such objects can be devastating and may not be so rare. Helmi et al. (2012) have estimated that dwarf galaxies experience on average 1.5 such encounters in a Hubble time, but encounters with smaller mass objects are certainly more common in the CDM cosmological model.
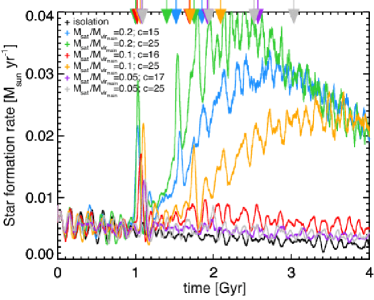
We explore the effect of 1:10 and 1:20 mergers for the most massive dwarf galaxy (model A) with , and place the satellites on a radial, planar orbit. We consider satellites following the mass–concentration relation from Muñoz-Cuartas et al. (2011) and also having a higher concentration of .
The resulting SFR are shown in Fig. 10. In all cases the amplitude of the starburst depends most strongly on the mass and secondly on the concentration of the satellite, although the latter dependance is weaker the lower the mass of the satellite. Note also that the onset of the major starburst is later for smaller mass satellites. This is because the satellite sinks in more slowly, i.e. the pericenter passages where star formation is triggered occur later.
For all satellites, higher concentration leads to slower mass loss, hence to more damage to the host. This results in a larger increase in its SFR and to a stronger morphological disturbance of stellar and gaseous disks, with the final gas distribution being more centrally concentrated. While gas gets blown out of the disk in all cases, in the interaction with the highest mass and satellite the gas reaches , about twice as far as for the other cases.
In summary, in all cases (although very minor for ), there is a first strong peak of star formation at the first pericentric passage of the satellite, and a more extended in time starburst, also driven by the merger. Secondary peaks associated to subsequent pericentric passages are also present but are generally less conspicuous.
3.3 Influence of properties of the host dwarf galaxy
The structure of the dwarf galaxy itself can significantly alter the effects of the minor merger on the gas and star formation. We vary the halo mass and concentration, the gas fraction and extend of the gas disk, and the scale length and scale height of the stellar disk. Of these, varying stellar disk parameters causes only very minor differences on the gas and star formation.
3.3.1 Gas distribution
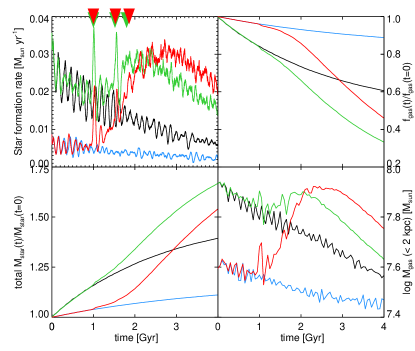
We explore now the evolution of a disky dwarf galaxy when the gas disk has different extent than the stellar disk, since this characteristic is often seen in large spiral galaxies. A comparison between the merger properties for model A with and with can be seen in Fig. 11.
Due to the lower initial star formation rate for the more extended (and hence lower surface density) gas disk, this system has a larger gas reservoir at the time of the merger (see top right panel). The bottom right panel of Fig. 11 shows that the increase in gas mass near the centre is much higher for the initially more extended disk during the merger (red curve) than for the less extended gas disk (green). However, the final increase in stellar mass is still higher for the system with , mostly due to its initially larger star formation rate.
In general more extended disks have lower star formation rates both in isolation and during the merger. This is because the same amount of gas is distributed over a larger area and therefore the amount above the star formation threshold is much lower.
3.3.2 Host’s dark matter halo mass and concentration
Figure 12 shows the star formation rates for the dwarf galaxies models C1 and C3, and D1 and D2 which have different dark matter halo concentration and mass. Even though the difference in halo mass between models C and D is only a factor , due to the steepness of the halo mass – stellar mass abundance matching relations (Behroozi et al. 2013; Moster et al. 2013; Garrison-Kimmel et al. 2014; Sawala et al. 2015) the difference in stellar mass and gas mass is a factor . For these runs the stellar disk is thick initially (), , , and the satellite has a mass of 20% of the host halo on radial orbit with an inclination of 0 or 30 degrees.
As noted before, higher (central) mass implies initially higher SFR, and thus also during and after the merger (compare black and green, and blue and red curves). A less concentrated host halo initially has a puffier gas disk and lower SFR, but during a merger the enhancement in the SFR is larger, as depicted by the black curve in Fig. 12 for model C3. Therefore we see that the susceptibility of the system to a merger depends both on virial mass of the host and on its concentration.
4 Comparison with collissionless runs
In this section we compare the dwarf galaxies models C4 and C5 (disk3-gas) and E1 and E2 (FNX-gas) with the results from the “equivalent” collissionless simulations in Starkenburg & Helmi (2015). Our focus is on how the presence of the gas changes the characteristics of the merger remnants.
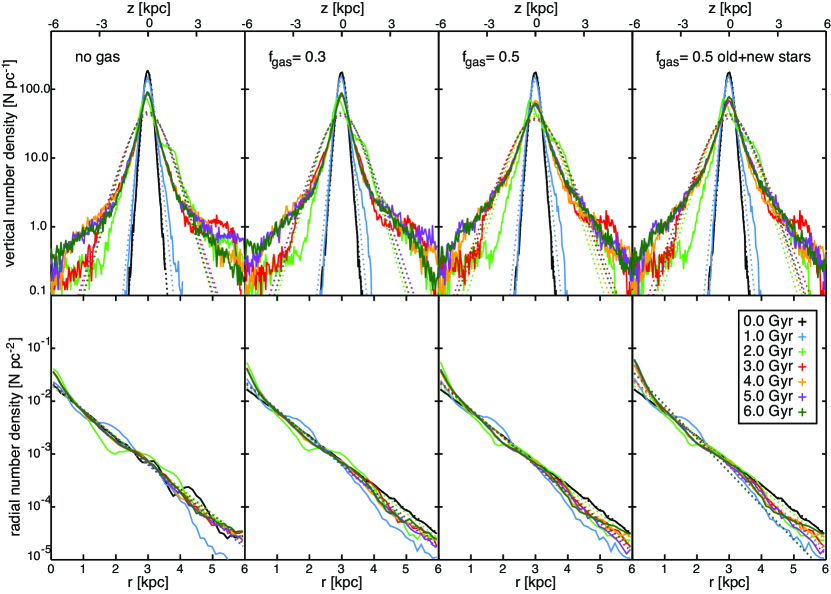
The morphological and kinematical changes to the stellar component of both dwarf systems are very similar to the fully collissionless runs. We exemplify this in Fig. 22 of the Appendix, and more quantitatively in Figure 13. This figure shows the vertical and radial density profiles of the stellar disks of the initially thick FNX-analog system from Starkenburg & Helmi (2015) (left panels) and for the counterparts with and (central panels). In all three cases the strongest changes occur during the first pericenter passages of the satellite, within 2 Gyr of the start of the simulations. The differences in the structural evolution of the stellar disks are surprisingly small. The major difference is that for the fully collisionless system the radial profile of the disk is slightly more unstable and has more substructure. Even the newly formed stars in the runs including gas do not significantly change the stellar density profiles as can be seen in the rightmost panels of Fig. 13, but they give rise to a small central bulge (compare the bottom panels). For the more massive disk3 (models C4 and C5) the inclusion of gas also has a small effect, and leads to a slightly thicker stellar disk in the post-merger phase, more so for higher gas fractions.
The effect of the merger on the kinematics of the stars do not differ much when gas is included in the disk. For example, for the FNX-like system in both cases the rotation decreases over the whole disk while the circular velocity increases due to the accretion of the dark matter satellite. All velocity dispersions increase, and even increase slighly more in the presence of a gas disk. This might be due to the fact that the gas disk is not very thin due to the low mass of the dwarf galaxy halos and therefore exerts less of a pull toward the disk midplane compared to a purely stellar disk.
Therefore, the presence of gas in the disk has no significant influence on the effects of minor mergers on dwarf galaxies. This is in striking contrast to what happens in similar simulations for higher (Milky Way) mass galaxies (see discussion in Sect. 6).
5 Comparison to observations
We now compare the properties of our simulated dwarf galaxies, in isolation and during the merger, with the observational samples described in Table 4. This comparison includes systems from HI-selected, as well as mass-selected samples and general compilations.
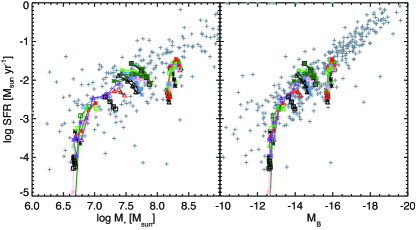
The left panel of Fig. 14 shows the SFR versus stellar mass for the systems discussed in this paper compared to observational values reported in Weisz et al. (2012), Huang et al. (2012), and McQuinn et al. (2015). For each simulation the evolution of the SFR and are plotted at four epochs in steps of 1 Gyr, from 1 Gyr after the start of the simulation. The black symbols correspond to the runs in isolation while in color we show the mergers. Overall the star formation rates match very well those from observations for their stellar masses.
To estimate the luminosities and surface brightness of our simulated galaxies we need to assume mass-to-light ratios for the stellar particles. One possibility for the stellar particles formed during the simulation would be to use stellar population models as we know their ages. For the stellar particles initially present in the simulation however the age distribution would be arbitrary. Therefore, we instead fitted a linear relation to the –B magnitude distribution for the galaxies in the observations of Weisz et al. (2012) and McQuinn et al. (2015) and apply it to the simulated dwarf galaxies. The resulting estimated values are roughly consistent with an average mass-to-light ratio of , which is quite reasonable as the light is very strongly dominated by young stars. The right panel of Fig. 14 shows SFR against the B-magnitude for our systems and for a larger sample of observations. Good agreement is also found in this case.
|
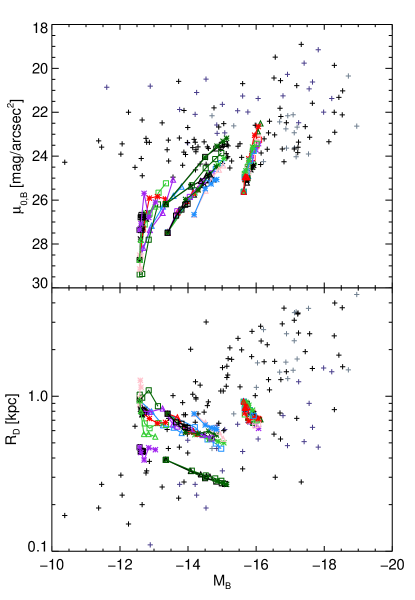
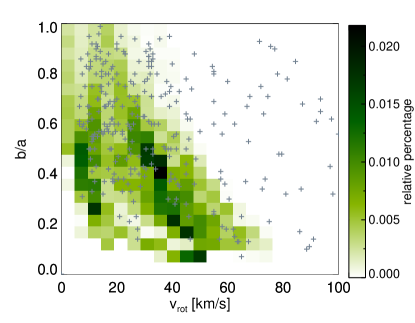
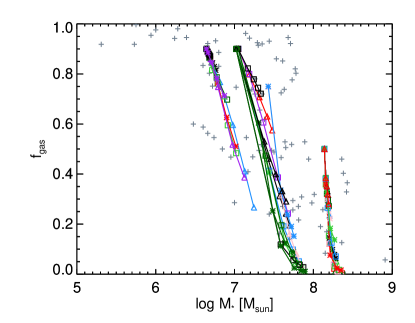
Figure 15 shows that also the initial gas fractions and their evolution in time agrees very well with observations. The downward trend seen in the simulated systems is due to the fact that we do not include fresh gas inflow. However, sampled at an arbitrary point in time, the match is quite remarkable.
We compute radial surface brightness profiles for the face-on disks and fit an exponential profile to derive the disk scale length and half-light radius. This process is similar to that of Hunter & Elmegreen (2006) and we compare our disks with their observational results. We derive central surface brightness using the mass/luminosity within the innermost, kpc, bin in projection. The results are shown in Fig. 16. It is clear that while the higher mass disks match very well with the observations, the lower mass systems seem to be more extended and fainter, compared to the observations. There are two main possible reasons for this: low surface brightness, extended systems are harder to observe. On the other hand, the method we used to compute the initial size of the systems and to set up our simulations (using the disk mass and properties of the halo following Mo et al. 1998) might break down for lower mass systems, as they typically are thicker and deviate from being thin disks. To estimate the effect of this we have also run the two lower mass systems with initial disk scale lengths half their default values and, not surprisingly, we find that they agree better.
In Fig. 17 we compare our “observed” axis ratios and rotational velocities to the observed axis ratios of all galaxies with from the catalog of nearby galaxies (450 when the Milky Way is excluded) by Karachentsev et al. (2004). The intrinsic axis ratios are computed by fitting an ellipsoid to the stellar particle distribution (normalized by the ellipsoidal distance of the particles within this ellipsoid, Allgood et al. 2006). The ellipsoids are centered around the center of mass defined by the stellar component and the axis ratios computed for particles within major axis length of , but we find similar results when considering particles within and even . These intrinsic minor-to-major axis ratios are in agreement for most of the merger remnants, but the default initial disks are often thinner than the observations444Initially thicker disks (), which might be expected for dwarf galaxies that form in gas that has cooled less efficient than in larger disks (Kaufmann et al. 2007; Robertson & Kravtsov 2008), already agree well with the observational points.. However, most systems will not be observed edge-on, and therefore to provide more realistic estimates of “observed” axis ratios we put each system at 100 random inclinations and compute projected axis ratios at five evenly spaced epochs during the simulation.
For the rotational velocities, we assume that for the observational sample and compute the rotational velocities for our modelled systems as the mean between the minimum and maximum value of the velocity maps (as in Fig. 7), which give the velocities in the disk within the column density contour of (which is close typically to ).
Inspection of Figure 17 shows when including the (random) inclination angle, the sample of simulated dwarf galaxies agrees very well with the observed sample. Surprisingly, even the trend that the lower-mass stellar disks are more extremely perturbed by the minor merger is apparent.
Overall, our systems agree well with properties of observed dwarf galaxies.
6 Discussion
In this paper we show the effects of minor mergers with a dark satellite on gas-rich dwarf galaxies. The isolated systems a carefully set up and we have explored the effects of varying the subgrid parameters on the results. Our star formation and feedback prescriptions lead to reasonable dwarf galaxies when evolved in isolation, and their properties are fairly stable against varying these parameters. Only extremely efficient feedback gives a completely different and unrealistic evolution. We have also carried some of the merger experiments for different feedback schemes and found that the effects of the merger on the gas and star formation evolution to be very robust against such changes.
When comparing the fully hydrodynamic models to the collissionless minor merger simulations of Starkenburg & Helmi (2015) we have found that the evolution of the stellar components of the dwarf galaxies is rather similar. Even though the gas absorbs and dissipates some of the energy injected via the merger, the morphological transformations that the stellar disks experience are still very important. This is in contrast to what has been reported in the literature for Milky Way-size systems where the effect is significantly reduced when gas is included (e.g., Hopkins et al. 2009; Moster et al. 2010). This is probably due to the gas being much colder in larger disk galaxies and therefore having a stronger stabilizing effect on the stars in the disk.
An important question is how often the process discussed in this paper would happen for dwarf galaxies in different environments, at different redshifts and with different masses. As the CDM halo mass function is almost scale-free (with small differences due to halo formation times van den Bosch et al. 2005; van den Bosch & Jiang 2014), dwarf galaxies will have a spectrum of perturbers very similar to that of an galaxy. Helmi et al. (2012) estimate that the number of minor mergers for low galaxy efficiency systems () where the satellite is at least as massive as the disk at pericenter, with the pericenter within 30% of the virial radius, is within a Hubble time. The simulations discussed in this paper were for systems with even smaller galaxy efficiencies experiencing 1:5 and 1:10 mergers with dark satellites, albeit on very radial orbits. This means that almost every dwarf galaxy should have experienced a minor merger with major effects during its lifetime. Predictions and their dependencies on environment, redshift and dwarf galaxy mass will be presented in a forthcoming paper (Starkenburg et al. in prep.).
Several definitions of a starburst exist in the literature (e.g., Knapen & James 2009; McQuinn et al. 2010; Bergvall et al. 2015). The birthrate parameter, =SFR/SFR is often used, and compares the current SFR or the peak of the burst to the average SFR over the past Gyr or even the lifetime of the system. For the more massive systems in our simulations the SFR in isolation is very similar to their initial stellar mass divided by a Hubble time, and the birthrate goes up to , or even , during the merger, depending on the configuration. The lower mass systems have typically more bursty star formation histories even in isolation. We may characterize between these small bursts, a few during bursts in isolation, but during the merger we find . Therefore the increase in star formation rates the simulated systems experience can be qualified as starburst events. Also when computing the gas consumption timescale, /SFR, there is agreement with the literature. For the star formation rates in isolation, the gas consumption timescales are long , while these drop significantly by factors of a few during the merger events.
7 Conclusions
We performed a suite of controlled, minor merger simulations between carefully set-up gaseous dwarf galaxies and their (dark) satellites. These interactions can give rise to a strong increase in the star formation rates in the dwarf galaxies. The increase is in the form of large sharp bursts during pericenter passages, as well as of extended boosts due to tidal torques funnelling gas toward the center. The gas and stellar disks show severely disturbed morphologies in most cases, especially for lower mass hosts experiencing a 1:5 merger. The gas disks can develop grand tidal tails and their remnants depict a much more concentrated final distribution in some cases. For the lowest mass systems explored (), the merger can completely destroy the stellar disk. These objects become spheroidal-like and have bursty star formation in their center. In contrast to simulations of Milky Way-like systems, the presence of gas in the disk of the dwarf galaxies does not diminish the effect of the merger on the stellar component. Our simulations that include gas show that the strong heating and evolution of the stellar disk is almost completely identical to the collisionless case.
We have explored the dependence of the mergers and their remnants on the host and satellite masses, dark matter halo concentrations, satellite orbits, gas fractions, and structure of the stellar and gas disks. To have a significant impact, a dark satellite must have at least 10% of the mass of the host. More generally, the strength of the merger’s effects decreases with lower satellite masses, but this depends on satellite halo concentration: a very dense low-mass dark satellite can survive longer than one of lower concentration, and therefore have stronger effects. Orbits in the plane of the disk cause stronger starbursts, while inclined orbits perturb the stellar components more effectively. Satellites on radial orbits cause stronger starbursts than those on more circular ones.
When the hosts have lower concentrations, the merger induces stronger morphological changes (as in Starkenburg & Helmi 2015) but in general also lower star formation rates. This is because SFR correlates with gas density, which depends in turn on the total mass distribution in the region probed by the gas disk. Also the gas fraction and distribution, as well as stellar disk masses and distributions, determine the amount of gas that has high enough densities for star formation, thereby directly affecting the amplitude of the starburst that a dwarf experiences during a merger.
Both our initial systems and their remnants compare well with the observational properties of a large selection of irregular dwarf galaxies and blue compact dwarfs. Even systems that are strongly perturbed as a result of a merger with a dark satellite fall within the scatter seen in the observations. This implies that such events might well be happening but may not be fully evident. We have yet to identify the “smoking gun” of the dark merger scenario. However, this also shows that the effects of interactions with dark satellites, which are naturally expected within a CDM cosmology, are likely to play a role in the diversity of the dwarf galaxy population.
Acknowledgements.
We are grateful to Claudio Dalla Vecchia, Joop Schaye, Carlos Vera-Ciro, Alvaro Villalobos and Volker Springel for providing code. AH acknowledges financial support from the European Research Council under ERC-StG grant GALACTICA-240271 and the Netherlands Research Organisation NWO for a Vici grant.References
- Allgood et al. (2006) Allgood, B., Flores, R. A., Primack, J. R., et al. 2006, MNRAS, 367, 1781
- Athanassoula et al. (2000) Athanassoula, E., Fady, E., Lambert, J. C., & Bosma, A. 2000, MNRAS, 314, 475
- Behroozi et al. (2013) Behroozi, P. S., Wechsler, R. H., & Conroy, C. 2013, ApJ, 770, 57
- Bekki & Freeman (2002) Bekki, K. & Freeman, K. C. 2002, ApJ, 574, L21
- Bergvall et al. (2015) Bergvall, N., Marquart, T., Way, M. J., et al. 2015, ArXiv e-prints
- Blanton et al. (2001) Blanton, M. R., Dalcanton, J., Eisenstein, D., et al. 2001, AJ, 121, 2358
- Bournaud et al. (2011) Bournaud, F., Chapon, D., Teyssier, R., et al. 2011, ApJ, 730, 4
- Breddels & Helmi (2013) Breddels, M. A. & Helmi, A. 2013, A&A, 558, A35
- Brosch et al. (2004) Brosch, N., Almoznino, E., & Heller, A. B. 2004, MNRAS, 349, 357
- Cannon et al. (2011) Cannon, J. M., Giovanelli, R., Haynes, M. P., et al. 2011, ApJ, 739, L22
- Chabrier (2003) Chabrier, G. 2003, PASP, 115, 763
- Crain et al. (2007) Crain, R. A., Eke, V. R., Frenk, C. S., et al. 2007, MNRAS, 377, 41
- Dalcanton et al. (2009) Dalcanton, J. J., Williams, B. F., Seth, A. C., et al. 2009, ApJS, 183, 67
- Dale et al. (2009) Dale, D. A., Cohen, S. A., Johnson, L. C., et al. 2009, ApJ, 703, 517
- Dalla Vecchia & Schaye (2008) Dalla Vecchia, C. & Schaye, J. 2008, MNRAS, 387, 1431
- Di Matteo et al. (2007) Di Matteo, P., Combes, F., Melchior, A.-L., & Semelin, B. 2007, A&A, 468, 61
- Ekta & Chengalur (2010) Ekta, B. & Chengalur, J. N. 2010, MNRAS, 403, 295
- Ellison et al. (2011) Ellison, S. L., Nair, P., Patton, D. R., et al. 2011, MNRAS, 416, 2182
- Elmegreen et al. (2012) Elmegreen, B. G., Zhang, H.-X., & Hunter, D. A. 2012, ApJ, 747, 105
- Garrison-Kimmel et al. (2014) Garrison-Kimmel, S., Boylan-Kolchin, M., Bullock, J. S., & Lee, K. 2014, MNRAS, 438, 2578
- Gil de Paz et al. (2003) Gil de Paz, A., Madore, B. F., & Pevunova, O. 2003, ApJS, 147, 29
- Giovanelli et al. (2005) Giovanelli, R., Haynes, M. P., Kent, B. R., et al. 2005, AJ, 130, 2598
- Gnedin (2000) Gnedin, N. Y. 2000, ApJ, 542, 535
- Gnedin et al. (2009) Gnedin, N. Y., Tassis, K., & Kravtsov, A. V. 2009, ApJ, 697, 55
- Governato et al. (2010) Governato, F., Brook, C., Mayer, L., et al. 2010, Nature, 463, 203
- Helmi et al. (2012) Helmi, A., Sales, L. V., Starkenburg, E., et al. 2012, ApJ, 758, L5
- Hernquist (1990) Hernquist, L. 1990, ApJ, 356, 359
- Hoeft et al. (2006) Hoeft, M., Yepes, G., Gottlöber, S., & Springel, V. 2006, MNRAS, 371, 401
- Holwerda et al. (2013) Holwerda, B. W., Pirzkal, N., de Blok, W. J. G., & Blyth, S.-L. 2013, MNRAS, 435, 1020
- Hopkins et al. (2009) Hopkins, P. F., Cox, T. J., Younger, J. D., & Hernquist, L. 2009, ApJ, 691, 1168
- Huang et al. (2012) Huang, S., Haynes, M. P., Giovanelli, R., et al. 2012, AJ, 143, 133
- Hunter & Elmegreen (2004) Hunter, D. A. & Elmegreen, B. G. 2004, AJ, 128, 2170
- Hunter & Elmegreen (2006) Hunter, D. A. & Elmegreen, B. G. 2006, ApJS, 162, 49
- Karachentsev et al. (2004) Karachentsev, I. D., Karachentseva, V. E., Huchtmeier, W. K., & Makarov, D. I. 2004, AJ, 127, 2031
- Kaufmann et al. (2007) Kaufmann, T., Wheeler, C., & Bullock, J. S. 2007, MNRAS, 382, 1187
- Kaviraj (2014a) Kaviraj, S. 2014a, MNRAS, 440, 2944
- Kaviraj (2014b) Kaviraj, S. 2014b, MNRAS, 437, L41
- Kennicutt (1998) Kennicutt, Jr., R. C. 1998, ApJ, 498, 541
- Kennicutt et al. (2008) Kennicutt, Jr., R. C., Lee, J. C., Funes, José G., S. J., Sakai, S., & Akiyama, S. 2008, ApJS, 178, 247
- Klypin et al. (1999) Klypin, A., Kravtsov, A. V., Valenzuela, O., & Prada, F. 1999, ApJ, 522, 82
- Knapen & Cisternas (2015) Knapen, J. H. & Cisternas, M. 2015, ApJ, 807, L16
- Knapen & James (2009) Knapen, J. H. & James, P. A. 2009, ApJ, 698, 1437
- Kormendy & Freeman (2014) Kormendy, J. & Freeman, K. C. 2014, ArXiv e-prints 1407.7876
- Lagos et al. (2013) Lagos, C. d. P., Lacey, C. G., & Baugh, C. M. 2013, MNRAS, 436, 1787
- Lee et al. (2011) Lee, J. C., Gil de Paz, A., Kennicutt, Jr., R. C., et al. 2011, ApJS, 192, 6
- Lee et al. (2009) Lee, J. C., Kennicutt, Jr., R. C., Funes, S. J. J. G., Sakai, S., & Akiyama, S. 2009, ApJ, 692, 1305
- Lelli et al. (2014a) Lelli, F., Fraternali, F., & Verheijen, M. 2014a, A&A, 563, A27
- Lelli et al. (2014b) Lelli, F., Verheijen, M., & Fraternali, F. 2014b, MNRAS, 445, 1694
- Li et al. (2010) Li, Y.-S., De Lucia, G., & Helmi, A. 2010, MNRAS, 401, 2036
- López-Sánchez (2010) López-Sánchez, Á. R. 2010, A&A, 521, A63
- Macciò et al. (2008) Macciò, A. V., Dutton, A. A., & van den Bosch, F. C. 2008, MNRAS, 391, 1940
- Martin (2005) Martin, C. L. 2005, ApJ, 621, 227
- McQuinn et al. (2015) McQuinn, K. B. W., Cannon, J. M., Dolphin, A. E., et al. 2015, ApJ, 802, 66
- McQuinn et al. (2010) McQuinn, K. B. W., Skillman, E. D., Cannon, J. M., et al. 2010, ApJ, 721, 297
- Meurer et al. (1998) Meurer, G. R., Staveley-Smith, L., & Killeen, N. E. B. 1998, MNRAS, 300, 705
- Mihos & Hernquist (1994a) Mihos, J. C. & Hernquist, L. 1994a, ApJ, 425, L13
- Mihos & Hernquist (1994b) Mihos, J. C. & Hernquist, L. 1994b, ApJ, 431, L9
- Mo et al. (1998) Mo, H. J., Mao, S., & White, S. D. M. 1998, MNRAS, 295, 319
- Moore et al. (1999) Moore, B., Ghigna, S., Governato, F., et al. 1999, ApJ, 524, L19
- Moster et al. (2010) Moster, B. P., Macciò, A. V., Somerville, R. S., Johansson, P. H., & Naab, T. 2010, MNRAS, 403, 1009
- Moster et al. (2013) Moster, B. P., Naab, T., & White, S. D. M. 2013, MNRAS, 428, 3121
- Muñoz-Cuartas et al. (2011) Muñoz-Cuartas, J. C., Macciò, A. V., Gottlöber, S., & Dutton, A. A. 2011, MNRAS, 411, 584
- Navarro et al. (1996) Navarro, J. F., Frenk, C. S., & White, S. D. M. 1996, ApJ, 462, 563
- Okamoto et al. (2010) Okamoto, T., Frenk, C. S., Jenkins, A., & Theuns, T. 2010, MNRAS, 406, 208
- Okamoto et al. (2008) Okamoto, T., Gao, L., & Theuns, T. 2008, MNRAS, 390, 920
- Ott et al. (2012) Ott, J., Stilp, A. M., Warren, S. R., et al. 2012, AJ, 144, 123
- Paudel et al. (2015) Paudel, S., Duc, P. A., & Ree, C. H. 2015, AJ, 149, 114
- Robertson & Kravtsov (2008) Robertson, B. E. & Kravtsov, A. V. 2008, ApJ, 680, 1083
- Sánchez-Janssen et al. (2010) Sánchez-Janssen, R., Méndez-Abreu, J., & Aguerri, J. A. L. 2010, MNRAS, 406, L65
- Sawala et al. (2013) Sawala, T., Frenk, C. S., Crain, R. A., et al. 2013, MNRAS, 431, 1366
- Sawala et al. (2015) Sawala, T., Frenk, C. S., Fattahi, A., et al. 2015, MNRAS, 448, 2941
- Schaye (2004) Schaye, J. 2004, ApJ, 609, 667
- Schaye & Dalla Vecchia (2008) Schaye, J. & Dalla Vecchia, C. 2008, MNRAS, 383, 1210
- Schaye et al. (2010) Schaye, J., Dalla Vecchia, C., Booth, C. M., et al. 2010, MNRAS, 402, 1536
- Schwartz & Martin (2004) Schwartz, C. M. & Martin, C. L. 2004, ApJ, 610, 201
- Springel (2005) Springel, V. 2005, MNRAS, 364, 1105
- Springel et al. (2005) Springel, V., Di Matteo, T., & Hernquist, L. 2005, MNRAS, 361, 776
- Springel & White (1999) Springel, V. & White, S. D. M. 1999, MNRAS, 307, 162
- Springel et al. (2001) Springel, V., Yoshida, N., & White, S. D. M. 2001, New A, 6, 79
- Starkenburg & Helmi (2015) Starkenburg, T. K. & Helmi, A. 2015, A&A, 575, A59
- Taylor et al. (1995) Taylor, C. L., Brinks, E., Grashuis, R. M., & Skillman, E. D. 1995, ApJS, 99, 427
- Taylor & Webster (2005) Taylor, E. N. & Webster, R. L. 2005, ApJ, 634, 1067
- Teyssier et al. (2010) Teyssier, R., Chapon, D., & Bournaud, F. 2010, ApJ, 720, L149
- van den Bosch & Jiang (2014) van den Bosch, F. C. & Jiang, F. 2014, ArXiv e-prints 1403.6835
- van den Bosch et al. (2005) van den Bosch, F. C., Tormen, G., & Giocoli, C. 2005, MNRAS, 359, 1029
- van Zee et al. (2001) van Zee, L., Salzer, J. J., & Skillman, E. D. 2001, AJ, 122, 121
- Verbeke et al. (2014) Verbeke, R., De Rijcke, S., Koleva, M., et al. 2014, MNRAS, 442, 1830
- Villalobos & Helmi (2008) Villalobos, Á. & Helmi, A. 2008, MNRAS, 391, 1806
- Walter et al. (2008) Walter, F., Brinks, E., de Blok, W. J. G., et al. 2008, AJ, 136, 2563
- Warren et al. (2007) Warren, B. E., Jerjen, H., & Koribalski, B. S. 2007, AJ, 134, 1849
- Warren et al. (2012) Warren, S. R., Skillman, E. D., Stilp, A. M., et al. 2012, ApJ, 757, 84
- Weisz et al. (2012) Weisz, D. R., Johnson, B. D., Johnson, L. C., et al. 2012, ApJ, 744, 44
- Willett et al. (2015) Willett, K. W., Schawinski, K., Simmons, B. D., et al. 2015, MNRAS, 449, 820
- Yoachim & Dalcanton (2006) Yoachim, P. & Dalcanton, J. J. 2006, AJ, 131, 226
Appendix A Additional figures