0em 1pt \setkomafontpagehead \setkomafontpagenumber
Envelope inflation in Wolf-Rayet stars and
extended supernova shock breakout signals
D. Sanyal, T. J. Moriya & N. Langer
Argelander-Institut für Astronomie, Universität Bonn, Germany
Abstract
Massive, luminous stars reaching the Eddington limit in their interiors develop very dilute, extended envelopes. This effect is called envelope inflation. If the progenitors of Type Ib/c supernovae, which are believed to be Wolf-Rayet (WR) stars, have inflated envelopes then the shock breakout signals diffuse in them and can extend their rise times significantly. We show that our inflated, hydrogen-free, WR stellar models with a radius of can have shock breakout signals longer than . The puzzlingly long shock breakout signal observed in the Type Ib SN 2008D can be explained by an inflated progenitor envelope, and more such events might argue in favour of existence of inflated envelopes in general.
1 Stellar envelope inflation
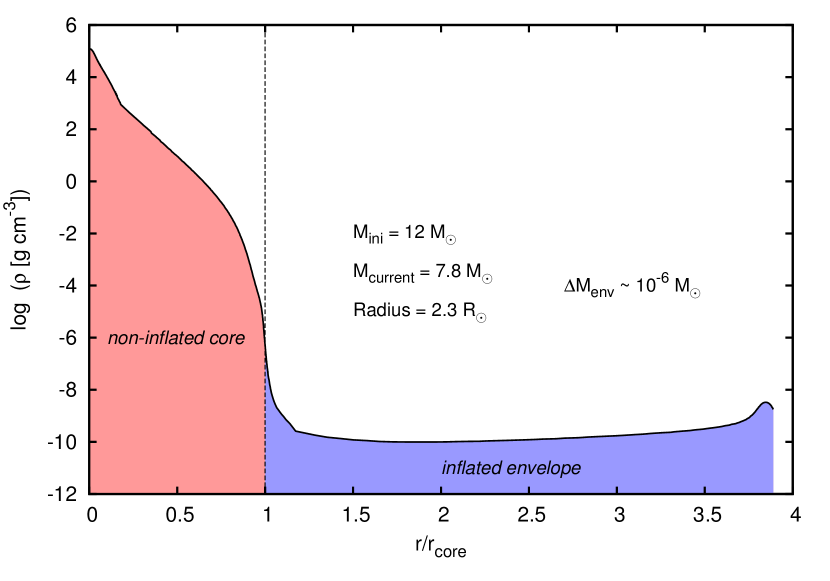
Inflation refers to the extremely dilute, loosely-bound envelopes that massive, luminous stars develop in the course of their evolution (Ishii et al., 1999; Petrovic et al., 2006; Sanyal et al., 2015, Langer et al., this volume). A typical inflated envelope is shown in Fig. 1, which corresponds to an evolved hydrogen-free 7.8 model burning carbon in the core. Such ubiquitous hydrostatic structures result from stellar layers reaching the Eddington limit in the interior of the star, facilitated by the peak in opacity at K, the so-called iron opacity bump. For more details on the appropriate definition of the Eddington limit, we refer to Sanyal et al. (2015) and Langer et al. (this volume).
Stellar layers approaching the Eddington luminosity become convectively unstable (Langer, 1997) but convection, of course, does not contribute to the radiative acceleration. However, the fraction of the total flux transported by convection in these WR stars, according to standard MLT, is negligibly small. Hence, whether or not the layers will hit the Eddington limit and inflate the envelope, does not depends critically on the theory of convective energy transport used to model the stars.
2 Stellar models of WR stars
We modelled WR stars as non-rotating, hydrogen-free helium stars and evolved them through core-helium buring to the onset of core-carbon burning, using the 1-D stellar evolution code BEC (see Heger et al., 2000; Brott et al., 2011; Moriya et al., 2015, for details). We computed two sets of models, with initial masses 10 and 12 , and a metal composition that of the Sun (Brott et al., 2011). In particular, we used the OPAL opacity tables (Iglesias & Rogers, 1996) for our computations and used the standard Mixing-Length-Theory (MLT) to model convective zones, with . The mass-loss rate prescription from Nugis & Lamers (2000) was applied. The resulting structure (e.g. Fig. 1) will resemble a SN Type Ib progenitor because no significant changes in the stellar structure is expected in the remaining lifetime until the explosion.
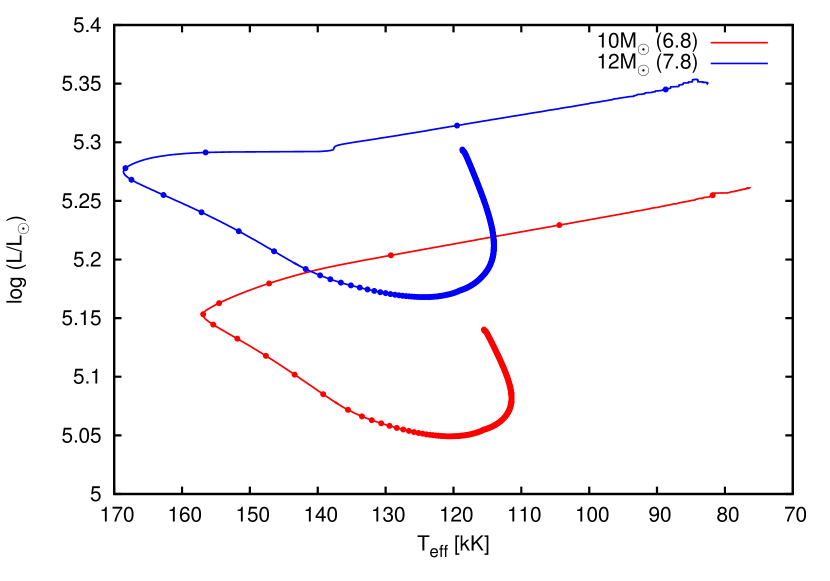
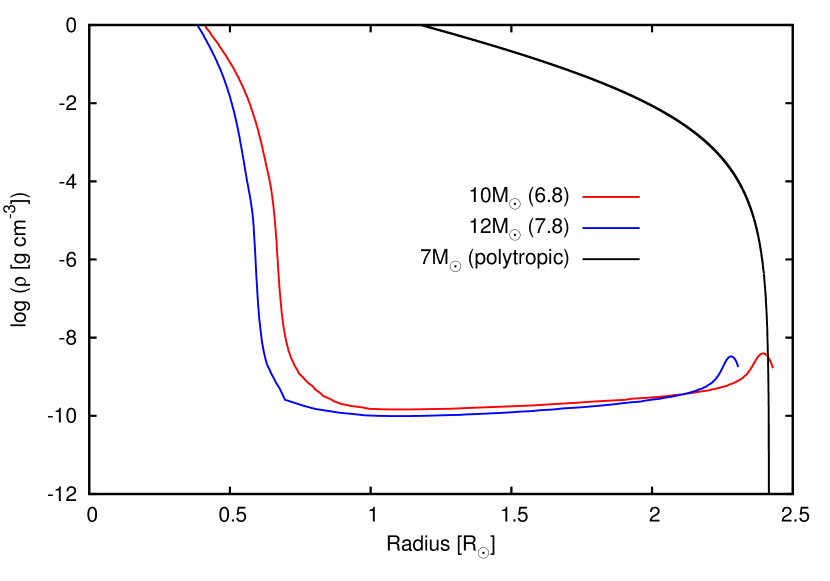
The evolutionary tracks of the aforementioned models, in the H-R diagram, is shown in Fig. 2. Both the helium zero age main sequence models are marginally inflated. As a consequence of the applied mass loss, they decrease in luminosity during the core helium-burning phase. After helium is exhausted in the core, the stars begin to contract and become hotter and brighter. The models are hardly inflated during this phase because the Fe-group opacity bump is only partially contained inside the stars. These are probably related to the WO stars (cf. Tramper et al., this volume). When the helium-shell ignites, the evolutionary tracks eventually move toward cooler temperatures because of the mirror principle. As the models become cooler, they become significantly inflated and exhibit a pronounced core-halo structure, as shown in Fig. 3 (cf. Moriya et al., 2015).
3 Shock breakout in inflated stellar envelopes
The shock breakout occurs when the dynamical timescale of the shock propagation in the unshocked envelope, i.e. becomes comparable to the diffusion timescale in the envelope, i.e. , where is the shock velocity and is the optical depth in the remaining unshocked envelope (Weaver, 1976). Therefore, the shock breakout condition can be expressed as: .
For a model in which the shock breakout condition is fulfilled very close to the stellar surface, is very small, such that , where is the light-crossing time. Assuming a shock velocity of , in the case of the polytropic model shown in Fig. 3, the light-crossing time is 5.6 s whereas the diffusion time is only 0.5 s, meaning that the shock breakout duration is determined by .
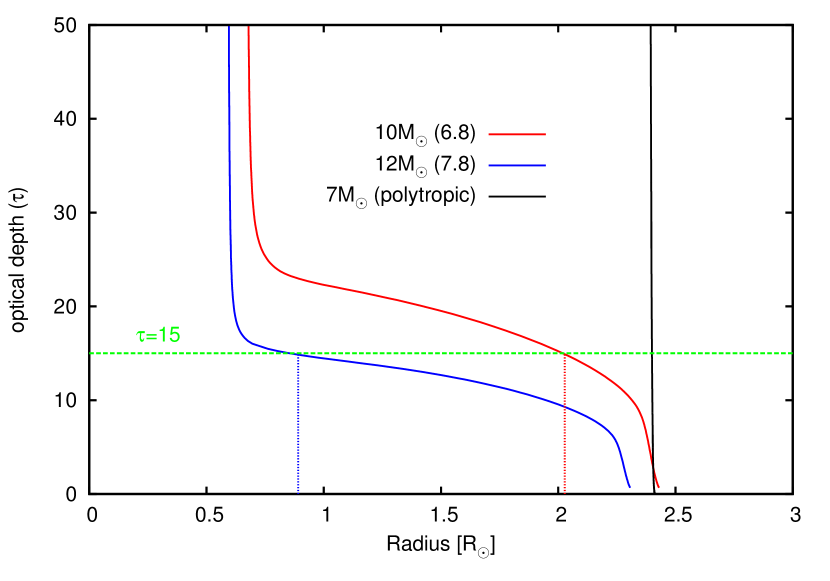
On the other hand, in an inflated stellar model, the shock breakout happens relatively deep inside the envelope, making quite large, such that . In Fig. 4, we plot the optical depth in the interior of our stellar models and show that can be as large as . In such a situation, the rise time of the shock breakout signals will be determined by the diffusion time. The subsequent light curve is expected to decline exponentially with an e-folding timescale of the diffusion time due to the photon diffusion in the shocked envelope (Moriya et al., 2015). Table 3 summarises the different timescales involved in inflated and un-inflated models.
SN 2008D: The X-ray light curve of the Type Ib SN 2008D was serendipitously observed by Soderberg et al. (2008) with the SWIFT satellite, and is the only direct detection of a SN shock breakout so far. The total shock breakout duration was seconds with a rise time of seconds. If we assume the shock brekout duration was dominated by , as is done in the literature, then it implies a WR progenitor radius of , which is much larger than predicted by stellar evolutionary models. On the other hand, our inflated model with a radius of can naturally explain the long rise time of SN 2008D. The estimated SN ejecta mass is (Soderberg et al., 2008; Mazzali et al., 2008; Bersten et al., 2013) which is consistent with the final masses of our models (after subtracting the remnant mass of the neutron star). The mass-loss rates of our models () are also consistent with that estimated from radio observations (, Soderberg et al., 2008).
The shock velocity at shock breakout has been suggested to be for WR stars (e.g., Nakar & Sari, 2010), but these studies assume a steeply declining density profile as in the case of the polytropic model. Hydrodynamic modelling of shock propagation in inflated envelopes is needed to estimate the shock velocity at breakout.
There have been other models proposed for explaining the long shock breakout signal of SN 2008D, like the thick wind model by Svirski & Nakar (2014) which assumes a high mass-loss rate of a few days prior to the explosion, and the supernova ejecta expanding through the optically-thick wind.
A comparison of the properties and the relevant timescales of our computed models. The shock breakout rise time of SN 2008D was seconds. Mass () (s) (s) () 6.8 5.67 14 2.43 7.8 5.38 50 2.31 7.0 (Polytropic) 5.60 0.5 2.40
4 Conclusions
We have shown that if WR type supernova progenitors have inflated envelopes, then the rise times of supernova shock breakout signals can be extended because the shock breakout can then occur within the low-density envelopes. The long diffusion time of the inflated envelopes makes the shock breakout rise times long. Even if a SN progenitor has a radius on the order of the solar radius whose light-crossing time is a few seconds, the rise time of the shock breakout signals can be s because of the inflated envelope. Our inflated model can simultaneously explain the mysterious long shock breakout rise time, the ejecta mass, the mass-loss rate estimate right before explosion, and the shock velocity in SN 2008D.
The inflated envelope is a generic feature of luminous, mass stars and can have an array of observational consequences. It leads to cooler effective temperatures, higher spin-down rates in rotating stars, and less massive supernova progenitors. It has been argued in the literature (Gräfener et al., 2012) that inflated WR envelopes can address the WR radius problem. A recent study of galactic OB stars by Castro et al. (2014) indicates that inflated envelopes do exist in nature. Furthermore, core-hydrogen burning stars evolving to temperatures below K can be expected to have massive inflated envelopes and might be related to LBV giant eruptions (Sanyal et al., 2015).
References
- Bersten et al. (2013) Bersten, M. C., Tanaka, M., Tominaga, N., Benvenuto, O. G., & Nomoto, K. 2013, ApJ, 767, 143
- Brott et al. (2011) Brott, I., de Mink, S. E., Cantiello, M., et al. 2011, A&A, 530, A115
- Castro et al. (2014) Castro, N., Fossati, L., Langer, N., et al. 2014, A&A, 570, L13
- Gräfener et al. (2012) Gräfener, G., Owocki, S. P., & Vink, J. S. 2012, A&A, 538, A40
- Heger et al. (2000) Heger, A., Langer, N., & Woosley, S. E. 2000, ApJ, 528, 368
- Iglesias & Rogers (1996) Iglesias, C. A. & Rogers, F. J. 1996, ApJ, 464, 943
- Ishii et al. (1999) Ishii, M., Ueno, M., & Kato, M. 1999, PASJ, 51, 417
- Langer (1997) Langer, N. 1997, in Astronomical Society of the Pacific Conference Series, Vol. 120, Luminous Blue Variables: Massive Stars in Transition, ed. A. Nota & H. Lamers, 83
- Mazzali et al. (2008) Mazzali, P. A., Valenti, S., Della Valle, M., et al. 2008, Science, 321, 1185
- Moriya et al. (2015) Moriya, T. J., Sanyal, D., & Langer, N. 2015, A&A, 575, L10
- Nakar & Sari (2010) Nakar, E. & Sari, R. 2010, ApJ, 725, 904
- Nugis & Lamers (2000) Nugis, T. & Lamers, H. J. G. L. M. 2000, A&A, 360, 227
- Petrovic et al. (2006) Petrovic, J., Pols, O., & Langer, N. 2006, A&A, 450, 219
- Sanyal et al. (2015) Sanyal, D., Grassitelli, L., Langer, N., & Bestenlehner, J. M. 2015, Accepted in A&A
- Soderberg et al. (2008) Soderberg, A. M., Berger, E., Page, K. L., et al. 2008, Nature, 453, 469
- Svirski & Nakar (2014) Svirski, G. & Nakar, E. 2014, ApJ, 788, L14
- Weaver (1976) Weaver, T. A. 1976, ApJS, 32, 233