Simulating Cherenkov Telescope Array observation of RX J1713.7–3946
Abstract:
We perform simulations of Cherenkov Telescope Array (CTA) observations of a young supernova remnant RX J1713.7–3946. This target is not only one of the brightest sources ever discovered in very high-energy (VHE) gamma rays but also well observed in other wavebands. In X-rays, the emission is dominated by synchrotron radiation, which links directly to the existence of high-energy electrons. Radio observations of CO and HI gas have revealed a highly inhomogeneous medium surrounding the SNR, such as clumpy molecular clouds. Therefore gamma rays from hadronic interactions are naturally expected. However, the spectrum in GeV energy range measured by Fermi/LAT indicates more typical of leptonic emission from accelerated electrons. Despite lots of multi-wavelength information, the competing interpretations have led to much uncertainty in the quest of unraveling the true origin of the gamma-ray emission from RX J1713.7–3946. CTA will achieve highest performance ever in sensitivity, angular resolution, and energy resolution. We estimate CTA capability to examine the emission mechanisms of the gamma rays through simulated spatial distribution, spectra, and their time variation.
1 Introduction
More than 100 years have passed since the discovery of cosmic rays but its origin has been long in question despite many observational and theoretical researches. The observed spectrum of cosmic rays is a power-law shape and has a break around eV which is so-called “knee”. Cosmic rays below the knee energies are thought to be accelerated somewhere in our Galaxy. One of the most probable candidates are supernova remnants (SNRs), where the diffusive shock acceleration may work at the shock front of SNR blast waves. Evidence for electron acceleration has been identified by the detection of synchrotron emission with spatially thin filamentary structures at shells of young SNRs (e.g., [1]). On the other hand, gamma rays with hadronic origin was detected by Large Area Telescope (LAT) onboard Fermi from middle-aged SNRs IC443 and W44, which are known to be interacting with molecular clouds (MCs)[2]. The observed gamma-ray spectra are interpreted as neutral pion decay, which is characterized by a cutoff below 300 MeV, due to the interaction between accelerated cosmic-ray hadrons and MCs. However, it is also observed that that the gamma-ray spectra are suppressed above 100 GeV. We hence expect that young SNRs could be more plausible as cosmic-ray accelerators to PeV energies, i.e. PeVatron.
The Cherenkov Telescope Array (CTA) is a next-generation of Imaging Air Cherenkov Telescopes (IACT) observatory which consists of array of the large, middle, and small-sized telescopes expanding over km2 area[3, 4]. With higher performance in comparison to the current generation IACTs, such as better spatial resolution and sensitivity, a search for cosmic-ray PeVatron is one of the major scientific objectives of the CTA. A young SNR RX J1713.73946 is one of the brightest Very High-Energy (VHE) gamma ray sources and spatially extended emission was observed [5, 6, 7, 8]. The VHE gamma-ray spectrum of RX J1713.7–3946 is the most precisely measured over a wide energy band from 0.3 to 100 TeV. Besides, plenty of multi-wavelength observations have been performed. Fermi measured the gamma-ray spectrum of RX J1713.7–3946 in the 3–300 GeV energy range, where the observed photon index of is favorable for inverse-Compton emission from accelerated electrons with a spectral index of 2.0[9]. X-ray emission is dominated by synchrotron radiation with a good spatial correlation between VHE morphology, although the angular resolution is not good enough to be conclusive. On the other hand, radio observations of CO and HI gas have revealed a clumpy molecular clouds (MCs) surrounding the SNR, and reported evidence for interaction between the MCs and the SNR shock (e.g. [10, 11, 12]. The hadronic gamma-ray emission is naturally expected to reproduce the obseved spetrum (e.g. [13]) . However, our idea here is that, if the hadronic gamma rays do exist, such component might be hidden by the dominant leptonic gamma-ray emission. It is of a great interest whether the improved sensitivity of the CTA could detect the possible but dim hadronic gamma rays. Hence this object is a very good target for deep observations, and also for constraining theoretical models of cosmic-ray acceleration.
2 Aims and methods of simulations
The major purpose of our simulation studies is to show an example of analysis strategy when we will obtain real data, and to evaluate the capabilities of CTA on finding a clue for the hadronic gamma rays.
First we perform morphological analyses in order to find out the dominant component of the VHE gamma-ray emission from RX J1713.7–3946. As for the hadronic gamma rays, the morphology should be related to spatial distribution of the accelerated protons and that of the interacting matter density which is indicated by the CO and HI morphology obtained by the radio observations. Since we currently do not know the CR distribution, we here roughly assume that CR would be filled homogeneously inside the SNR. On the other hand, the morphology of the leptonic gamma-ray emission may be traced by that of synchrotron X-ray. We should note that the X-ray and VHE morphologies are not always completely same. The brightness of the synchrotron emission reflects not only for spatial electron distribution but also local magnetic fields. And the inverse-Compton process is also coupled to energy densities of target photons which includes infrared and/or optical photon field in addition to the cosmic microwave background. However, the overall structure could be approximated by the X-ray morphology. We hence apply the radio and X-ray images as templates for the hadronic and leptonic gamma-ray morphology, respectively. We perform maximum likelihood test to quantitatively determine which component dominates the VHE emission from the SNR. The templates also contain spectral information. Here we simply assume the same spectral shape is assumed over the SNR image. The spectrum of the leptonic component is modeled as
| (1) |
where is a normalization factor, is a photon index, and is a cutoff energy. Input values for and are 2.04 and 17.9 TeV, respectively, as reported by H.E.S.S. observations[8]. For the hadronic emission, the spectrum is described as follows,
| (2) |
where is a normalization factor, is a photon index, and is a cutoff energy. We adopt and TeV as fiducial parameters. Therefore and , or their ratio , are the parameter to be investigated, requiring that the sum of the integral fluxes between 1 and 10 TeV are equal to that measured by H.E.S.S.. If the hadronic gamma ray is greater, we could conclude that dominant part of the hadronic component were not accelerated to the knee energies in RX J1713.7–3946. Searching for a spectral component that extends to PeV energies, we also look for a dimmer hadronic component by spectral analysis. The maximum likelihood fit will be performed in order to unfold spectra for each component and evaluate statistical significance of the hadronic gamma-ray detection. Here the spatial templates are also considered to calculate the likelihood.
We also evaluate the capability of detecting the time variation of the spectral cutoff energy, , with longer time scale. The maximum energy of the CR spectrum is determined by a balance among acceleration, cooling and escape. Hence variation, increase or decrease, depends on the SNR age and also on acceleration theories. In the case of RX J1713.7–3946, 10% variation in 10–20 years may be expected, where could vary faster in the leptonic scenario[14]. Since the CTA will be operational for a few tens of years, such a long-term study in VHE energies will become possible. This may be a unique approach for identifying the VHE emission mechanism.
The simulation software package that we use in this study is ctools version 00-07-01[15]. We use a preliminary instrumental response function which corresponds to the CTA southern array located at the candidate site Aar (southern Namibia). When we perform the simulations, the Galactic diffuse emission and isotropic background due to gamma-like charged cosmic rays are taken into account for background photons in the field of view.
3 Results
3.1 -ray image
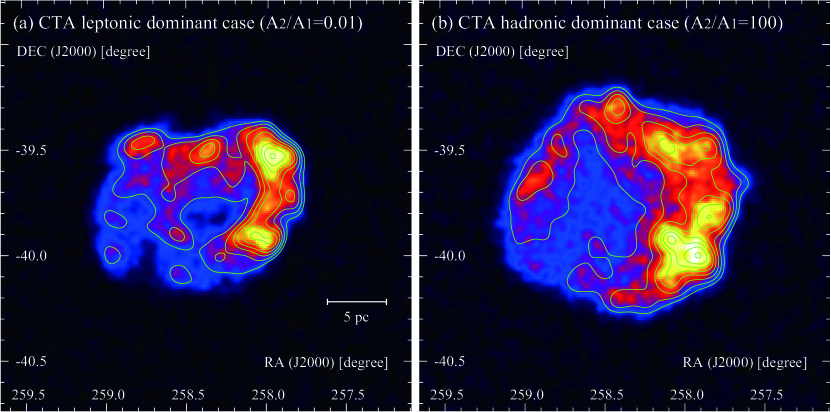
In order to clarify the imaging capability of CTA, we first intend to simulate different gamma ray images in the energy range of 1–100 TeV by tuning , the ratio between the hadronic and leptonic gamma rays. Figures 1a and 1b show the simulated gamma-ray images in leptonic dominant case ( = 0.01) and hadronic dominant case ( = 100), respectively. Each gamma-ray image is similar to each overlaid contour, which corresponds to the non-thermal X rays and the total ISM protons including both molecular and atomic hydrogen, respectively. On the other hand, the spatial distributions of gamma rays are apparently different from each other, particularly the north and the southwest. In this extreme case, we can therefore determine the major component of the VHE emission by the morphological study with CTA. Incidentally, we found that = 1–10 showed the best spatial correspondence with the H.E.S.S. excess counts map [8] with a correlation coefficient of 0.7–0.8. We continue to study the systematic error estimation and quantitative evaluation for the morphological difference.
3.2 Spectrum
Assuming that the leptonic component is dominant, we subsequently proceed to search for a “hidden” hard component with a hadronic origin. Using reconstructed energy band of 0.5 – 100 TeV with 50-hour observation, likelihood analyses show the significance to observe a dimmer hard component even for a small . Note that the result may be rather optimistic since the fitting templates are the same as the input for the simulation.
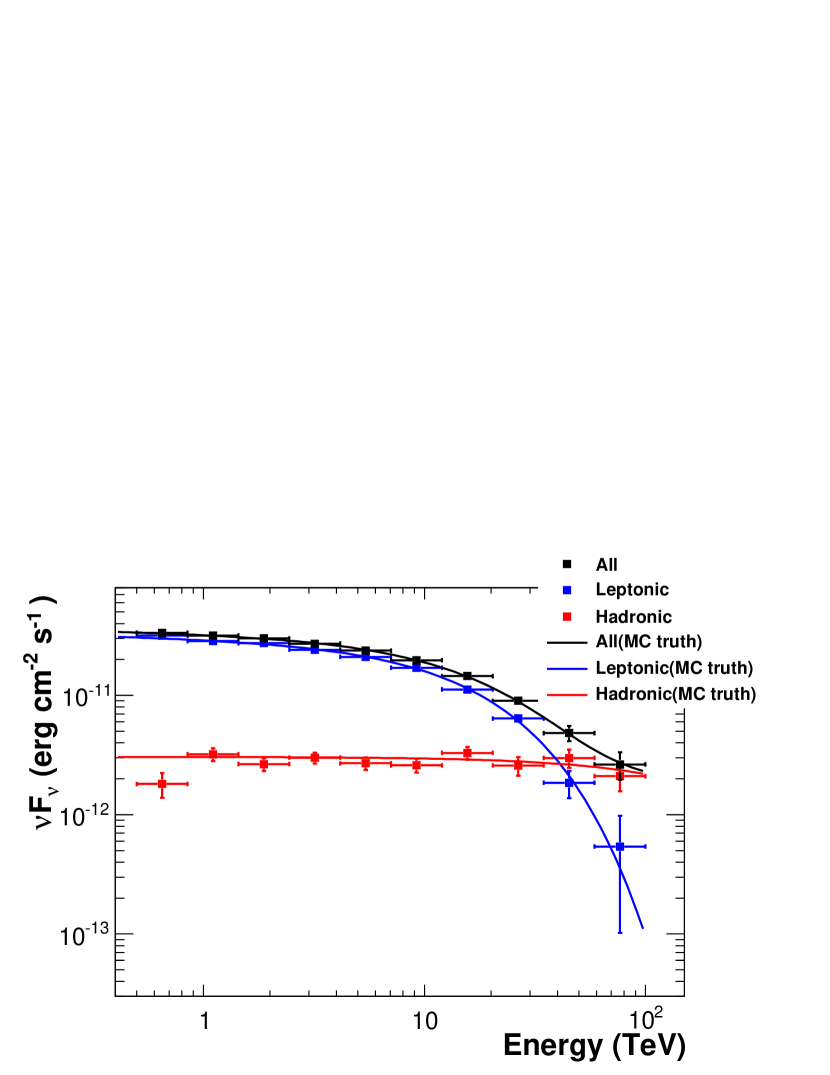
We then proceed to perform maximum likelihood fittings for the simulation data (with a ratio , for the safety) in 12 logarithmically spaced energy bands. Figure 2 shows the resulting spectrum from our ‘bin-by-bin’ analysis of the same 50 hr of simulation data. It is clear that our likelihood fits reproduce the simulated spectrum for each spatial template (i.e. hadronic or leptonic morphology), which demonstrates the capability of detecting the hidden hadronic component in the best case scenario.
3.3 Time variation of cutoff energy
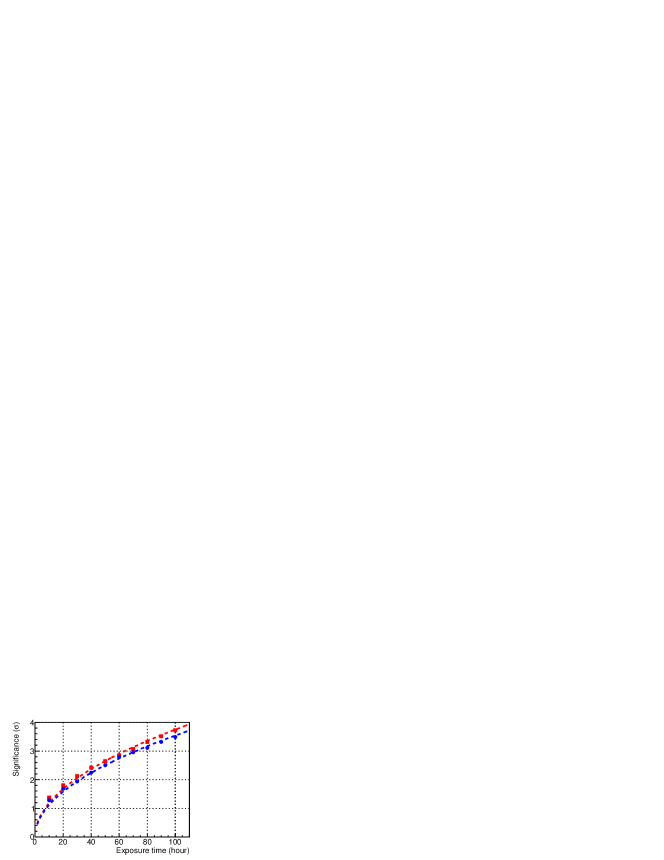
Detecting the time variation of the cutoff energy of the gamma ray spectrum can provide a clue to the emission scenario and acceleration theories. The simulations are performed for three sets of intrinsic cutoff energies at 17.9 (nominal), 19.7 (% case) and 16.1 TeV (% case) each. As a start, we consider a variation of to show how sensitive CTA will be to such fractional changes in the spectral cutoff. Here we consider the pure leptonic scenario as an example, and used 0.2–100 TeV photons.
We define a significance, , for the observed variation as where is the nominal value and is the best fit for the cases with a variation. and are the corresponding errors. We repeat all of our simulations for 100 times and take the average of the calculated for each run, and show the result on Figure 3 . Our result indicates that a decrease of is slightly easier to identify than an increase. As a result, a lower cutoff energy can actually be easier to measure and precisely for a given exposure. If we observe hrs in the two epochs, we are able to achieve a detection for the case, whereas hrs are necessary for the case.
4 Summary
In this paper, we have briefly introduced our feasibility studies for CTA observations of RX J1713.7–3946, mostly with 50 hrs observations. We showed that a 50-hr observation may be enough to identify the dominant gamma ray emission component by the morphology obtained with CTA. And in the case that the leptonic emission would be dominant, we should be able to quantify both the leptonic and hadronic components through spectral analysis if they are mixed with a ratio of or less. Interestingly, we also found that CTA will be able to reveal variations of the spectral cutoff energy over 10–20 years, for the very first time. A variation of could be detected provided that an exposure time longer than 70 hr can be secured for the two epoch.
However we know our present study is based on a fairly simplified input model and may contain systematic errors of which estimation is not trivial. And also this study can be extended to use more theoretically justified models. More studies are left for future works.
Acknowledgments.
We gratefully acknowledge support from the agencies and organizations listed under Funding Agencies at this website: http://www.cta-observatory.org/. We thank S. Katsuda for providing the original XMM-Newton image.References
- [1] K. Koyama, et al., Evidence for shock acceleration of high-energy electrons in the supernova remnant SN 1006, Nature, 378, (1995) 255
- [2] M. Ackermann, et al., Detection of the Characteristic Pion-Decay Signature in Supernova Remnants, Science, 339, (2013) 807
- [3] M. Actis, et al., Design concepts for the Cherenkov Telescope Array CTA: an advanced facility for ground-based high-energy gamma-ray astronomy, Experimental Astronomy, 32, (2011) 193
- [4] B. S. Acharya, et al. Introducing the CTA concept, Astropart. Phys., 43, (2013) 3
- [5] Enomoto, R. et al., The acceleration of cosmic-ray protons in the supernova remnant RX J1713.7–3946, Nature, 416, (2002) 823
- [6] F. A. Aharonian, et al., High-energy particle acceleration in the shell of a supernova remnant, Nature, 432, (2004) 75
- [7] F. A. Aharonian, et al., A detailed spectral and morphological study of the gamma-ray supernova remnant RX J1713.7–3946 with HESS, A&A, 449, (2006) 223
- [8] F. A. Aharonian, et al., Primary particle acceleration above 100 TeV in the shell-type supernova remnant RX J1713.7–3946 with deep HESS observations, A&A, 464, (2007) 235
- [9] A. A. Abdo, et al., Observations of the young supernova remnant RX J1713.7–3946 with the Fermi Large Area Telescope, ApJ, 734, (2011) 28
- [10] Y. Fukui, et al., Discovery of Interacting Molecular Gas toward the TeV Gamma-Ray Peak of the SNR G 347.3–0.5, PASJ, 55, (2003) L61
- [11] Y. Fukui, et al., A Detailed Study of the Molecular and Atomic Gas toward the -Ray Supernova Remnant RX J1713.7–3946: Spatial TeV -Ray and Interstellar Medium Gas Correspondence, ApJ, 746, (2012) 82
- [12] H. Sano, et al., A Detailed Study of Non-thermal X-Ray Properties and Interstellar Gas toward the -Ray Supernova Remnant RX J1713.7–3946, ApJ, 799, (2015) 175
- [13] S. Gabici, et al., Hadronic gamma–rays from RX J1713.7-3946?, MNRAS, 445, (2014) 70
- [14] Y. Ohira, et al., Escape-limited model of cosmic-ray accleration revisited, A&A, 513, (2010) A17
- [15] J. Knödlseder, et al., Towards a common analysis framework for gamma-ray astronomy in proceedings of 33th ICRC, (2013) [arXiv:1307.2232]
- [16] F. Acero, et al., A joint spectro-imaging analysis of the XMM-Newton and HESS observations of the supernova remnant RX J1713.7-3946, A&A, 505, (2009) 157