ALMA Observations of the Submillimeter Dense Molecular Gas Tracers
in the Luminous Type-1 Active Nucleus of NGC 7469
Abstract
We present ALMA Cycle 1 observations of the central kpc region of the luminous type-1 Seyfert galaxy NGC 7469 with unprecedented high resolution (0.5′′ 0.4′′ = 165 pc 132 pc) at submillimeter wavelengths. Utilizing the wide-bandwidth of ALMA, we simultaneously obtained HCN(4-3), HCO+(4-3), CS(7-6), and partially CO(3-2) line maps, as well as the 860 m continuum. The region consists of the central 1′′ component and the surrounding starburst ring with a radius of 1.5′′-2.5′′. Several structures connect these components. Except for CO(3-2), these dense gas tracers are significantly concentrated towards the central 1′′, suggesting their suitability to probe the nuclear regions of galaxies. Their spatial distribution resembles well those of centimeter and mid-infrared continuum emissions, but it is anti-correlated with the optical one, indicating the existence of dust obscured star formation. The integrated intensity ratios of HCN(4-3)/HCO+(4-3) and HCN(4-3)/CS(7-6) are higher at the AGN position than at the starburst ring, which is consistent to our previous findings (submm-HCN enhancement). However, the HCN(4-3)/HCO+(4-3) ratio at the AGN position of NGC 7469 (1.110.06) is almost half of the corresponding value of the low-luminosity type-1 Seyfert galaxy NGC 1097 (2.00.2), despite the more than two orders of magnitude higher X-ray luminosity of NGC 7469. But the ratio is comparable to that of the close vicinity of the AGN of NGC 1068 ( 1.5). Based on these results, we speculate that some other heating mechanisms than X-ray (e.g., mechanical heating due to AGN jet) can contribute significantly for shaping the chemical composition in NGC 1097.
Subject headings:
galaxies: active — galaxies: individual (NGC 7469) — galaxies: ISM — ISM: moleculesReceived 2015 March 12; accepted 2015 August 16
1. Introduction
Investigation of the distribution, kinematics, and mass of dense molecular material in the centers of galaxies plays a key role in studying the evolution of galaxies because it is the reservoir of fuel for active galactic nuclei (AGNs), and also the site of massive star formation (starburst = SB). On the other hand, these heating sources significantly affect their surrounding gas in radiative and/or mechanical ways. For example, intense UV radiation from massive stars forms photodissociation regions (PDRs) around them, and X-ray dominated regions (XDRs), which can be larger in volume than PDRs, are formed in the vicinity of AGNs (e.g., Maloney et al. 1996; Hollenbach & Tielens 1999; Meijerink & Spaans 2005; Meijerink et al. 2007). Cosmic rays from frequent supernovae (SNe) and the injection of mechanical energy due to SNe or AGN jet/outflow (mechanical heating) are also important for the chemical layout (e.g., Meijerink et al. 2011; Kazandjian et al. 2012, 2015; Matsushita et al. 2015). Thus, the dense molecular gas can provide us critical information on the nature of the underlying physical processes accompanying the non-thermal radiation in the centers of galaxies.
Millimeter/submillimeter spectroscopic observations are indispensable for such a study since they can trace dense, cold molecular material with little dust extinction, which takes the bulk of gas mass in the nuclear regions of galaxies. This would contrast with observations of warm molecular gas such as H2 1-0 S(1) in the near-IR (e.g., Hicks et al. 2009).
Nevertheless, our knowledge on the circumnuclear dense molecular matter has still been limited, especially for AGNs. This is because there have been only a small number of high resolution (i.e., 100 pc or higher scale) and sensitive observations of dense molecular gas even in nearby AGNs (e.g., García-Burillo et al. 2010; Krips et al. 2011; Sani et al. 2012; Matsushita et al. 2015), although several low resolution surveys of dense gas have been conducted with single dish telescopes to address their global properties (e.g., Gao & Solomon 2004a, b).
This situation is now being improved significantly by the advent of the Atacama Large Millimeter/submillimeter Array (ALMA). Indeed, the spatial distribution, kinematics, and the chemistry have been reported in greater detail for, e.g., NGC 1068 (García-Burillo et al. 2014; Viti et al. 2014; Takano et al. 2014; Nakajima et al. 2015) , NGC 1097 (Izumi et al. 2013; Fathi et al. 2013; Martín et al. 2015), NGC 1433 (Combes et al. 2013), and NGC 1566 (Combes et al. 2014). Among these works, Izumi et al. (2013) (hereafter I13) suggested that HCN(4-3)/HCO+(4-3) and HCN(4-3)/CS(7-6) integrated intensity ratios seem to be higher in AGNs than in SB galaxies (submm-HCN enhancement), although the number of the sample galaxies in I13 is few and the actual cause of the enhancement is not clear.
With the above things in mind, we here present the results of our high resolution ALMA band 7 observations of submillimeter dense gas tracers towards the central kpc region of NGC 7469. Because NGC 7469 hosts a luminous type-1 AGN ( = 1.5 1043 erg s-1; Liu et al. 2014), we can investigate the effects of AGN luminosity on the surrounding molecular gas with little uncertainty by directly comparing the results with those obtained in the type-1 low-luminosity ( = 6.9 1040 erg s-1; Liu et al. 2014) AGN, NGC 1097 (I13).
1.1. The target galaxy NGC 7469
NGC 7469 is an active galaxy with a large scale (several kpc) stellar bar detected at near-IR (NIR) wavelength (Knapen et al. 2000). This galaxy is located at the distance of 70.1 Mpc ( = 0.0164; Meixner et al. 1990) thus 1′′ = 330 pc, and hosts a luminous type-1 Seyfert nucleus as evidenced by broad Balmer emission lines (FWHM of H = 4369 km s-1; Peterson et al. 2014) with time variability (e.g., Bonatto & Pastoriza 1990; Collier et al. 1998). Time variability is also confirmed by UV and X-ray observations (e.g., Kriss et al. 2000; Nandra et al. 2000; Petrucci et al. 2004; Scott et al. 2005), revealing this nucleus is indeed an AGN. NGC 7469 is also classified as a luminous infrared galaxy (LIRG) due to its high IR luminosity ( = 1011.7 ; Sanders et al. 2003).
The type-1 AGN is surrounded by a luminous circumnuclear SB ring with a radius of 1.5′′–2.5′′ or 495–825 pc (e.g., Soifer et al. 2003; Díaz-Santos et al. 2007, see also Figure 1a), which accounts for two thirds of the bolometric luminosity of the galaxy (Genzel et al. 1995). Therefore, this galaxy provides us with a nice opportunity to investigate how AGN and SB influence their surrounding molecular gas when observed at high resolution.
The SB ring is prominent at various wavelengths including centimeter (Condon et al. 1991; Wilson et al. 1991; Orienti & Prieto 2010), far-IR (FIR, Papadopoulos & Allen 2000), mid-IR (MIR, Soifer et al. 2003; Gorjian et al. 2004), NIR (Genzel et al. 1995), optical-to-UV (Malkan et al. 1998; Díaz et al. 2000; Díaz-Santos et al. 2007), and soft X-ray (Perez-Olea & Colina 1996). A tidal interaction with its neighbor IC 5283 ( 1.3′ away from NGC 7469) is believed to have caused the powerful SB activity (e.g., Marquez & Moles 1994; Genzel et al. 1995). Dusty, young ( 100 Myr), and massive star clusters (individual typical mass is 106-7 ) exist within the ring (e.g., Díaz-Santos et al. 2007).
As for the central 1′′ region, multi-wavelength studies including centimeter, K-band (2.2 m), and 3.3 m PAH feature indicate that the AGN is energetically dominant at these wavelengths (Lonsdale et al. 2003; Genzel et al. 1995; Imanishi & Wada 2004), although one third of the K-band continuum is of stellar origin (Genzel et al. 1995). A core jet-like structure (e.g., Lonsdale et al. 2003; Alberdi et al. 2006) and ionized outflows (Scott et al. 2005; Blustin et al. 2007) have also been observed in this AGN. Reverberation mapping revealed the mass of the central supermassive black hole () to be 1 107 (Peterson et al. 2004, 2014). This is typical for QSOs at = 5 on average, which will eventually grow up to = 109 at = 0 (Shankar et al. 2009). In addition, the Eddington ratio of this AGN ( 0.3; Petrucci et al. 2004) is also comparable to those of QSOs. Therefore the obtained spectrum of NGC 7469 could serve as a local template for high redshift QSOs as well. Other relevant properties of NGC 7469 are summarized in Table 1 with the information shown above.
| Parameter | Valuea | Referenceb |
| RC3 morphology | (R′)SAB(rs)a | (1) |
| Position of the nucleus | (1) | |
| 23h03m15.6s | ||
| +08∘52′26.4′′ | ||
| Position angle [∘] | 128 | (2) |
| Inclination angle [∘] | 45 | (2) |
| Recession Velocity [km s-1] | 4925 (=0.0164) | (3) |
| Adopted distance [Mpc] | 70.1 | |
| Linear scale [pc arcsec-1] | 330 | |
| Nuclear activity | Seyfert 1 | (4) |
| [erg s-1] | 1.5 1043 | (5) |
| [] | 2.5 1011 | (6) |
| SFR (CND) [ yr-1 kpc-2] | 50–100 | (7) |
| Stellar age (CND) [Myr] | 110–190 | (7) |
Observations of CO molecules revealed the existence of a large amount of cold molecular gas (e.g., Sanders et al. 1988; Meixner et al. 1990; Israel 2009), as well as warm molecular gas (Rosenberg et al. 2015) in the central region of NGC 7469. The detailed spatial structure and the dynamics of the cold molecular gas were first investigated by high resolution (0.7′′) CO(2-1) observations (Davies et al. 2004). Their CO(2-1) map also showed a ring-like structure with a similar radius seen at other wavelengths, and a bright extended ( 1′′) nuclear region. Note that we hereafter call this kind of (100 pc scale) central molecular concentration a circumnuclear disk (CND) in general. Davies et al. (2004) also found a bar or a pair of spiral arms between the ring and the CND, which is only visible in the molecular emission, and not prominent at NIR wavelengths. This configuration is quite unusual (see Section 5). The total molecular gas mass inside the 2.5′′ (825 pc) region inferred from their observations is 2.7 109 . The spatial distributions of typical dense gas tracers such as HCN and HCO+, on the other hand, have not been clear due to the lack of spatial resolution of previous studies.
In this paper, we present the spatial distribution and line ratios of submillimeter dense gas tracers based on our high resolution (0.50′′ 0.40′′, 1′′ = 330 pc) ALMA observations of the central kpc region of NGC 7469 involving HCN(4-3), HCO+(4-3), CS(7-6), and partially CO(3-2) lines, and the underlying continuum emission. Our new ALMA observations improved this situation; we clearly separated the CND from the SB ring, and then obtained a spectrum of each component. The spatial resolution of this study (0.5′′) is comparable to that of the CO(2-1) observation (0.7′′) by Davies et al. (2004), so that we can directly compare the molecular gas distributions and kinematics. Note that, however, the spatial resolution of this study ( 150 pc) would still be insufficient to exclusively probe the region where gas heating due to an AGN with NGC 7469-like luminosity dominates (see Appendix-A for details).
We describe in Section 2 the details of our observations. An 860 m continuum map and a nuclear spectral energy distribution are shown in Section 3. A full band 7 spectrum and some line ratios are presented in Section 4, although we will extensively compare the line ratios with those obtained in other galaxies and discuss the possible causes of the HCN-enhancement in our succeeding paper (Izumi et al. submitted). The spatial distributions of the submillimeter dense gas tracers are shown in Section 5. Finally, our main conclusions are summarized in Section 6. A kinematic study using our data is presented in Fathi et al. (2015).
2. Observation and data reduction
2.1. ALMA band 7 data of NGC 7469
NGC 7469 was observed with ALMA on 2013 November 3-4 with 28 antennas in C32-2 configuration, as a Cycle 1 early science program (ID = 2012.1.00165.S, PI = T. Izumi). Baseline lengths range from 15.0 to 1284.3 m (corresponds to the distance from 17.4 to 1493.4 k at 860 m). The observations were conducted in a single pointing with a 18′′ field of view, which fully covered the nucleus and the SB ring (total 4′′ in diameter). We set the phase tracking center to (, ) = (23h03m15.64s, +08∘52′25.80′′). The receiver was tuned to cover the redshifted lines of HCN(4-3) (rest frequency = 354.505 GHz), HCO+(4-3) ( = 356.734 GHz) in the upper side band, and CS(7-6) ( = 342.883 GHz), CO(3-2) ( = 345.796 GHz) in the lower side band, both in the 2SB dual-polarization mode. Each spectral window has a bandwidth of 1.875 GHz, and two spectral windows were set to each sideband to achieve a total frequency coverage of 7.5 GHz. The velocity spacing was originally 0.43 km s-1 (488 kHz) per channel, but 47 channels were binned to improve the signal-to-noise (S/N) ratio, which resulted in a final velocity resolution of 20 km s-1. In the following, we express velocities in the optical convention. Note that we could only cover the CO(3-2) line with 4900 km s-1 due to the limited band width for ALMA Cycle 1 observations, the recession velocity (4925 km s-1, defined by CO(1-0) observations; Meixner et al. 1990), and the molecular line width of NGC 7469 (typically full width at half maximum = FWHM 200 km s-1 at the nucleus). The bandpass, phase, and flux were calibrated with 3C454.3, J2257+0743 (this object is 2∘ away from NGC 7469), and J2232+117, respectively. Weather conditions were good throughout the observations with system temperatures of 100–200 K (usually 100–150 K). The total on-source integration time was 55 min.
The reduction and calibration of the data were done with
CASA version 4.1 (McMullin et al. 2007) in standard manners,
and the data was delivered to us from the East Asia ALMA Regional Center.
All images of the line and continuum emissions were reconstructed
with the CASA task CLEAN (gain = 0.1, threshold = 1.0 mJy, weighting = natural).
These images were further analyzed with MIRIAD (Sault et al. 1995).
The achieved synthesized beams were typically 0.50′′ 0.40′′,
corresponding to 165 pc 132 pc ( 150 pc
for the geometric mean) at the assumed distance of NGC 7469.
The rms noise in the line channel maps is 0.55–0.58 mJy beam-1
at a velocity resolution of 20 km s-1 after a primary beam correction,
and measured at areas free of line emission.
However, in channels including CO(3-2) emission,
the rms increases to 2.3 mJy beam-1, probably due to remaining sidelobes.
For the continuum emission, the channels free of line emission were averaged,
which resulted in an rms of 0.09 mJy beam-1
centered at = 349.7 GHz (860 m),
after combining both the LSB and USB data.
This continuum emission was subtracted in the -plane before making line maps.
The conversion factors between Jy beam-1 and K are 51.50, 51.60, 50.47, and 51.83 K (Jy beam-1)-1
for CS(7-6), CO(3-2), HCN(4-3), and HCO+(4-3), respectively.
We used the MIRIAD task MOMENT to make the integrated intensity maps presented in Section 5,
by computing the zeroth moment of each data cube without any clipping.
The velocity range included for the integration was
4650–5250 km s-1 for CS(7-6), HCN(4-3), and HCO+(4-3),
but the lower limit was 4900 km s-1 for CO(3-2) due to our spectral setting restrictions.
These velocity ranges can cover the whole spectral range obtained within our 18′′ field of view, except for CO(3-2).
Throughout this paper, the pixel scale of ALMA images is set to 0.1′′,
and the displayed errors indicate only statistical ones unless mentioned otherwise.
We use line intensities corrected for the primary beam attenuation for quantitative discussions.
But this correction is not critical since most of the emission is within 4′′.
The adopted systematic error of the absolute flux calibration was 10 %111https://almascience.eso.org/documents-and-tools/cycle-1/alma-proposers-guide.
2.2. Ancillary data
We retrieved the Hubble Space Telescope (HST) ACS/HRC image (F550M) of NGC 7469 from the Hubble Legacy Archive (HLA)222http://hla.stsci.edu. This image was calibrated by the HST pipeline products in a standard manner. We used the image only to check the positional consistency or shift between peaks in optical (V-band) and our ALMA band 7 images as shown in Section 3.
3. 860 m continuum emission
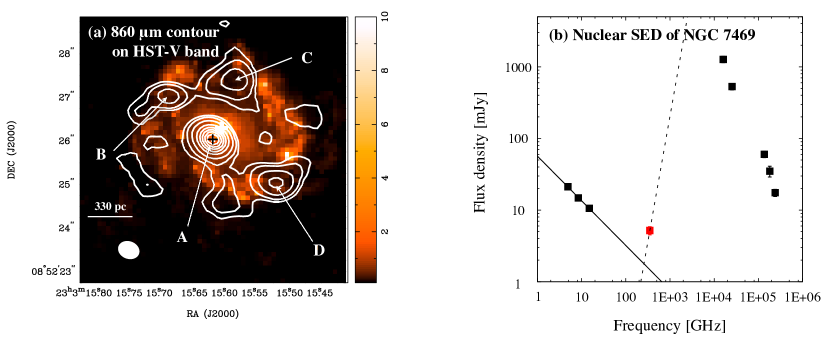
Figure 1a shows the 860 m continuum emission overlaid on the HST V-band (F550M) emission in the central 2 kpc region of NGC 7469. In this figure, we can see a bright central source, which corresponds to the CND as defined in Section 1.1, and some knots in the SB ring with a radius of 1.5′′ ( 500 pc). The peak position of the 860 m continuum emission is (, ) = (23h 03m 15s.62, +08∘ 52′ 26.04′′), which precisely coincides with that of the VLA 8.4 GHz (3.5 cm) continuum emission (Condon et al. 1991; Orienti & Prieto 2010; their angular resolutions were 0.22′′–0.25′′). This precise match supports the accuracy of the astrometry of ALMA. We hereafter treat this peak position as the position of the AGN of NGC 7469. The 860 m flux density there (marked as A in Figure 1a) is 5.190.09 mJy beam-1. The 860 m knots in the SB ring (marked as B, C, and D in Figure 1a) coincide with those visible at centimeter wavelengths (e.g., 8.4 GHz; Orienti & Prieto 2010), and the knots of dense molecular gas tracers such as CO(3-2), HCN(4-3), and HCO+(4-3) (Section 5). On the other hand, there is inconsistency between the peak positions of the 860 m and those of the V-band emissions. The magnitude of this positional shift is 0.5′′, which is the same size as our synthesized beam and thus significant. Similar discrepancy was also reported between the PdBI CO(2-1) emission and HST J-band maps (Davies et al. 2004), and between centimeter and J, H, K-bands maps (Genzel et al. 1995), for example. Although one possible explanation for the discrepancy is that the absolute astrometry of HST is slightly off, it is rather likely that the stellar light is obscured by large amounts of dust traced by the 860 m emission as also suggested by Díaz-Santos et al. (2007).
We also investigated the origin (thermal or non-thermal) of the 860 m continuum at the position-A
by constructing the spectral energy distribution (SED) as shown in Figure 1b.
We used high angular resolution (comparable to, or higher than our ALMA band 7 resolution = 0.5′′) data of
4.9 GHz from Wilson et al. (1991), 8.4 GHz and 14.9 GHz from Orienti & Prieto (2010),
11.8 m and 18.7 m from Reunanen et al. (2010), and J, H, and K-bands from Genzel et al. (1995).
The systematic flux uncertainty is included.
Although the data is sparse at the submilimeter to FIR range,
the SED indicates that the centimeter continuum emission can be
well reproduced as synchrotron ( = -0.620.02; flux ),
whereas the flux density of the 860 m continuum is well beyond the expected value of the synchrotron emission,
i.e., the 860 m continuum is dominated by thermal emission.
Note that the percentage of the 860 m continuum that is due to synchrotron is 30% as estimated from the above scaling.
In addition, we used the CLEAN algorithm to deconvolve the continuum emission in the LSB and USB of ALMA band 7 separately.
Then, the flux at position-A is 4.660.13 mJy beam-1 and 5.000.13 mJy beam-1 at 343.7 GHz and 356.0 GHz, respectively
(errors indicate statistical ones only since they were observed simultaneously), suggesting a positive spectral index
( = 01; flux , but the number of data points is just two for this fitting).
Therefore, we conclude that the 860 m continuum at the position-A mainly originates from thermal dust.
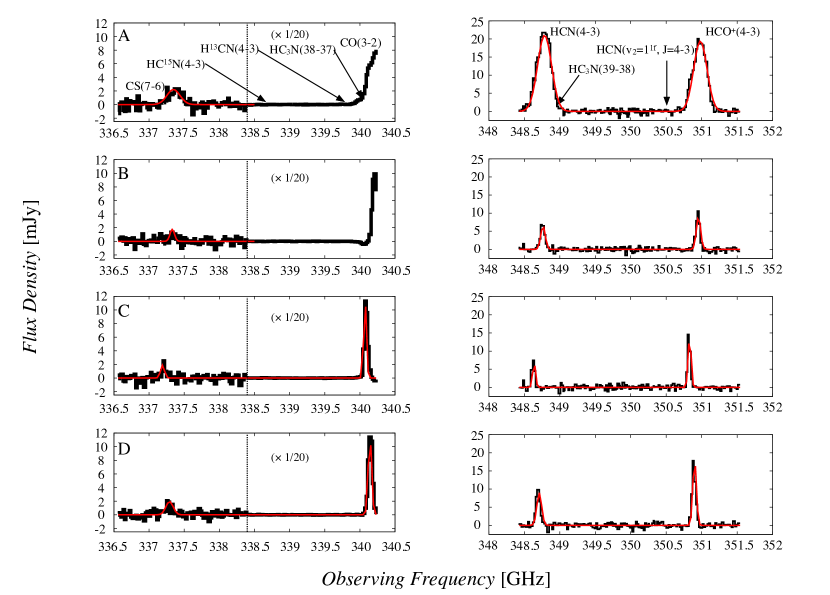
4. Band 7 spectra, line ratios, and dense molecular gas mass
Here we show the ALMA band 7 spectra in Figure 2. These spectra were extracted from a single synthesized beam (150 pc-resolution) placed at the positions A-D in Figure 1a, for comparison. The strongest line at the position-A is CO(3-2), followed by HCN(4-3), HCO+(4-3), and CS(7-6). Other lines were not detected (i.e., 3 ) or are blended with other lines, and their spectral positions are marked by black arrows in Figure 2. On the other hand, at the SB ring (positions B-D), HCO+(4-3) is brighter than HCN(4-3). The FWHM of the HCN(4-3) and HCO+(4-3) emissions are 200 and 190 km s-1, 66 and 60 km s-1, 41 and 42 km s-1, and 50 and 50 km s-1 at the positions A-D, respectively (see also Figures 4 and 5). Thus, these values are consistent with each other, which suggests that they are tracing the same volume. We list the emission line parameters at these positions in Table 2 with other relevant quantities.
4.1. and
By inspecting the spectra, one may notice that the HCN(4-3)/HCO+(4-3) integrated intensity ratio (hereafter ) is higher than unity only at the position-A. To further clarify this, we list the values of , and the HCN(4-3)/CS(7-6) integrated intensity ratio (hereafter ; I13 also proposed this ratio to be an empirical discriminator of AGN and SB) at the positions A-D in Table 3. The integrated intensity of each line emission at each position is given in Table 2. They are calculated by the Gaussian fit to the data. The line ratios in Table 3 are consistent to the submm-HCN enhancement scenario first proposed by I13, i.e., AGNs tend to show higher and/or compared to SB galaxies, although the at the position-A is only slightly larger than unity and totally comparable to the of a typical early phase (e.g., Martín et al. 2009) SB galaxy NGC 253 (1.10.3; I13). But the ratio is significantly higher than that of a typical late phase (e.g., Martín et al. 2009) SB galaxy, M82 ( 0.4; I13). Note that a mechanical heating due to, e.g., frequent supernovae, would be responsible in the central region of NGC 253 (Rosenberg et al. 2014a) for its relatively high , as compared to M82.
By investigating the 8.4 GHz radio flux obtained at 0.2′′ (Colina et al. 2001) and at 0.03′′, Davies et al. (2007) estimated that a nuclear supernova rate is 0.1 yr-1. This rate corresponds to a star formation rate of 15 yr-1 assuming the Salpeter initial mass function (Salpeter 1955). Our relatively large spatial resolution ( 150 pc) would pick up line fluxes emanating from the extended SB activity inside the CND (see also Appendix-A for the estimated size of the XDR of NGC 7469), which would impact the line ratios discussed here. We can not find any morphological and kinematic signatures of a jet-ISM interaction in the high resolution maps of H2 and Br emissions (Hicks et al. 2009; Müller-Sánchez et al. 2011), although Lonsdale et al. (2003) reported the existence of a core radio jet-like structure. Therefore, we speculate that the energetics of the CND of NGC 7469 is influenced by both the AGN (XDR) and the SB activity (PDR) when observed at the rather coarse resolution (150 pc in this work).
In our succeeding paper (Izumi et al. submitted), we conducted non-local thermodynamic equilibrium (non-LTE) line modelings by the RADEX code (van der Tak et al. 2007). Assuming a one zone cloud, we widely changed gas kinetic temperature, molecular column density, molecular abundance ratio, and background temperature (we expect higher background temperature in AGNs than in SB galaxies), but fixed H2 gas density among the models ( = 105 cm-3). This treatment was based on the assumption that there would be no systematic variation in between AGNs and SB galaxies. Then, we calculated the resultant line intensity ratio, i.e., or , in each model case. As a result, we found that both (HCN)/(HCO+) 10 and (HCN)/(CS) 10 are required to reproduce 1 and 10 as are observed in NGC 7469 and NGC 1097. Furthermore, the line opacity of HCN(4-3) is moderately thick, whereas that of CS(7-6) is thin when 10. Here, indicates a molecular fractional abundance relative to H2. The above required abundance ratios are significantly higher (at least by a factor of a few) than those necessary to reproduce the line ratios in SB galaxies. Therefore, these results suggest that a chemical abundance variation between AGNs and SB galaxies would be the key for the HCN-enhancement.
| Emission | Peak flux | |||||||
| [GHz] | [cm-3] | [K] | [mJy beam-1] | [km s-1] | [km s-1] | [Jy beam-1 km s-1] | [K km s-1] | |
| (1) | (2) | (3) | (4) | (5) | (6) | (7) | (8) | (9) |
| CS(=7-6) | 342.883 | 2.9106 | 65.8 | 2.200.58 | 4919.729.3 | 196.527.2 | 0.460.14 | 23.77.1 |
| 1.74∗ | - | - | 0.12† | 6.2† | ||||
| 1.870.58 | 5059.960.6 | 59.018.0 | 0.120.05‡ | 6.02.6‡ | ||||
| 1.980.58 | 4982.247.9 | 74.117.0 | 0.160.06‡ | 8.03.0‡ | ||||
| CO(=3-2) | 345.796 | 8.4103 | 33.2 | - | - | - | - | - |
| 2022∗∗ | - | - | - | - | ||||
| 2322∗∗ | - | - | 9.71.2† | 498.961.0† | ||||
| 2352∗∗ | - | - | 12.00.4† | 617.519.2† | ||||
| HCN(=4-3) | 354.505 | 8.5106 | 42.5 | 21.000.55 | 4915.87.8 | 199.66.7 | 4.460.19 | 225.19.5 |
| 6.410.55 | 4935.017.5 | 65.55.9 | 0.450.06 | 22.62.8 | ||||
| 6.840.55 | 5044.226.5 | 41.05.0 | 0.300.04 | 15.02.0 | ||||
| 8.980.55 | 4981.316.3 | 50.11.5 | 0.480.03 | 24.21.7 | ||||
| HCO+(=4-3) | 356.734 | 1.8106 | 42.8 | 19.380.58 | 4914.15.7 | 189.74.8 | 3.910.15 | 202.87.9 |
| 9.090.58 | 4936.613.0 | 60.33.9 | 0.580.05 | 30.22.7 | ||||
| 14.500.58 | 5045.28.9 | 41.51.9 | 0.640.04 | 33.22.0 | ||||
| 18.240.58 | 4984.46.1 | 50.11.5 | 0.970.04 | 50.42.2 | ||||
| 860 m | 349.7 | - | - | 5.190.09 | - | - | - | - |
| 1.040.09 | - | - | - | - | ||||
| 1.230.09 | - | - | - | - | ||||
| 1.700.09 | - | - | - | - |
| Position | A | B | C | D |
|---|---|---|---|---|
| 1.110.06 | 0.750.11 | 0.450.07 | 0.480.04 | |
| 9.502.87 | 3.65 | 2.501.13 | 3.031.15 | |
| - | -∗ | 0.030.01 | 0.040.01 |
In the following, we discuss possible mechanisms to realize the abundance variation in AGNs, although it is still unclear, since (1) there are various ways to change the chemical compositions significantly (e.g., X-ray irradiation, mechanical heating, high temperature chemistry), and (2) the number of high resolution observational data of dense gas tracers is currently insufficient.
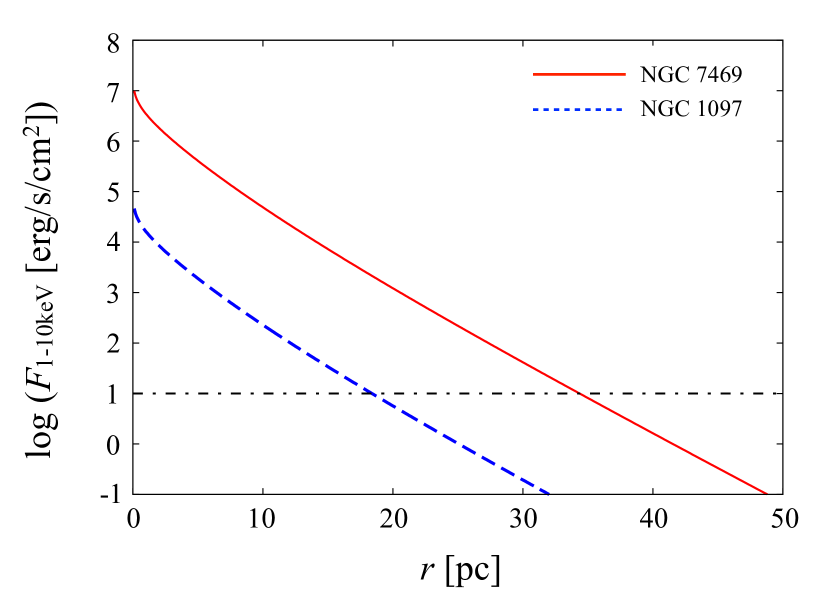
In conventional XDR models (Lepp & Dalgarno 1996; Meijerink & Spaans 2005), we find reproducing a high (HCN)/(HCO+) such as 10 is hard (usually it is less than unity), since a powerful ionizing capability in XDRs will favor to enhance ionic species such as HCO+. Nonetheless, according to the steady state, gas phase 1-dimensional XDR models intensively presented by Meijerink & Spaans (2005) and Meijerink et al. (2007), we can expect a high (HCN)/(HCO+) and the resultant 1 in a low-to-moderate gas density ( 105 cm-3) cloud with a low hydrogen column density ( 1022.5 cm-2) and a high X-ray flux (e.g., 10 erg s-1 cm-2). For larger where the is attenuated, they predicted 1. Following this scenario, we estimate the largest distance from the AGN that can keep 10 erg s-1 cm-2 is 18 pc and 35 pc for NGC 1097 and NGC 7469, respectively, considering their 2-10 keV X-ray luminosities ( = 6.9 1040 erg s-1 and 1.5 1043 erg s-1 for NGC 1097 and NGC 7469, respectively; Liu et al. 2014). We here assume that the X-ray emission is isotropic around the AGN itself. Attenuation due to obscuring material is considered for this estimation (Morrison & McCammon 1983; Appendix-B). But one critically weak point in this scenario is that the model predicted line intensities are extremely low (Meijerink et al. 2006, 2007), which is inconsistent to the prominent HCN(4-3) and HCO+(4-3) emission lines in these galaxies. Furthermore, Martín et al. (2015) argued that HCN(1-0)/HCO+(1-0) integrated intensity ratio is decreased in NGC 1097 as we approach the very central region ( 2 at the edge of the CND333An upper limit of the image convolved size is 90 pc 70 pc (I13), but 1.5 at the center), which seems to be incompatible with the above speculation of the largest distance for a high line ratio in NGC 1097. Note that, however, Martín et al. (2015) did not fully resolve the CND of NGC 1097, thus, their argument is a tentative one at this moment.
Another possible scenario is the high temperature gas phase chemistry (Harada et al. 2010), which significantly enhances (HCN) especially at 300 K due to the activated formation path from CN (see also Figure 17 of I13). This mechanisms would be important to make line intensity of HCN(4-3) sufficiently detectable. Furthermore, (HCO+) will be somewhat decreased in these models since they will react with H2O (this is also a typical molecule in a high temperature environment) to form H3O+. This type of chemistry can be complemented to XDRs (Harada et al. 2013) where we can expect much higher gas temperature in such regions due to efficient X-ray heating than in SB environments. Indeed, some fraction of warm molecular gas exists in NGC 7469, as evidenced by the detections of near-IR H2 (Hicks et al. 2009) and high- CO emission lines (Rosenberg et al. 2015).
With these items, we here focus on the notable fact that the obtained at the position-A of NGC 7469 (1.110.13) is only as half as that at the CND of NGC 1097 (2.00.2; I13), despite the more than two orders of magnitude higher X-ray luminosity of NGC 7469. Note that NGC 1097 also hosts a nuclear SB activity in the CND ( a few yr-1; Davies et al. 2007), which would contaminate the line fluxes obtained with the 100 pc resolution beam (I13). Furthermore, García-Burillo et al. (2014) found = 1.5 at the vicinity of the AGN in NGC 1068 ( = 6.9 1042 erg s-1; Panessa et al. 2006), whereas it increases to 3 at the East/West-knots of its CND, which are 100 pc away from the AGN (their spatial resolution was 35 pc). These results indicate that higher X-ray luminosity does not simply lead to higher . From the perspective of high temperature chemistry, the results again seem to be controversial, since the large difference in X-ray luminosity would compensate the 2.5 times larger spatial scale (in area) sampled in NGC 7469 than in NGC 1097, leading to a higher X-ray energy deposition rate per particle (this is an important parameter to determine the thermal structure of XDRs e.g., Maloney et al. 1996) in NGC 7469, if the molecular gas distributes uniformly over the CND. In this case, we can expect a higher in NGC 7469 than in NGC 1097 by a naive view, but the actual result is totally opposite.
Therefore, we presume that a non-radiative heating, namely mechanical heating caused by, e.g., AGN jet or outflow, is important to realize the high of 2-3 (Kazandjian et al. 2012, 2015) as is observed in NGC 1097 and in the East/West knots of the CND of NGC 1068. Indeed, a large radio jet exists in NGC 1068, which is supposed to cause shocks in the knots (e.g., Krips et al. 2011). Furthermore, a radio core jet has been discovered in NGC 1097 (e.g., Mezcua & Prieto 2014), although its intrinsic (deprojected) size is uncertain. However, we can not discard the possibility such as the line emitting region of NGC 1097 is extremely centrally-concentrated, which would result in higher energy deposition rate per particle (i.e., more violent X-ray heating) than in NGC 7469 and the close vicinity of NGC 1068. Moreover, we again emphasize that the line fluxes of NGC 7469 would be contaminated by the emission from the extended SB region inside the CND. Higher resolution observations of these molecular emissions are necessary to accurately map the distribution of the line ratios across the CND of NGC 1097 and NGC 7469, and to search for a signature of shock-ISM interaction.
4.2. Other line emissions and their ratios
Table 3 also includes HCN(4-3)/CO(3-2) integrated intensity ratios () extracted at the positions C and D. We exclude the ratio at the positions A and B since we could not measure the accurate fluxes there. Admitting the uncertainty in CO(3-2) integrated intensity (we used the velocity centroid and the FWHM of HCN(4-3) emission line to fit the Gaussian profile to CO(3-2) line; see also Figure 2 and Table 2), the tentative at the SB ring are well below the value obtained in Ori-KL ( 0.32; Schilke et al. 1997). Since the line critical density is orders of magnitude different between HCN(4-3) and CO(3-2) (see Table 2), we can expect the line emitting region of HCN(4-3) is much smaller than that of CO(3-2). Hence, this ratio would be highly prone to be affected by the spatial resolution, which could lead to significantly lower in NGC 7469 than in Ori-KL. This is well manifested in the case of NGC 253 (SB galaxy). When observed at 200-300 pc resolution (comparable to our 150 pc resolution for NGC 7469), 0.03 (Knudsen et al. 2007; Israel et al. 1995), which is quite similar to our result. However, the ratio increase to 0.08, i.e., increase by a factor of a few, when observed at higher resolution (25-30 pc; Sakamoto et al. 2011). Then, matching the spatial resolution is important to compare line ratios of emission lines with totally different critical densities among objects.
We also found that the H12CN(4-3)/H13CN(4-3) isotopic ratio at the position-A was 11.9 in the brightness temperature scale. Note this is a peak intensity ratio and we used a 3 upper limit for H13CN(4-3). Then, adopting a 12C/13C ratio of 40 observed in NGC 253 (Henkel et al. 2014; Martín et al. 2010, 340 pc resolution), the upper limit to the opacity of the H12CN(4-3) is 3.5 at the position. For this calculation, we assume (1) the gas is in the LTE, (2) H12CN is optically thick, (3) H13CN is optically thin, and (4) H12CN and H13CN emissions are coming from the same volume of gas. Alternatively, if we adopt a 12C/13C ratio of 100 obtained in Mrk 231 (Henkel et al. 2014, 19 kpc resolution), the upper limit of the opacity increases to 8.8. In either case, the derived optical depth is rather smaller than the values of the Galactic star forming regions (e.g., 70 in Ori-KL; Schilke et al. 1997), likely reflecting the much more turbulent environments in the nuclear regions of galaxies.
Note that vibrationally excited HCN emission, namely HCN(=11f, =4-3) at = 356.256 GHz, was not detected at the position-A, despite the fact that NGC 7469 is classified as a LIRG (Sanders et al. 2003) hosting a luminous AGN. Considering the above mentioned modest optical depth of H12CN(4-3), we can expect HCN(=11f, =4-3) is completely optically thin, which makes itself hard to be detectable. Therefore, the non-detection of HCN(=11f, =4-3) emission does not necessarily mean that IR-pumping has little contribution to the observed line intensities, although we here simply treat that the HCN(4-3) emission is the consequence of the purely rotational transition. We need quantitative modeling of the line excitation to further address this problem. We also note that the contribution of HC3N(39-38) emission to the HCN(4-3) emission is negligible at the position-A since HC3N emission is typically much fainter than that of HCN, and the line profile of the bluer HCN(4-3) is very similar to that of HCO+(4-3), which does not suffer from line blending. We thus conclude that the contribution of HC3N(38-37) to the CO(3-2) emission is also negligible.
4.3. Dense molecular gas mass
In addition to and , we list line luminosities of HCN(4-3) and HCO+(4-3) extracted at the position-A and the whole CND (i.e., central 1′′ diameter region) in Table 4 as well since these lines are relatively strong enough to be detectable even in high redshift galaxies (e.g., Barvainis et al. 1997; Riechers et al. 2011). By using this data, we roughly estimate the mass of dense molecular gas () in the CND as follows. First, we convert to the corresponding value of HCN(1-0), assuming HCN(4-3)/HCN(1-0) = 0.60.2 in the brightness temperature unit. This ratio is an averaged value over the CND of the nearby typical Seyfert-2 galaxy, NGC 1068, sampled at 100 pc resolution (Viti et al. 2014). Note that NGC 1068 has a quite similar X-ray luminosity and an Eddington ratio to NGC 7469. Then, we obtain = (9.33.1) 106 K km s-1 pc2. Finally, assuming a conversion factor from to to be 10, which is derived for AGNs by Krips et al. (2008) based on IRAM 30m observations, we estimate = (9.33.1) 107 . The dynamical mass () of the CND, on the other hand, is calculated assuming a thin disk with Keplerian rotation as, = 230 (/pc) [/(km s-1)] (sin )-2 . Here, is a rotation velocity at a radius , and is an inclination angle of the disk. Then, putting the FWHM 200 km s-1 at the CND (1′′ = 330 pc diameter) and = 45∘ (Davies et al. 2004), we obtain = 7.6 108 . This is almost identical to the value derived in Fathi et al. (2015), who isolated the rotation velocity and the velocity dispersion based on their harmonic decomposition analysis of the observed velocity field. Our is also consistent to those derived for 2.5′′ region, i.e., including the SB ring (6.5 109 ; Davies et al. 2004).
Taking them together, we can estimate the dense gas mass fraction in the CND of NGC 7469 as 12%. Recalling the fact that the above used mass conversion factor has a factor of 3 uncertainty (Krips et al. 2008), eventually has the same level of uncertainty at this moment. Therefore, although the value of 12% is comparable to those estimated for low-luminosity AGNs (Sani et al. 2012) using the same conversion factor (i.e., 10), it is still difficult to speculate whether or not has any relevance with the current mass accretion onto the central supermassive black hole. We need an accurate mass conversion factor estimated through multi-transitional analysis (i.e., estimating an accurate relative abundance of HCN with respect to H2) to further constrain the and its relevance to the nuclear activity.
| [] | [] | [K km s-1 pc2] | [K km s-1 pc2] | |
| AGN position | (7.950.34) 103 | (7.010.27) 103 | (5.580.24) 106 | (4.830.19) 106 |
| CND | (2.100.09) 104 | (1.860.08) 104 | (1.470.06) 107 | (1.280.06) 107 |
5. Spatial distribution of the dense gas tracers
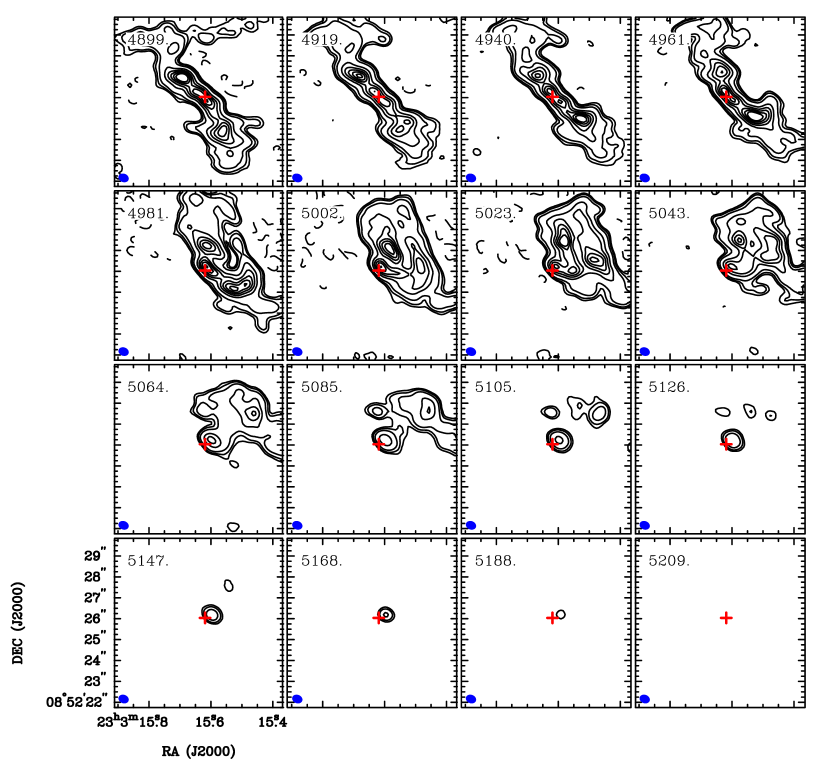
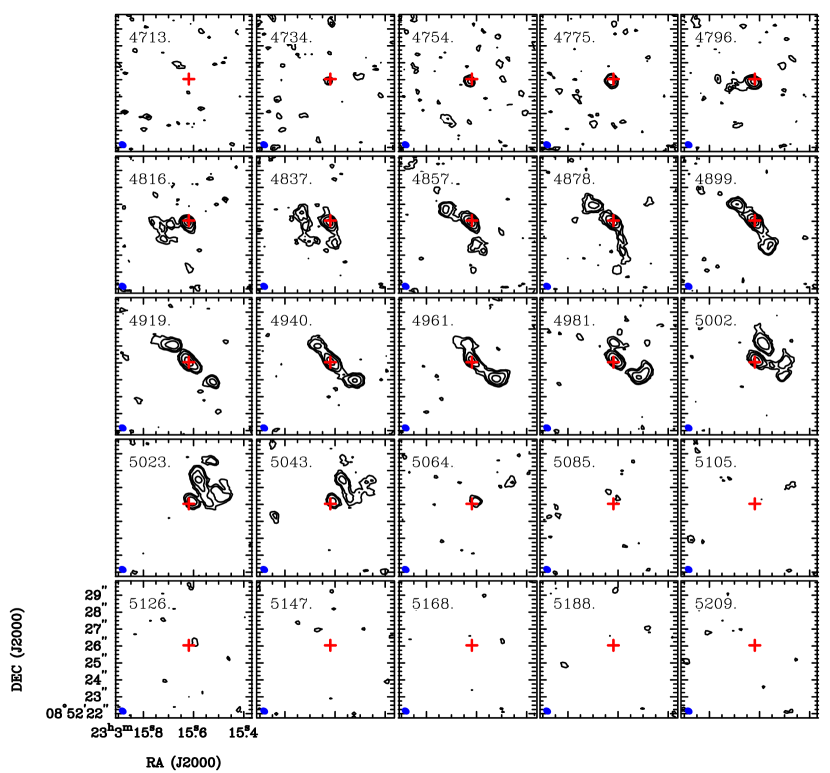
We show in Figures 3 to 5 the channel maps of the CO(3-2), HCN(4-3), and HCO+(4-3) line emissions from the central 8′′ 8′′ (2.6 kpc 2.6 kpc) region of NGC 7469. We could not cover the whole CO(3-2) emission line as noted before. Comparing with CO(2-1) map in Davies et al. (2004), we conclude that the emission from the south-west region of the map is missing. The HCN(4-3) and HCO+(4-3) emissions were detected (i.e., 3 ) over velocity ranges of 4744-5165 km s-1 and 4752-5150 km s-1 at the position-A, respectively, of which widths (FWZI 400 km s-1) are almost consistent with each other. As for CO(3-2), the covered velocity range corresponds to 70% of the total velocity range of HCN(4-3) and HCO+(4-3) at the position-A. However, we can not see a clear turnover feature in the CO(3-2) spectrum at that position (Figure 2). Therefore, we conclude that the FWZI of CO(3-2) emission line is significantly wider than those of HCN(4-3) and HCO+(4-3) lines there. It might be possible that we detected CO(3-2) emission from an outer diffuse, high-velocity component around the CND. It might also be possible that the high velocity component of HCN(4-3) and HCO+(4-3) emission lines are too faint to be significantly detectable. On the other hand, the line widths at the knots of the SB ring are almost consistent among CO(3-2), HCN(4-3), HCO emission lines (Figure 2). The channel maps also show that the CND and the SB ring are bridged by a bar-like, or several spiral arm-like structures as morphologically discussed later. A detailed kinematic study of this region is presented in Fathi et al. (2015).
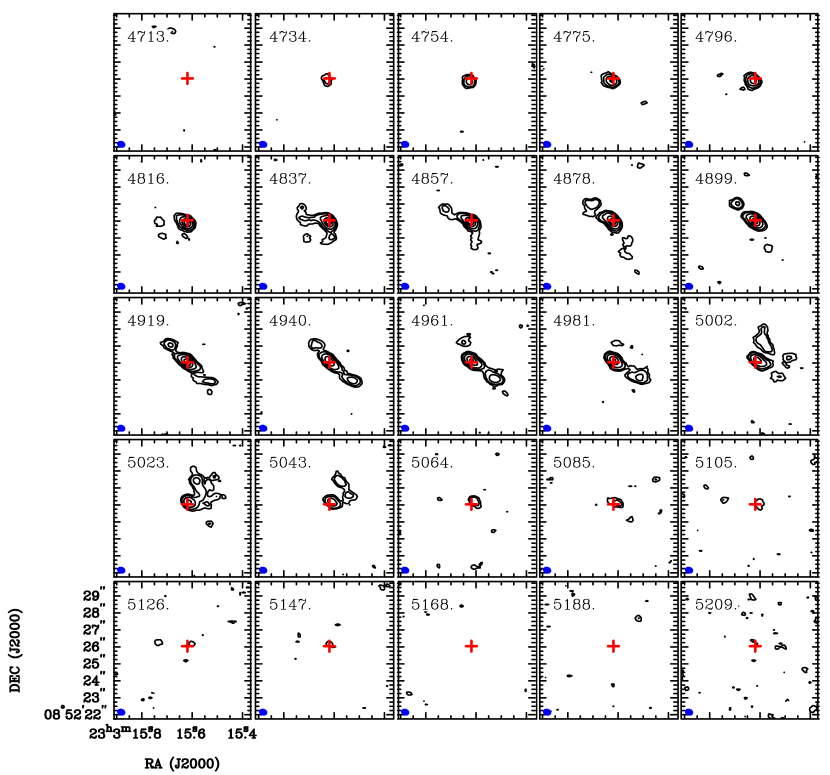
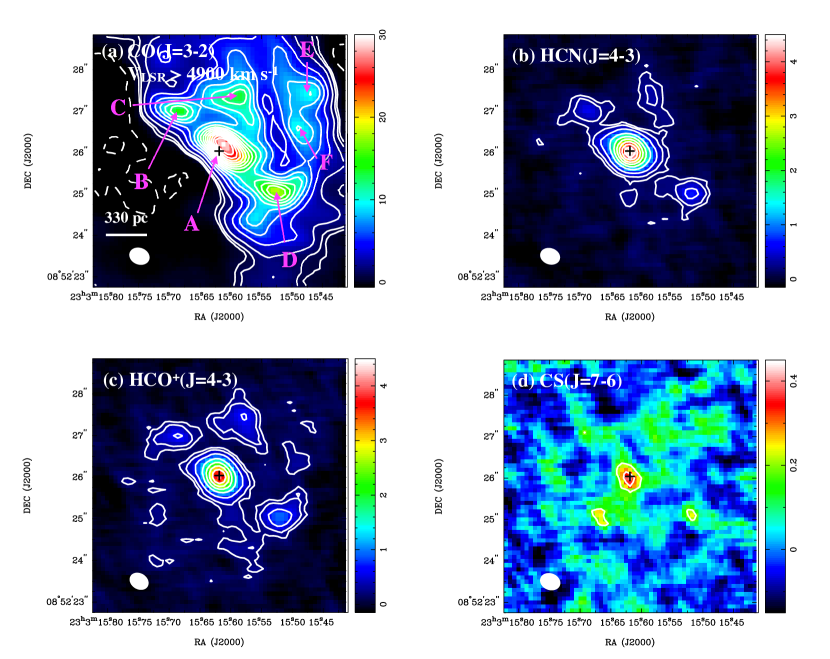
We also show the maps of the CO(3-2), HCN(4-3), HCO+(4-3), and CS(7-6) velocity-integrated intensities in the central 2 kpc region of NGC 7469 in Figure 6. The peak positions of the 860 m continuum emission (the positions A-D in Figure 1a) are again marked by the arrows in the CO(3-2) map. The dense gas tracers are also bright at these peak positions, indicating they are the sites of dust-obscured star formation. Two rather fainter knots are also seen in the CO(3-2) map, which are located northwest to the CND (marked as E and F).
From these maps, it is apparent that the HCN(4-3), HCO+(4-3), and CS(7-6) emissions are significantly concentrated towards the CND. A two-dimensional Gaussian fit to the HCN(4-3) image shows that the CND has an extent of (244.29.9) (194.76.6) pc2 with PA = 58.8∘6.7∘, which is similar to that of HCO+(4-3) emission. This is the beam-convolved size, thus the actual CND must be smaller. We derived these uncertainties using Monte Carlo techniques by creating 103 realizations of the image, each time adjusting the data by adding the normally-distributed (measured) noise randomly. Again using Figure 6, we estimate that the CND of NGC 7469 contains 82 % and 53 % of the total emission of HCN(4-3) and HCO+(4-3) within the 18′′ field of view of ALMA ( 6 kpc), respectively, suggesting their utility to probe the nuclear regions of external galaxies especially about HCN(4-3).
Here, we expect that the missing flux is not significant for the CND, although we recovered only 5416 % of the HCO+(4-3) flux measured by APEX (Zhang et al. 2014) within the central 18′′ region, since its size ( 1′′) is much smaller than that of the maximum measurable angular scale of our observations, which was 7.1′′ (2.3 kpc). Since the APEX’s HCO+(4-3) spectrum of Zhang et al. (2014) is somewhat noisy, we can expect the systematic flux uncertainty would be larger than the value mentioned in that paper (15% for absolute flux calibration uncertainty) additionally due to, e.g., baseline uncertainty. In other words, we expect the actual recovered rate can be higher than 54%. Unfortunately, we can not estimate the percentage of the recovered flux of HCN(4-3) and CS(7-6) since there are currently no significant detection of these line emissions with single dish telescopes.
In addition to the CND, we can see a partial circumnuclear SB ring at a radius of 1.5′′–2.5′′. Davies et al. (2004) also reported the existence of a bar or a pair of short, loosely wound spiral arms at a PA = 56∘ between the CND and the SB ring (connecting the positions B-A-D in Figure 6a), based on their 0.7′′ CO(2-1) observations. Interestingly, that structure is only found in molecular emission; neither K-band (Genzel et al. 1995; Scoville et al. 2000) nor centimeter continuum (Condon et al. 1991; Orienti & Prieto 2010) image shows such a structure. This configuration is quite unusual if the structure is a genuine molecular bar, since a corresponding stellar structure should be easily visible in this scenario. Indeed, Davies et al. (2004) found no kinematic characteristics expected for a barred potential, i.e., an S-shaped contours in a isovelocity field (e.g., Lundgren et al. 2004; Kohno et al. 1999) and a tilted-X shape in a position-velocity diagram along the (hypothesized) bar axis (e.g., Laine et al. 1999; Sakamoto et al. 2000). Moreover, Figures 4 and 5 reveal that there seem to be several connections between the CND and the SB ring in addition to the above hypothesized bar axis, e.g., channels at around 4850, 4980, and 5020 km s-1. Although we can not rule out the existence of a faint stellar bar that could not be detected in previous NIR observations, it might be possible that the nuclear region of NGC 7469 consists of several spiral features like the case of, e.g., NGC 1097 (Prieto et al. 2005; Fathi et al. 2006; Davies et al. 2009). Since the lack of spatial resolution leads to blending several molecular clouds, which would result in an illusional bar, higher angular resolution and sensitivity observations of both CO and NIR emissions are necessary to settle this issue.
6. Summary and conclusion
In this paper, we present high resolution (0.5′′ 0.4′′; 1′′ = 330 pc) ALMA band 7 (350 GHz band) observations of the submillimeter dense molecular gas tracers such as HCN(4-3), HCO+(4-3), CS(7-6), and partially CO(3-2), in addition to the underlying 860 m continuum emission, towards the central kpc region of the luminous type-1 Seyfert galaxy, NGC 7469. The region consists of the CND (central 1′′) and the surrounding SB ring with a radius of 1.5′′-2.5′′. We revealed the spatial distribution of these emissions. Thanks to the high spatial resolution, we can reliably measure the line fluxes at the CND and the SB ring separately. The obtained line ratios are directly compared with those in NGC 1097 (a low-luminosity type-1 Seyfert galaxy), to achieve insights of possible effects of AGN luminosity on the surrounding molecular material. The main results of our observations and conclusions are summarized as follows:
-
-
The spatial distribution of the 860 m continuum emission resembles well to those of centimeter and MIR continuum emissions, and dense molecular gas tracers. But their peak positions (including some knots in the SB ring) are shifted significantly from the optical ones, suggesting the existence of dust obscured star formation there.
-
-
The maximum position of the 860 m continuum is identical to that of the VLA 8.4 GHz continuum, indicating it is the AGN position. The SED reveals that the 860 m continuum there is dominated by a thermal dust emission. We detected CO(3-2), HCN(4-3), HCO+(4-3), and CS(7-6) emissions at the same position. Other lines including the vibrationally excited HCN were not detected, although NGC 7469 is classified as a LIRG.
-
-
The high and are only found in the CND, which is consistent to the findings in I13, i.e., AGNs tend to show higher ( 1) and/or ( 10) than those in SB galaxies (submm-HCN enhancement).
-
-
Although the actual physical mechanisms to enhance in AGNs are still unclear, we found this ratio is significantly lower in NGC 7469 (1.110.06) than in NGC 1097 (2.00.2) despite the more than two orders of magnitude higher X-ray luminosity of NGC 7469 than that of NGC 1097. The close vicinity of the luminous AGN of NGC 1068 also shows a comparable ratio ( 1.5) to NGC 7469. Some other heating mechanisms than X-ray (e.g., mechanical heating) would contribute significantly for shaping the chemical composition in NGC 1097.
-
-
The CO(3-2) emission, which is not fully observed though, is distributed over both the CND and the SB ring, whereas the HCN(4-3) and the HCO+(4-3) emissions are significantly concentrated toward the CND ( 82% and 53% of the total flux inside the 18′′ field of view of ALMA, for HCN and HCO+, respectively), suggesting their utility to probe the nuclear regions of galaxies.
-
-
Between the CND and the SB ring, we found several spiral-like structures, which would be transporting gas from the SB ring to the CND. This might be a more preferable scenario than a bar. We should test this tentative view by further high resolution observations and kinematic analysis.
From this work, we achieved supportive evidence for the submm-HCN enhancement in AGNs tentatively proposed by I13. We will further investigate this trend by increasing the number of sample galaxies, and extensively discuss the possible cause of the HCN-enhancement in our succeeding paper (Izumi et al. submitted).
References
- Alberdi et al. (2006) Alberdi, A., Colina, L., Torrelles, J. M., et al. 2006, ApJ, 638, 938
- Barvainis et al. (1997) Barvainis, R., Maloney, P., Antonucci, R., & Alloin, D. 1997, ApJ, 484, 695
- Blustin et al. (2007) Blustin, A. J., Kriss, G. A., Holczer, T., et al. 2007, A&A, 466, 107
- Bonatto & Pastoriza (1990) Bonatto, C. J., & Pastoriza, M. G. 1990, ApJ, 353, 445
- Colina et al. (2001) Colina, L., Alberdi, A., Torrelles, J. M., Panagia, N., & Wilson, A. S. 2001, ApJ, 553, L19
- Collier et al. (1998) Collier, S. J., Horne, K., Kaspi, S., et al. 1998, ApJ, 500, 162
- Combes et al. (2013) Combes, F., García-Burillo, S., Casasola, V., et al. 2013, A&A, 558, A124
- Combes et al. (2014) —. 2014, A&A, 565, A97
- Condon et al. (1991) Condon, J. J., Huang, Z.-P., Yin, Q. F., & Thuan, T. X. 1991, ApJ, 378, 65
- Davies et al. (2009) Davies, R. I., Maciejewski, W., Hicks, E. K. S., et al. 2009, ApJ, 702, 114
- Davies et al. (2007) Davies, R. I., Müller Sánchez, F., Genzel, R., et al. 2007, ApJ, 671, 1388
- Davies et al. (2004) Davies, R. I., Tacconi, L. J., & Genzel, R. 2004, ApJ, 602, 148
- Díaz et al. (2000) Díaz, A. I., Álvarez, M. Á., Terlevich, E., et al. 2000, MNRAS, 311, 120
- Díaz-Santos et al. (2007) Díaz-Santos, T., Alonso-Herrero, A., Colina, L., Ryder, S. D., & Knapen, J. H. 2007, ApJ, 661, 149
- Fathi et al. (2006) Fathi, K., Storchi-Bergmann, T., Riffel, R. A., et al. 2006, ApJ, 641, L25
- Fathi et al. (2013) Fathi, K., Lundgren, A. A., Kohno, K., et al. 2013, ApJ, 770, L27
- Fathi et al. (2015) Fathi, K., Izumi, T., Romeo, A. B., et al. 2015, ApJ, 806, L34
- Gao & Solomon (2004a) Gao, Y., & Solomon, P. M. 2004a, ApJS, 152, 63
- Gao & Solomon (2004b) —. 2004b, ApJ, 606, 271
- García-Burillo et al. (2010) García-Burillo, S., Usero, A., Fuente, A., et al. 2010, A&A, 519, A2
- García-Burillo et al. (2014) García-Burillo, S., Combes, F., Usero, A., et al. 2014, A&A, 567, A125
- Genzel et al. (1995) Genzel, R., Weitzel, L., Tacconi-Garman, L. E., et al. 1995, ApJ, 444, 129
- Gorjian et al. (2004) Gorjian, V., Werner, M. W., Jarrett, T. H., Cole, D. M., & Ressler, M. E. 2004, ApJ, 605, 156
- Greve et al. (2009) Greve, T. R., Papadopoulos, P. P., Gao, Y., & Radford, S. J. E. 2009, ApJ, 692, 1432
- Harada et al. (2010) Harada, N., Herbst, E., & Wakelam, V. 2010, ApJ, 721, 1570
- Harada et al. (2013) Harada, N., Thompson, T. A., & Herbst, E. 2013, ApJ, 765, 108
- Henkel et al. (2014) Henkel, C., Asiri, H., Ao, Y., et al. 2014, A&A, 565, A3
- Hicks et al. (2009) Hicks, E. K. S., Davies, R. I., Malkan, M. A., et al. 2009, ApJ, 696, 448
- Hollenbach & Tielens (1999) Hollenbach, D. J., & Tielens, A. G. G. M. 1999, Reviews of Modern Physics, 71, 173
- Imanishi & Wada (2004) Imanishi, M., & Wada, K. 2004, ApJ, 617, 214
- Israel (2009) Israel, F. P. 2009, A&A, 493, 525
- Israel et al. (1995) Israel, F. P., White, G. J., & Baas, F. 1995, A&A, 302, 343
- Izumi et al. (2013) Izumi, T., Kohno, K., Martín, S., et al. 2013, PASJ, 65, 100
- Kazandjian et al. (2012) Kazandjian, M. V., Meijerink, R., Pelupessy, I., Israel, F. P., & Spaans, M. 2012, A&A, 542, A65
- Kazandjian et al. (2015) —. 2015, A&A, 574, A127
- Knapen et al. (2000) Knapen, J. H., Shlosman, I., & Peletier, R. F. 2000, ApJ, 529, 93
- Knudsen et al. (2007) Knudsen, K. K., Walter, F., Weiss, A., et al. 2007, ApJ, 666, 156
- Kohno et al. (1999) Kohno, K., Kawabe, R., & Vila-Vilaró, B. 1999, ApJ, 511, 157
- Krips et al. (2008) Krips, M., Neri, R., García-Burillo, S., et al. 2008, ApJ, 677, 262
- Krips et al. (2011) Krips, M., Martín, S., Eckart, A., et al. 2011, ApJ, 736, 37
- Kriss et al. (2000) Kriss, G. A., Peterson, B. M., Crenshaw, D. M., & Zheng, W. 2000, ApJ, 535, 58
- Laine et al. (1999) Laine, S., Kenney, J. D. P., Yun, M. S., & Gottesman, S. T. 1999, ApJ, 511, 709
- Lepp & Dalgarno (1996) Lepp, S., & Dalgarno, A. 1996, A&A, 306, L21
- Liu et al. (2014) Liu, T., Wang, J.-X., Yang, H., Zhu, F.-F., & Zhou, Y.-Y. 2014, ApJ, 783, 106
- Lonsdale et al. (2003) Lonsdale, C. J., Lonsdale, C. J., Smith, H. E., & Diamond, P. J. 2003, ApJ, 592, 804
- Lundgren et al. (2004) Lundgren, A. A., Olofsson, H., Wiklind, T., & Rydbeck, G. 2004, A&A, 422, 865
- Madejski et al. (1995) Madejski, G. M., Zdziarski, A. A., Turner, T. J., et al. 1995, ApJ, 438, 672
- Malkan et al. (1998) Malkan, M. A., Gorjian, V., & Tam, R. 1998, ApJS, 117, 25
- Maloney et al. (1996) Maloney, P. R., Hollenbach, D. J., & Tielens, A. G. G. M. 1996, ApJ, 466, 561
- Marquez & Moles (1994) Marquez, I., & Moles, M. 1994, AJ, 108, 90
- Martín et al. (2010) Martín, S., Aladro, R., Martín-Pintado, J., & Mauersberger, R. 2010, A&A, 522, A62
- Martín et al. (2009) Martín, S., Martín-Pintado, J., & Mauersberger, R. 2009, ApJ, 694, 610
- Martín et al. (2015) Martín, S., Kohno, K., Izumi, T., et al. 2015, A&A, 573, A116
- Matsushita et al. (2015) Matsushita, S., Trung, D.-V., Boone, F., et al. 2015, ApJ, 799, 26
- McMullin et al. (2007) McMullin, J. P., Waters, B., Schiebel, D., Young, W., & Golap, K. 2007, in Astronomical Society of the Pacific Conference Series, Vol. 376, Astronomical Data Analysis Software and Systems XVI, ed. R. A. Shaw, F. Hill, & D. J. Bell, 127
- Meijerink & Spaans (2005) Meijerink, R., & Spaans, M. 2005, A&A, 436, 397
- Meijerink et al. (2006) Meijerink, R., Spaans, M., & Israel, F. P. 2006, ApJ, 650, L103
- Meijerink et al. (2007) —. 2007, A&A, 461, 793
- Meijerink et al. (2011) Meijerink, R., Spaans, M., Loenen, A. F., & van der Werf, P. P. 2011, A&A, 525, A119
- Meixner et al. (1990) Meixner, M., Puchalsky, R., Blitz, L., Wright, M., & Heckman, T. 1990, ApJ, 354, 158
- Mezcua & Prieto (2014) Mezcua, M., & Prieto, M. A. 2014, ApJ, 787, 62
- Morrison & McCammon (1983) Morrison, R., & McCammon, D. 1983, ApJ, 270, 119
- Müller-Sánchez et al. (2011) Müller-Sánchez, F., Prieto, M. A., Hicks, E. K. S., et al. 2011, ApJ, 739, 69
- Nakajima et al. (2015) Nakajima, T., Takano, S., Kohno, K., et al. 2015, PASJ, 67, 8
- Nandra et al. (2000) Nandra, K., Le, T., George, I. M., et al. 2000, ApJ, 544, 734
- Orienti & Prieto (2010) Orienti, M., & Prieto, M. A. 2010, MNRAS, 401, 2599
- Osterbrock & Martel (1993) Osterbrock, D. E., & Martel, A. 1993, ApJ, 414, 552
- Panessa et al. (2006) Panessa, F., Bassani, L., Cappi, M., et al. 2006, A&A, 455, 173
- Papadopoulos & Allen (2000) Papadopoulos, P. P., & Allen, M. L. 2000, ApJ, 537, 631
- Perez-Olea & Colina (1996) Perez-Olea, D. E., & Colina, L. 1996, ApJ, 468, 191
- Peterson (1997) Peterson, B. M. 1997, An Introduction to Active Galactic Nuclei
- Peterson et al. (2004) Peterson, B. M., Ferrarese, L., Gilbert, K. M., et al. 2004, ApJ, 613, 682
- Peterson et al. (2014) Peterson, B. M., Grier, C. J., Horne, K., et al. 2014, ApJ, 795, 149
- Petrucci et al. (2004) Petrucci, P. O., Maraschi, L., Haardt, F., & Nandra, K. 2004, A&A, 413, 477
- Prieto et al. (2005) Prieto, M. A., Maciejewski, W., & Reunanen, J. 2005, AJ, 130, 1472
- Reunanen et al. (2010) Reunanen, J., Prieto, M. A., & Siebenmorgen, R. 2010, MNRAS, 402, 879
- Riechers et al. (2011) Riechers, D. A., Walter, F., Carilli, C. L., et al. 2011, ApJ, 726, 50
- Rosenberg et al. (2014a) Rosenberg, M. J. F., Kazandjian, M. V., van der Werf, P. P., et al. 2014a, A&A, 564, A126
- Rosenberg et al. (2014b) Rosenberg, M. J. F., Meijerink, R., Israel, F. P., et al. 2014b, A&A, 568, A90
- Rosenberg et al. (2015) Rosenberg, M. J. F., van der Werf, P. P., Aalto, S., et al. 2015, ApJ, 801, 72
- Sakamoto et al. (2000) Sakamoto, K., Baker, A. J., & Scoville, N. Z. 2000, ApJ, 533, 149
- Sakamoto et al. (2011) Sakamoto, K., Mao, R.-Q., Matsushita, S., et al. 2011, ApJ, 735, 19
- Salpeter (1955) Salpeter, E. E. 1955, ApJ, 121, 161
- Sanders et al. (2003) Sanders, D. B., Mazzarella, J. M., Kim, D.-C., Surace, J. A., & Soifer, B. T. 2003, AJ, 126, 1607
- Sanders et al. (1988) Sanders, D. B., Soifer, B. T., Scoville, N. Z., & Sargent, A. I. 1988, ApJ, 324, L55
- Sani et al. (2012) Sani, E., Davies, R. I., Sternberg, A., et al. 2012, MNRAS, 424, 1963
- Sault et al. (1995) Sault, R. J., Teuben, P. J., & Wright, M. C. H. 1995, in Astronomical Society of the Pacific Conference Series, Vol. 77, Astronomical Data Analysis Software and Systems IV, ed. R. A. Shaw, H. E. Payne, & J. J. E. Hayes, 433
- Schilke et al. (1997) Schilke, P., Groesbeck, T. D., Blake, G. A., Phillips, & T. G. 1997, ApJS, 108, 301
- Scott et al. (2005) Scott, J. E., Kriss, G. A., Lee, J. C., et al. 2005, ApJ, 634, 193
- Scoville et al. (2000) Scoville, N. Z., Evans, A. S., Thompson, R., et al. 2000, AJ, 119, 991
- Shankar et al. (2009) Shankar, F., Weinberg, D. H., & Miralda-Escudé, J. 2009, ApJ, 690, 20
- Soifer et al. (2003) Soifer, B. T., Bock, J. J., Marsh, K., et al. 2003, AJ, 126, 143
- Solomon & Vanden Bout (2005) Solomon, P. M., & Vanden Bout, P. A. 2005, ARA&A, 43, 677
- Takano et al. (2014) Takano, S., Nakajima, T., Kohno, K., et al. 2014, PASJ, 66, 75
- van der Tak et al. (2007) van der Tak, F. F. S., Black, J. H., Schöier, F. L., Jansen, D. J., & van Dishoeck, E. F. 2007, A&A, 468, 627
- Viti et al. (2014) Viti, S., García-Burillo, S., Fuente, A., et al. 2014, A&A, 570, A28
- Wilson et al. (1991) Wilson, A. S., Helfer, T. T., Haniff, C. A., & Ward, M. J. 1991, ApJ, 381, 79
- Zhang et al. (2014) Zhang, Z.-Y., Gao, Y., Henkel, C., et al. 2014, ApJ, 784, L31
Appendix A A. The size of an XDR
Here we estimate the size of an XDR, which is defined as the largest distance from an AGN where X-ray heating due to the AGN dominates over UV heating due to SB, by employing a toy model.
For the X-ray incident flux, we adopt a spectral shape of the form,
| (A1) |
where is a scaling constant, = eV, is a power-law index, is a cut-off energy. We set = 1.0 (e.g., Madejski et al. 1995; Peterson 1997) and = 100 keV (e.g., Madejski et al. 1995). We hereafter consider the 1-10 keV photons for simplicity. The softer X-ray can be easily absorbed at the edge of the molecular cloud and thus neglected here. Considering the situation that an AGN with = 0.1 pc and = 107 , is emitting isotropically at 3% of its Eddington luminosity at this 1-10 keV range, we scaled . Subsequent radiative transfer is calculated by adopting a 1D slab geometry with a uniform gas density of = 105 cm-3. Note that the AGN of NGC 7469 hosts a 107 black hole with the Eddington ratio of 0.3 (see also Section 1). Thus, our estimation corresponds to the case where 10% of the bolometric AGN luminosity of NGC 7469 is going into the 1-10 keV band. Then, an energy deposition rate per particle (; Maloney et al. 1996) is
| (A2) |
with an optical depth of
| (A3) |
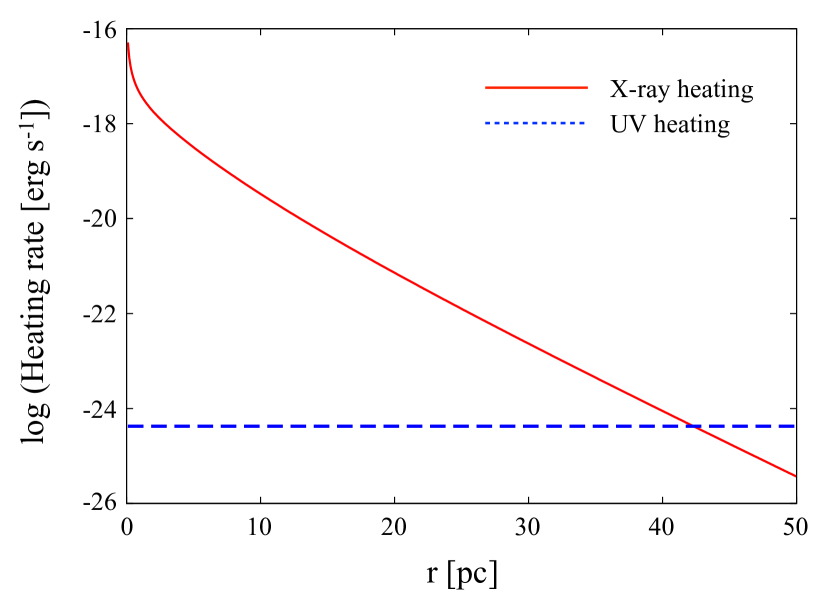
Here, we use the photoelectric absorption cross section of Morrison & McCammon (1983), which is estimated for 1-10 keV range. The attenuating hydrogen column density from the AGN to the point at the distance of pc is indicated by . Assuming the heating efficiency of X-ray photons to be 30% (e.g., Maloney et al. 1996; Meijerink & Spaans 2005), an X-ray heating rate is calculated as a function of a radius from the AGN (Figure 7). On the other hand, we adopt a typical energy of 10 eV and a cross section of 2.78 10-22 cm2 for soft-UV photons from the SB activity (Meijerink & Spaans 2005). This SB is assumed to produce a soft-UV radiation field of = 102.5 (Habing unit). Note that Rosenberg et al. (2014a, b) used this to reproduce 4 12CO emission lines (i.e., lines tracing cold molecular gas) observed in NGC 253 and Arp 299. Assuming that the UV heating efficiency is 0.3%, the heating rate due to SB-induced UV radiation is also shown in Figure 7.
Although the above estimation strongly depends on the adopted parameters and the value of is not well constrained in the circumnuclear region of Seyfert galaxies at this moment, we can roughly estimate that the size of the XDR from Figure 7, which is 42 pc in this case. This size is well smaller than the spatial resolution of our ALMA observations (150 pc).
Appendix B B. Attenuated X-ray flux
Using the Equations (A1) and (A3), we can calculate an attenuated 1-10 keV X-ray flux as a function of radius. The cases of NGC 7469 and NGC 1097 are investigated. Again we used the photoelectric absorption cross section calculated by Morrison & McCammon (1983). We adopt the same values as indicated in Appendix-A for this calculation, except for . We this time scaled by using the 2-10 keV luminosity of NGC 7469 and NGC 1097 (e.g., Liu et al. 2014), = 1.0, and assuming their AGN sizes to be = 0.1 pc. Then, the attenuated X-ray flux is shown in Figure 8.