Raleigh, NC, USA 33institutetext: Karen E. Daniels 44institutetext: Dept. of Physics, North Carolina State University
Raleigh, NC, USA
44email: kdaniel@ncsu.edu
Friction and Pressure-Dependence of Force Chain Communities in Granular Materials ††thanks: This research has been supported by the James S. McDonnell Foundation and the National Science Foundation (DMR-1206808).
Abstract
Granular materials transmit stress via a network of force chains. Despite the importance of these chains to characterizing the stress state and dynamics of the system, there is no common framework for quantifying their their properties. Recently, attention has turned to the tools of network science as a promising route to such a description. In this paper, we apply community detection techniques to numerically-generated packings of spheres over a range of interparticle friction coefficients and confining pressures. In order to extract chain-like features, we use a modularity maximization with a recently-developed geographical null model Bassett et al. (2015), and optimize the technique to detect branched structures by minimizing the normalized convex hull of the detected communities. We characterize the force chain communities by their size (number of particles), network strength (internal forces), and normalized convex hull ratio (sparseness). We find the that the first two exhibit an approximately linear correlation and are therefore largely redundant. For both pressure and interparticle friction , we observe crossovers in behavior. For , the packings exhibit more sensitivity to pressure. In addition, we identify a crossover pressure where the frictional dependence switches from having more large/strong communities at low vs. high . We explain these phenomena by comparison to the spatial distribution of communities along the vertical axis of the system. These results provide new tools for considering the mesoscale structure of a granular system and pave the way for reduced descriptions based on the force chain structure.
Keywords:
force chains network community structure numerical simulations friction1 Introduction
For more than half a century, it has been common to visualize the heterogeneous force transmission in granular materials Dantu (1957); Liu et al. (1995); Howell et al. (1999): these patterns have come to be known as force chains. It has been less clear, however, how best to provide a mesoscale description of this network of interparticle contacts. A better understanding of the important length scales over which intermediate structures are present would provide new routes to connect particle-scale properties to bulk properties. In this paper, we take the growing field of network science as our inspiration Newman (2010). Network techniques can be applied to such varied systems as social networks, neural systems, or airline route maps: anything which can be reduced to a network of nodes and the edges (links) that connect them. In the sphere packings studied here, the network is composed of a set of particles (nodes) and the normal contact force between adjacent particles (edges).
The use of network science techniques has attracted significant attention in the past few years, particularly as a way to extract the “backbone” of the most important particles in the system, and to follow the evolution of those networks under loading. By considering the entire network Bassett et al. (2015); Arévalo et al. (2010); Walker and Tordesillas (2010, 2012); Bassett et al. (2012) it is possible extract statistics about the degree of connectivity among the particles, and how that influences the bulk response.
One approach has been to define the main network based on a set of rules about how particles in a force chain should be connected. For example, Peters et al. (2005) and Zhang et al. (2013) define the backbone by setting a threshold value for contact forces and the angles between particles, while Kondic et al. (2012) use a topological invariant called the zeroth Betti number Kaczynski et al. (2004) to characterize the size of connected clusters. A disadvantage of these approaches is that thresholding strictly removes the weak interparticle contacts from consideration, even though of these forces are thought to play an important role in providing lateral stability Radjai et al. (1998). To address this issue, it is possible to use community-detection techniques Porter et al. (2009); Fortunato (2010) that allow for optimized partitioning into clusters without a hard threshold. For example, Navakas et al. (2010, 2014) and Bassett et al. (2012) identified force clusters which have stronger interparticle forces within each cluster than between them. However, the force chain communities detected in this way take the form of compact domains rather than branched networks. Therefore, they seem unlikely to be the correct mesoscale units from which to explain sound propagation Owens and Daniels (2011) (observed to be along force chains) or the changing network of contacts under flow Herrera et al. (2011) (they form a giant component of broken links).
Recently, Bassett et al. (2015) recognized that community-detection algorithms which depend on a random null model miss an important aspect of granular materials: that grains are geographically constrained to be connected only to their neighbors. By working with a null model that respects these geographic constraints, the detected communities take the form of the expected branched structures. This geographical null model, when applied to either simulated (frictionless) or laboratory (frictional) packings of disks, was able to distinguish the different force chain morphologies of the two distinct datasets.
In this paper, we adapt this technique to perform a similar community detection in simulations of 3D granular packings, and examine how these communities systematically change as a function of confining pressure and interparticle friction. By using simulations, we can test the methods in a controlled environment where it is possible to generate many independent realizations. Increasingly, such data is becoming available in 3D granular experiments Mukhopadhyay and Peixinho (2011); Saadatfar et al. (2012); Brodu et al. (2015), in the form of normal contact forces measured from the macroscopic deformations of soft particles.
The community detection method consists of two steps, modularity maximization to partition the network into clusters, and selecting a resolution parameter which controls the total number and shape of these clusters. To perform the maximization, we use the same geographic null model as in Bassett et al. (2015), allowing us to incorporate contact information. In selecting a resolution parameter, we found that the previous technique Bassett et al. (2015) was inadequate for 3D systems. Therefore, we developed a new figure of merit to quantify the degree of branching within the communities, based on the convex hull of the constituent particles.
When the process is complete, each packing is partitioned into a set of branched communities (with many interstitial communities consisting of only a few weak-force particles). We characterize the ensemble of communities by their size, strength, and degree of branching as a function of both interparticle friction and pressure. Both friction and pressure influence the network properties of force chains, and we observe crossovers as a function of both parameters.
2 Simulation Methods
We perform our numerical simulations using the discrete element model LAMMPS (Large-scale Atomic/ Molecular Massively Parallel Simulator) LAMMPS maintained by Sandia National Labs. This open-source software is based on a fast parallel algorithm Plimpton (1995) for molecular dynamics. Our simulations contain bidisperse spheres poured from above, half of diameter and half of diameter . The simulation cell has lateral dimensions (periodic boundary conditions in both directions) and height (open at the top, closed at the bottom) with gravity acting downwards. To model a hard, frictional granular material, we use a Hertzian contact model with a normal elastic constant and a tangential elastic constant . These values, when re-dimensionalized, approximately correspond to ruby spheres Chen et al. (2006) of centimetric size. We vary the interparticle friction coefficient over seven values to examine the dependence of our results on interparticle friction.
We mimic experimental protocols in which particles are poured into a box from above, and then compressed via a uniform pressure. Our numerical pouring method, adapted from Silbert et al. (2002), mimics pouring particles through a sieve (to prevent the formation of a conical heap) by generating particles at random positions at the top of the simulation volume and allowing them to fall downward under the force of gravity. We select a very low packing fraction for this insertion region, so that the resulting mean coordination number is independent of the choice of Blumenfeld et al. (2005). After inserting all particles into the container, we allow the kinetic energy to dissipate until it is less than Silbert et al. (2002).
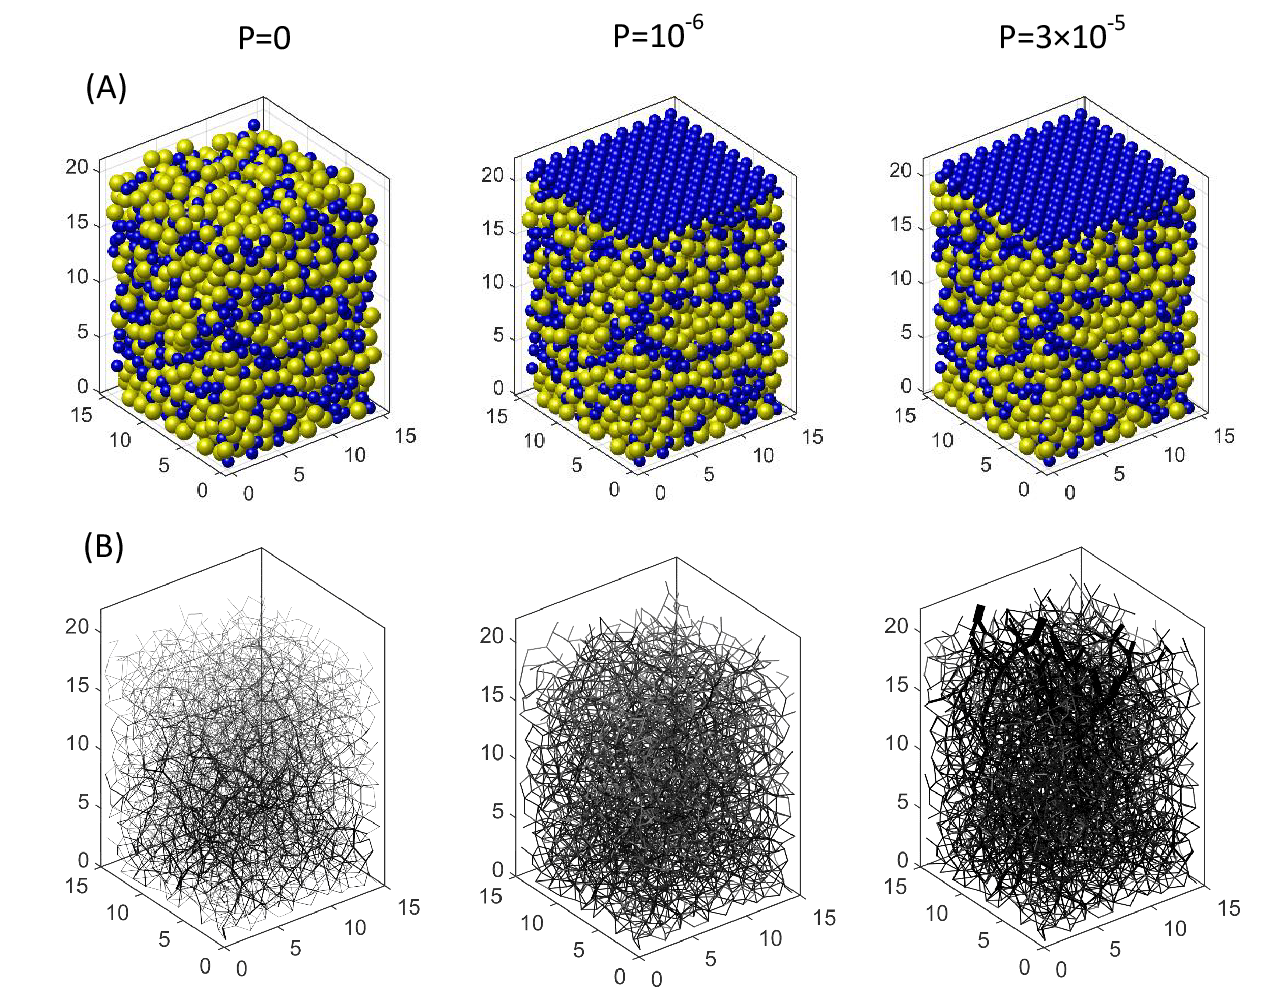
For each such initial packing, we apply pressure by generating a massless slab (size , FCC lattice, as shown in Fig. 1) at the top of the packing. From this initial state (compressed by gravity, but no additional pressure) we apply an increasing series pressures (, measured in units of ) to the upper surface of the resulting packing. The magnitude of the non-dimensionalized confining pressure is just below those reported in recent experiments on softer particles Owens and Daniels (2013). After the kinetic energy of the system has again dissipated, we record position and force measurements before iterating through all 6 pressure values. At each step, we record all particle positions and interparticle forces; sample normal force networks are shown in Fig. 1.
For each of the seven values of , we perform 20 independent simulations starting from different random initial conditions. We use a bootstrap-like process (sampling with replacement) to confirm that this is sufficient for reliable statistics. In a few places, noted within the text, the fluctuations were large enough that this criterion was not satisfied. In all of our analyses, we consider only the normal component of the interparticle forces, as is currently measured in experiments Mukhopadhyay and Peixinho (2011); Saadatfar et al. (2012); Brodu et al. (2015). This simplification also allows us to directly compare both frictionless and frictional packings.
3 Community Detection
Our goal is to partition the granular packing into communities of particles which have high interparticle forces internally (locally stiff) and low interparticle forces in their connections to other communities. We build on the work of Bassett et al. (2015, 2012), which utilizes the open source network analysis tool GenLouvain (Version 2.0) from NetWiki Jutla et al. to implement the modularity maximization method Newman (2004) of community detection.
The network analysis begins from a representation of the normal force network (Fig. 1b) as an weighted adjacency matrix . Each element is zero for particles not in contact, and for all non-zero interparticle forces (scaled by the mean normal force for the whole packing). The modularity of a network is a scalar value calculated from
| (1) |
where is a resolution parameter, is the expected weight of an edge due to a specific null model, and are the (numbered) community assignments for particle and , and is the Kronecker delta function. If particles are assigned to in the same community, then , otherwise . The optimization process adjusts the community assignments for fixed and fixed null model. As developed in Bassett et al. (2015), we utilize a physically-motivated geographic null model in which particles connect to a community through their direct neighbors:
| (2) |
We chose not to use the more common Newman-Girvan null model Newman (2004) which allows for arbitrary connections between particles Bassett et al. (2012); Navakas et al. (2010) because in 2D packings of disks, the geographic null model has been shown to successfully generate communities with chain-like morphologies Bassett et al. (2015) (rather than compact domains).
Because modularity maximization (finding the largest value of ) is an NP-hard problem, the published methods Jutla et al. use a greedy heuristic algorithm. To test the stability of this method, we run this algorithm 100 times on the same force network and find that the fluctuation of maximal value of the modularity is within 1%. In addition, we observe that the 15 largest communities consist of the same core group of particles: 70% of the same subset of particles are included in 90% of the iterations. We additionally find that fluctuations in are not accompanied by fluctuations in the morphology of the detected communities (to be quantified in §4.2).
The choice of resolution parameter controls the total number of communities identified, and also their morphology. For , optimizing favors large communities, while for small communities dominate. To select the optimal value of , we seek a figure of merit which quantifies the extent to which the detected communities take on a chain-like character: branched and sparse. We found that the technique used by Bassett et al. (2015) for 2D packings was ineffective in 3D systems. We therefore define a new figure of merit, the normalized convex hull ratio
| (3) |
where is the total volume of particles in the community and is the volume of the convex hull of the community. Branched/sparse communities will have lower values of . To calculate , we discretize each sphere as a matrix of points and determine the convex hull using the Matlab boundary function. Fig. 2 shows example convex hulls.
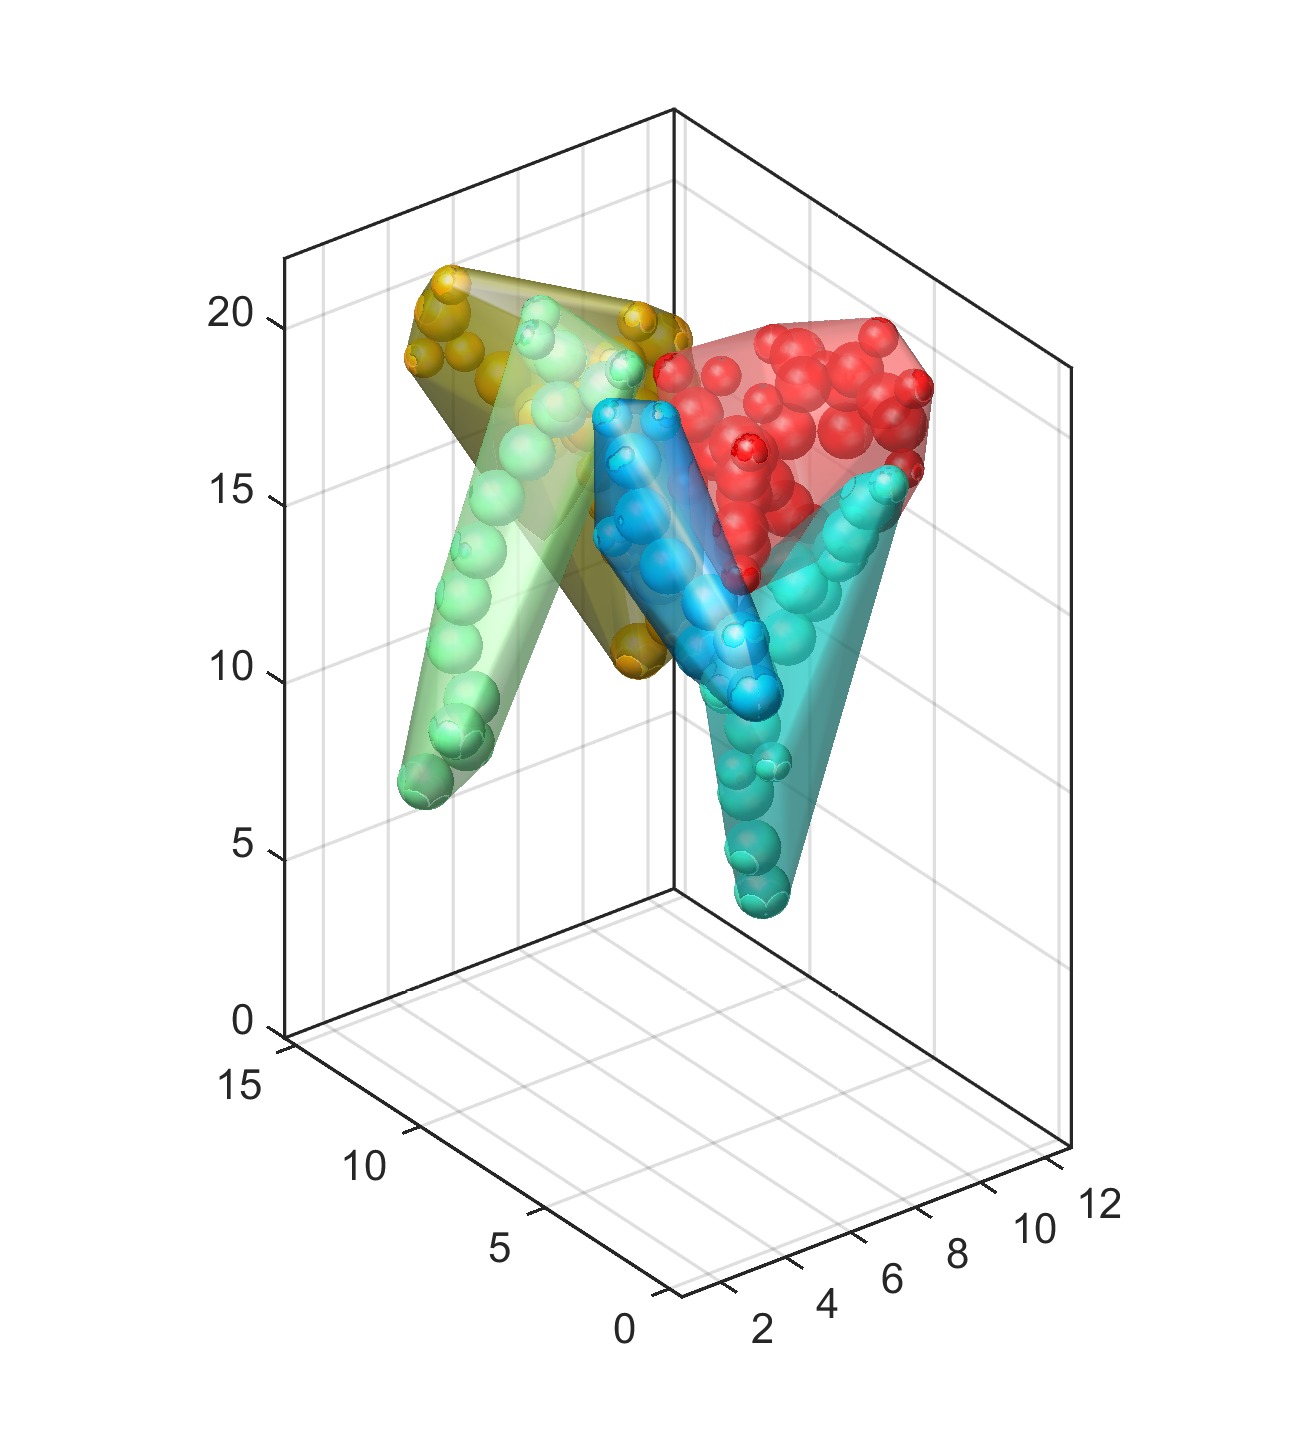
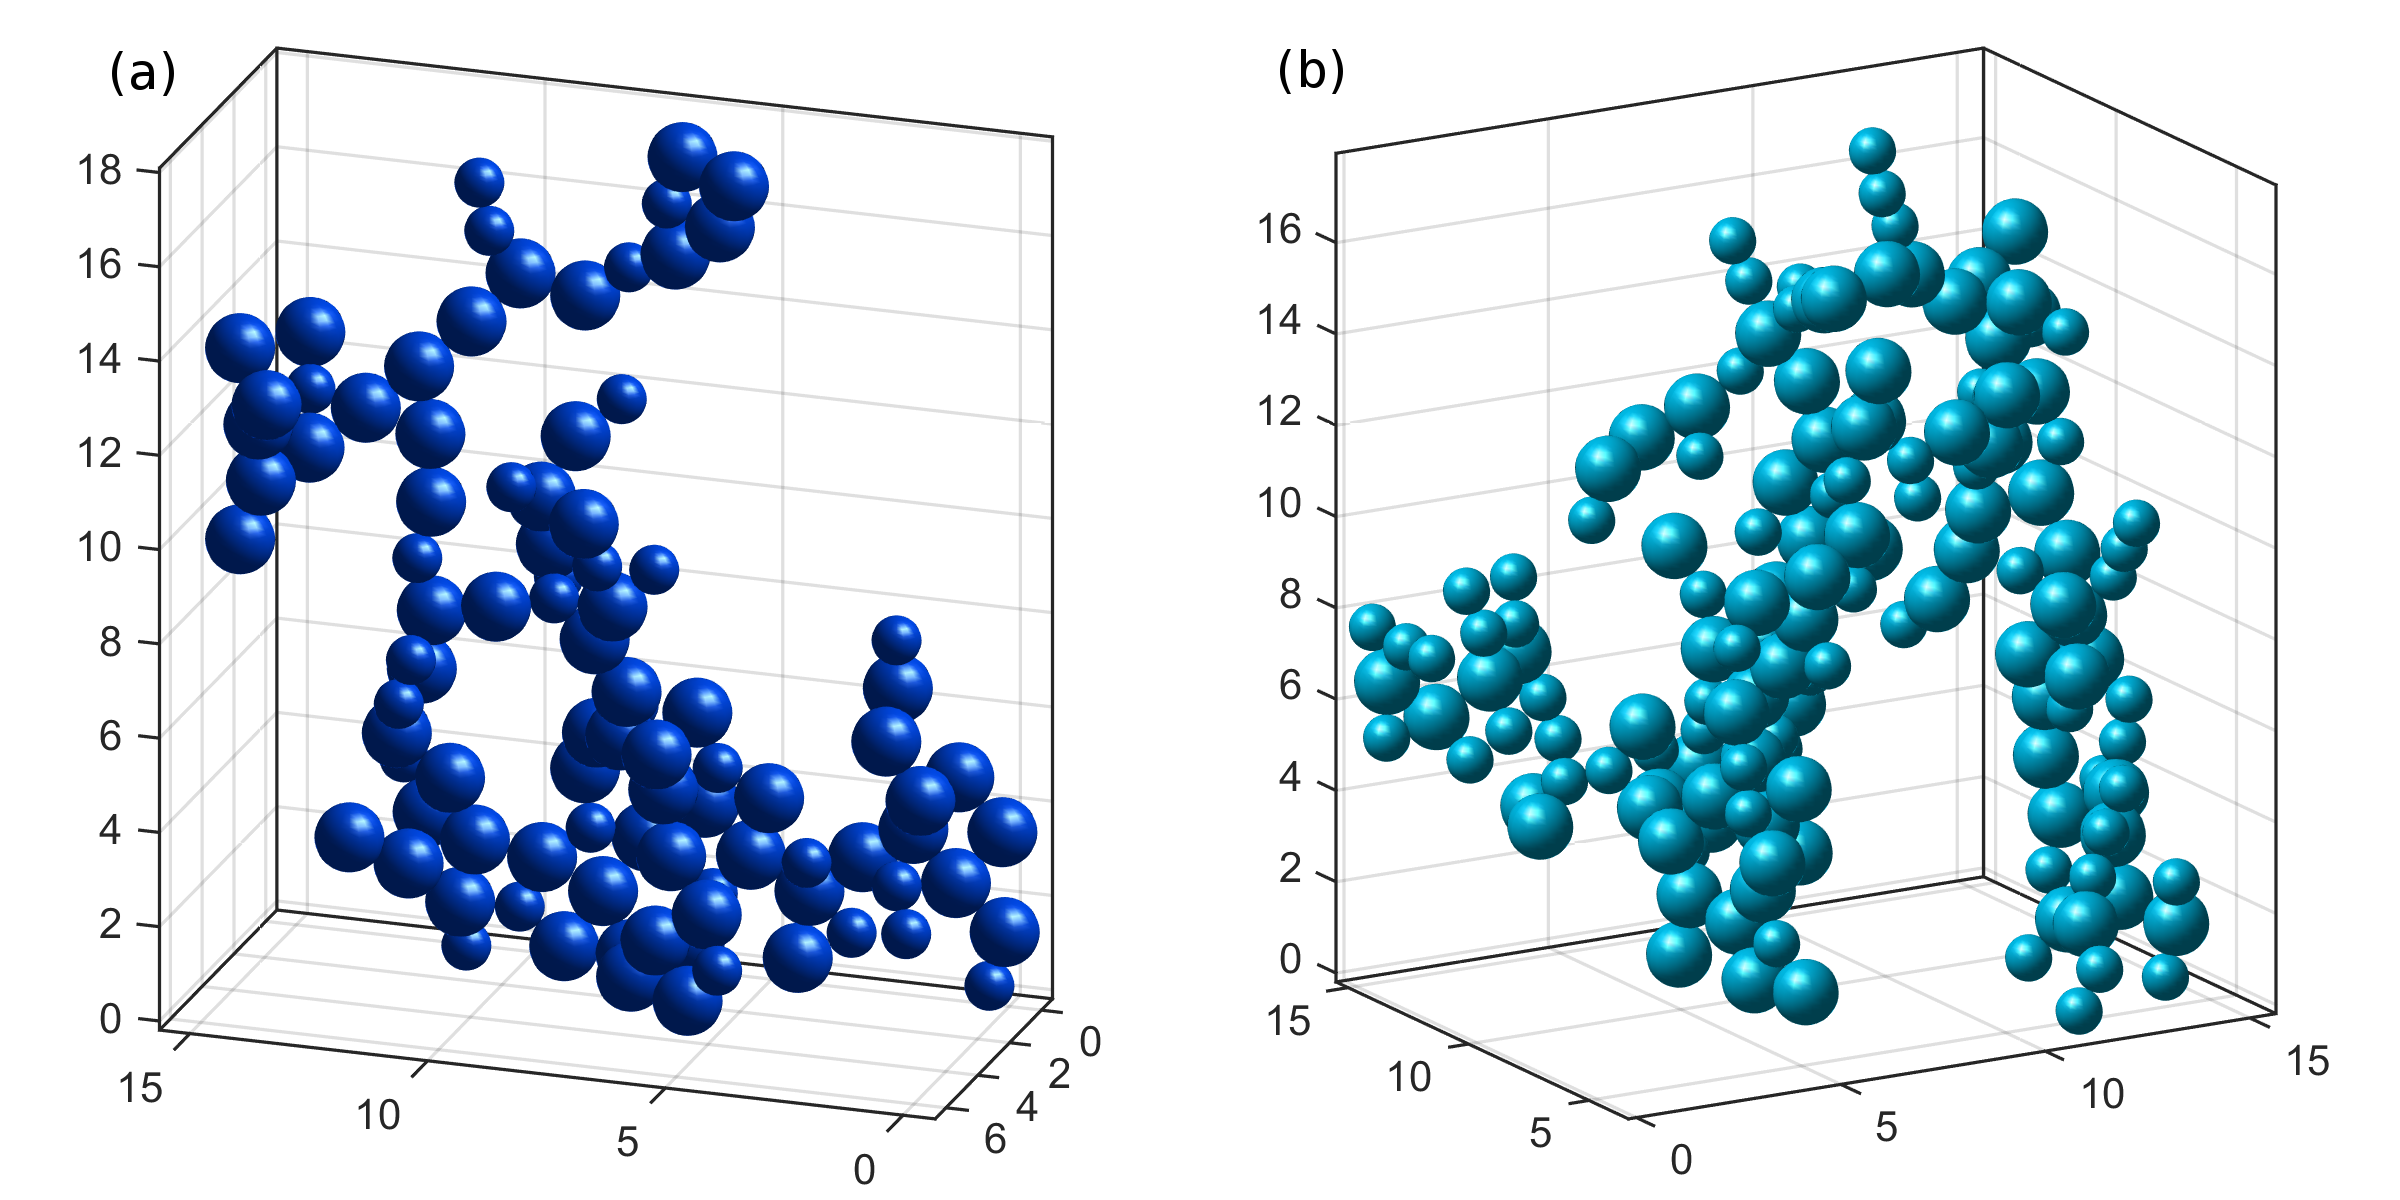
Fig. 3 shows two examples of intermediate-size communities, shown in isolation to make them more visible. Note the chain-like structures dominating the communities, providing a sparse structure with a low hull ratio. The interstices of such communities can be filled either by smaller communities, or by intercollated communities which are also branched.
For each packing, we calculate the mean hull ratio by averaging the measured weighted by the number of particles in each community, excluding communities which contain only one particle. To determine the optimal value of to use in our analysis, we measure how changes as a function of across a range of pressures. As shown in Fig. 4a, there is a clear minimum value of which is approximately consistent across different values of . In the analysis below, we utilize in all cases.
The effect of changing can be understood by examining the contribution each community makes to the modularity . The network force
| (4) |
is the contribution to (Eq. 1) from only the particles located in a particular community . Its value increases due to both the normal forces in the community being large, and from the size (number of nodes) in the community.
In Fig. 4b, the individual communities are colored by their particular network force . For small , the term dominates the sum in Eq. 1, If is small enough that is always positive, then the largest value of is obtained by putting many particles in the same community ( is nearly always 1). For larger , the null model will have more influence on the chosen communities, and the particular geometry and interparticle forces matter. If is large enough that is always negative, then the optimal is zero by letting all be zero. In that case, the optimum value of is obtained when each community contains only a single particle.
For the special case where , contact forces between particles () are directly compared with the average contact force () in the system. The modularity is increased when more particles with multiple contact forces greater than are included in communities (force chains in our sense). The choice of is similar to finding force chains by thresholding at a minimum force, often set to be . However, in contrast with thresholding methods, the modularity maximization method is flexible rather than binary.
4 Results
Using these community detection methods, we describe how the force chain network changes as a result of both interparticle friction and confining pressure . For each community, we consider three properties: the community size , the network force (community strength), and the hull ratio (community morphology). In all cases, community-detection is performed at fixed resolution parameter , chosen as a compromise value for the whole parameter regime.
4.1 Community Size and Strength
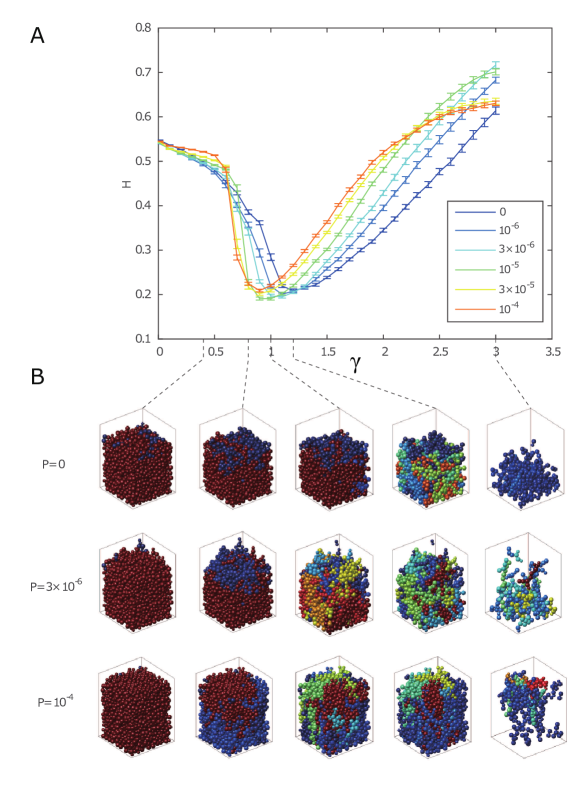
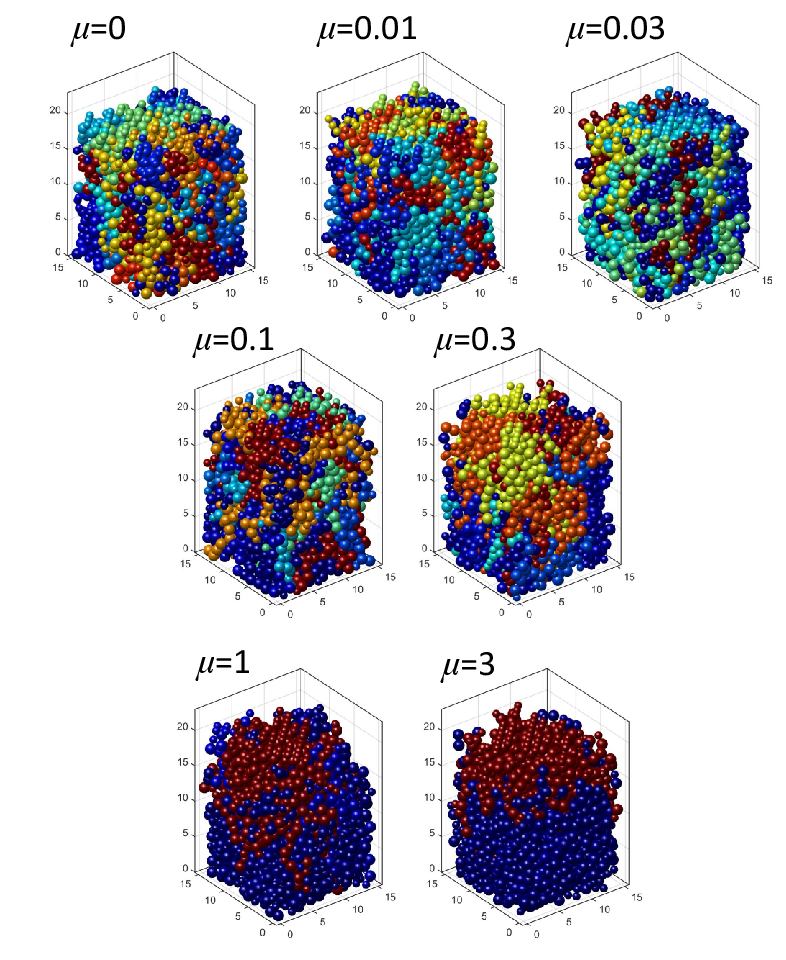
To illustrate the methods, we first examine the set of 20 configurations with . In Fig. 5, sample community assignments are shown for all seven values. At low values of (top row), small communities dominate, while at large values of , there is typically a single large community near the top and many smaller and weaker communities at the bottom. (The multiple low- communities all have similar values of and thereby appear to be the same community (by color) although they are not.) This observation is similar to prior work on the effect of friction coefficient on jamming properties of packings Silbert (2010) in which the bulk packing fraction and coordination number gradually decrease as increases from 0 and they saturate when is larger than 1. This saturation is also reflected in the cumulative distribution figures we examine below.
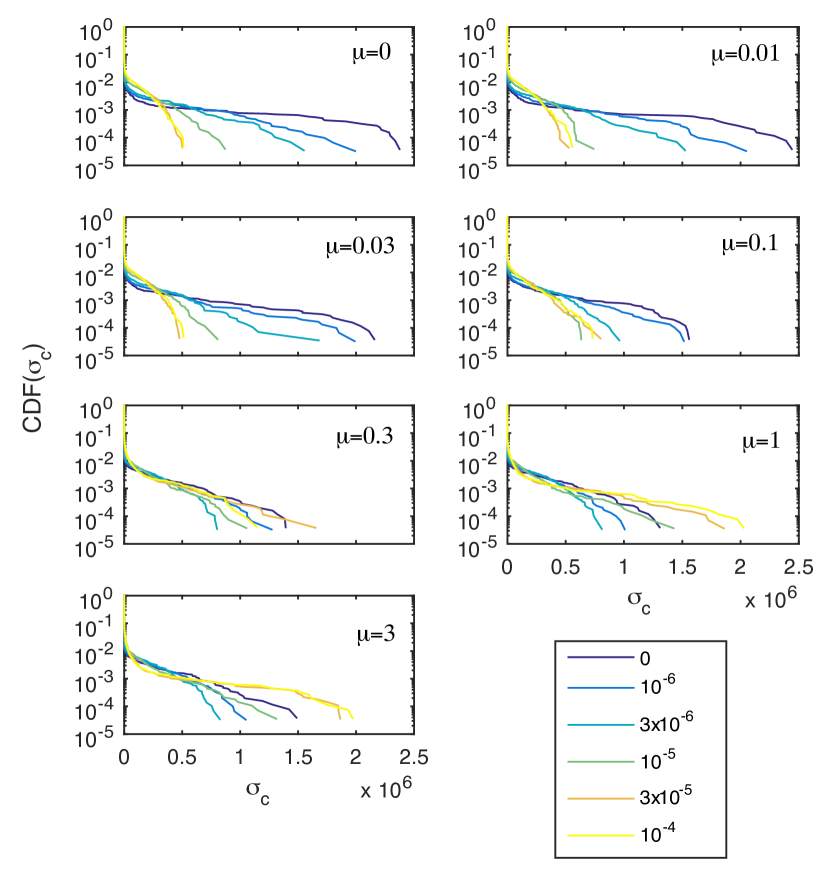
As shown in Fig. 6, we observe that and obey an approximately linear relationship. We examine their relationship under all and settings and find the same approximate relationship. (Since the mean pressure was already normalized in writing the weighted adjacency matrix , we do not expect a trend in the magnitude of .)
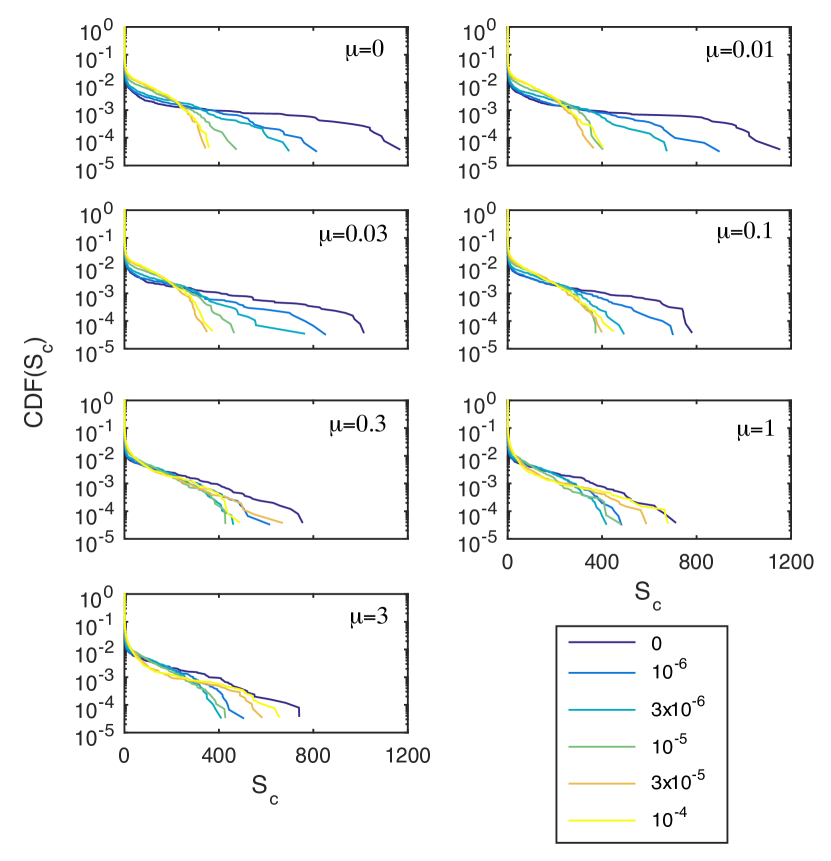
4.1.1 Friction-Dependence
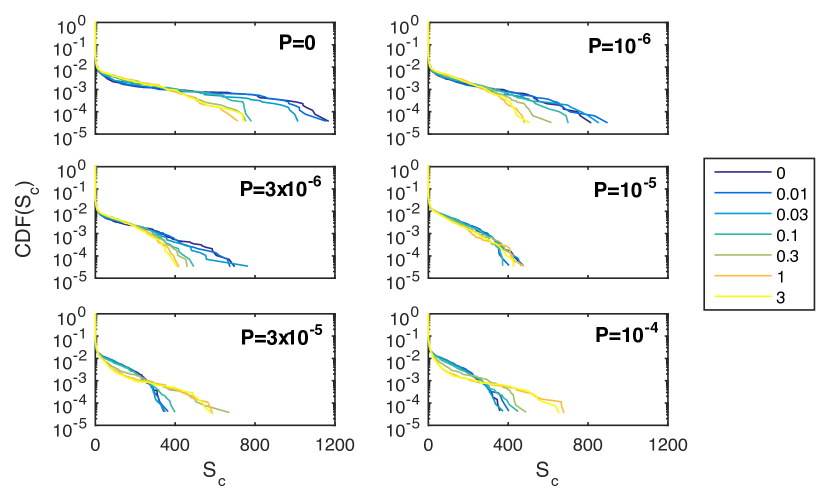
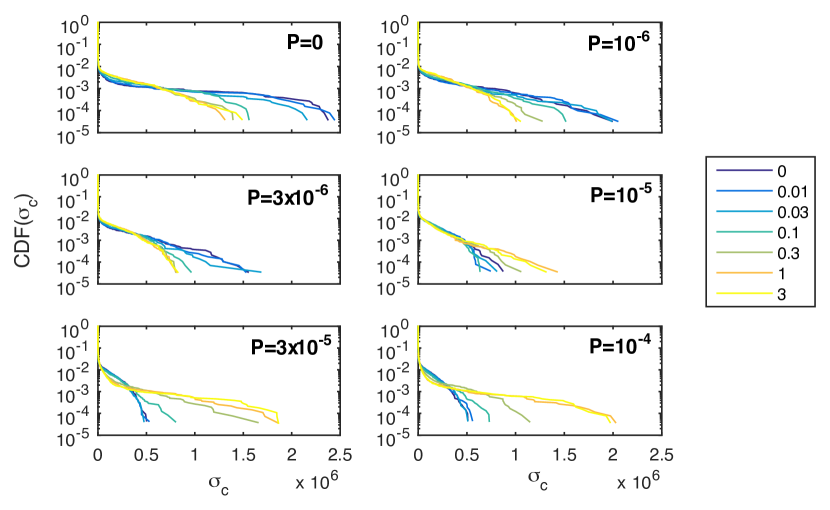
To understand the friction-dependence, we consider the cumulative distribution function (CDF) of both and network force as a function of at fixed . As shown in Figs. 7 and 8, both quantities show similar behavior, as expected given the strong correlation show in Fig. 6. For large , we observe an approximately exponential distribution. Remarkably, the steepness of the distribution as a function of has opposite trends at low and high pressure: For , the CDF steepens as increases (fewer large/strong communities), while for , the CDF instead steepens as decreases. Thus, represents a crossover value between two distinct behaviors. Below, we will explore how the heterogeneity of forces (shown illustratively in Fig. 5) causes this effect.
4.1.2 Pressure-Dependence
Fig. 9 and 10 show the same CDF data, rearranged to highlight -dependence at fixed . This configuration highlights the existence of a low-friction regime distinct from the frictional regime, with a transition near . For , the CDFs become much steeper as is increased. This indicates that the system’s forces are becoming more homogeneous at high pressure, as expected Makse et al. (2000); Zhang and Makse (2005). In contrast, simulations performed at (the frictional regime) show only weak pressure-dependence, with the large- tails fluctuating. This may be due either to insufficient statistics, or to changes in the heterogeneity of the system, to be discussed in the next section.
These CDFs of and are similar to those observed in a previous study of force chains in 2D systems Bassett et al. (2015) using a similar community-detection technique. There, the community size distribution was also exponential, and here we found that the network force was exponential as well. In addition, both studies saw that communities are more compact at high pressure. This pressure-dependence is in contrast to the work of Navakas et al. (2010), in which it was observed that community size increases as pressure increases. A key distinction between the two studies is the choice of null model: they used the standard Newman-Girvan null model Newman and Girvan (2004); Newman (2004) rather than a geometric null model Bassett et al. (2015), resulting in domain-like communities.
4.1.3 Network Homogeneity
We have observed that there is a crossover in community size and strength for both pressure () and friction (), and that this effect appears to be connected to the homogeneity of the force network. To examine this in more detail, we consider the vertical gradient in the community size and its relationship to the relative importance of horizontal vs. vertical forces.
Fig. 11 shows the spatial distribution of average community size as a function of the vertical position within the sample, for each pair of parameters. Averages are calculated on the particle-scale: within horizontal slice of thickness , we average the of all particles whose centers are within that bin. We observe that the plots fall into three distinct types: negative slope (colored red, largest communities at the bottom), an almost vertical distribution (colored yellow, community size evenly distributed), and positive slope (colored blue, largest communities at the top). As expected from Fig. 6, the corresponding plot for is very similar (not shown).
Note that the most homogeneous communities approximately correspond to the crossover visible in Fig. 7, suggesting that spatial gradients are important. For , the largest pressures used were able to reverse the gradient, moving the largest gradients from the bottom to the top of the packing. Note that these two kinds of gradients distinguish the similar-width distributions at and in Fig. 9 when . This non-monotonic dependence of heterogeneity on pressure was unexpected.
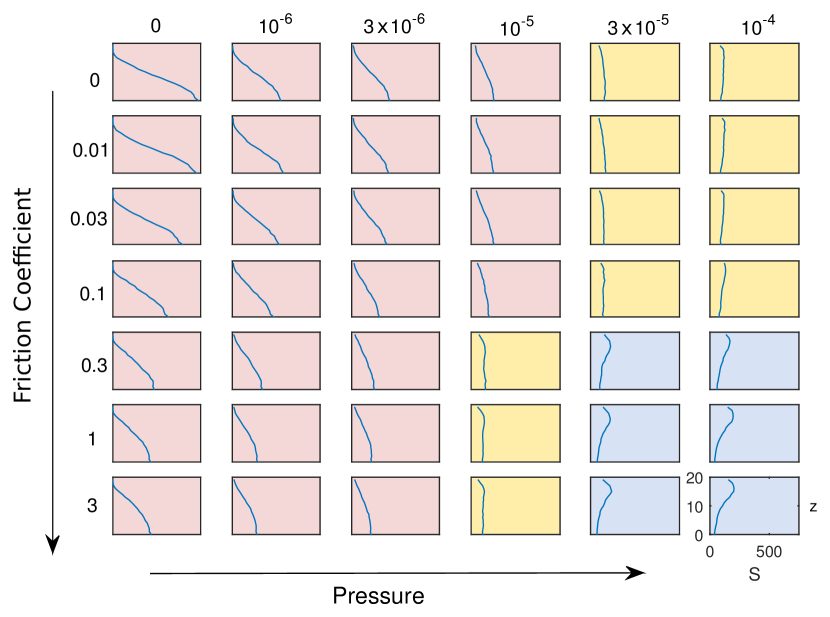
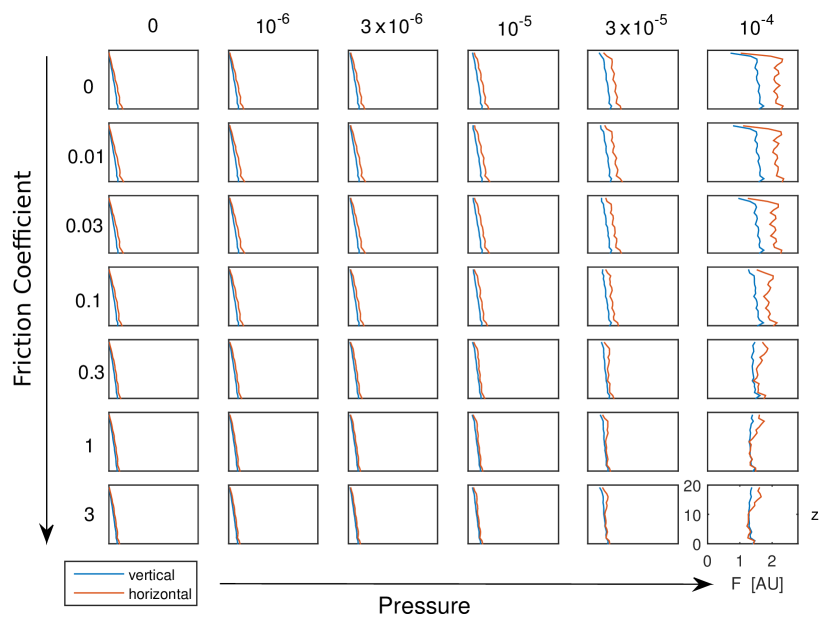
To understand how this effect arises, we consider the relative importance of horizontal and vertical normal interparticle forces as a function of . As done for , we calculate the particle-scale average of the horizontal and vertical components of the vector normal force . As shown in Fig. 12, the interparticle forces mostly increase with depth, as would be expected for gravitational loading. (Due to the periodic boundary conditions in the lateral direction, the forces cannot saturate due to the Janssen effect Janssen (1895).) This gravitation-loading regime approximately corresponds with the red-shaded plots in Fig. 11, and is also visible in the middle column of Fig. 4b, where a big, strong community forms at the bottom part of the packing. In contrast, for the forces are more spatially homogeneous; similar effects have been seen by Makse et al. Makse et al. (2000); Zhang and Makse (2005). For high and (the blue-shaded plots), the vertical forces first become more uniform with depth, but eventually develop a force-excess at the top of the packing. This high-force region corresponds to the large communities shown in the bottom row of Fig. 6. Between these two extreme cases, there is a regime in which the community-size distributions are quite homogeneous (the yellow-shaded plots in Fig. 11). This regime does not precisely correspond with the most homogeneous force distributions shown in Fig. 12, suggesting that community-detection is sensitive to small changes in the interparticle forces.
4.2 Community Morphology
While visual inspection of force chain morphology is possible in 2D systems, it is harder to observe such changes within 3D systems (see Fig. 1). Therefore, a key benefit of using the geographical null model (Eq. 2) to detect the communities of particles which form the backbone of the system is to provide a way to quantify changes in the force chain network. The hull ratio (Eq. 3) measures the degree to which the communities are sparse/branched. In this section, we characterize how changes as a function of and . As shown in Fig. 13, we observe that the largest communities are also the most branched (low ). An exception to this trend occurs when a large, strong community forms at the top of packing (the blue-shaded plots in Fig. 11).
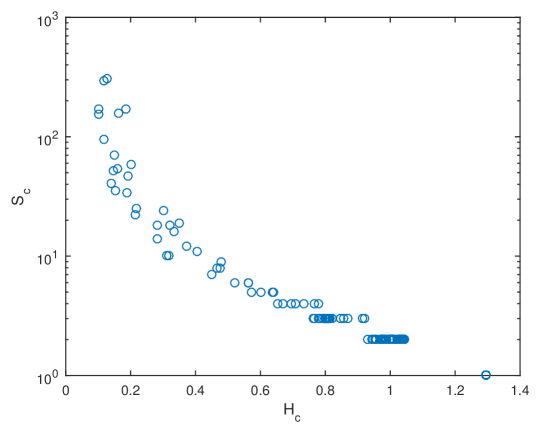
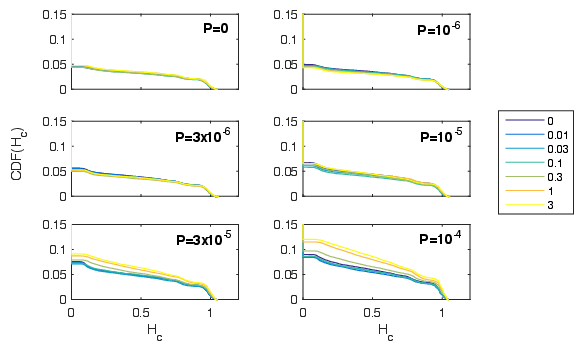
Fig. 14 shows the cumulative distributions of hull ratio , organized by pressure. Because of the communities contain only a single particle, these communities are not shown on the plots and have been excluded from calculations of average hull ratio (including in Fig. 4). For , we observe that the cumulative distributions are sensitive to ; below , they are -independent. In the -dependent regime, we see that larger frictional forces contribute to finding more chain-like communities (low ). Conversely, it is also true that for high , the CDF of is more sensitive to . This is consistent with studies in two dimensions Bassett et al. (2015), where the community shape for a frictionless packing was less sensitive to pressure than in frictional packings.
5 Conclusions
In this paper, we have shown that community detection methods can be successfully applied to 3D granular materials. We define a new quantity, the hull ratio, which characterizes the degree of branching within a community. This quantity allows us to optimize the community detection process by identifying a resolution () where we detect the most-branched features of the system. This resolution is in approximate agreement with observations in 2D granular systems Bassett et al. (2015), and is sensible given the normalization of the weighted adjacency matrix .
For packings generated over a range of interparticle friction and pressure , we characterize the detected communities in terms their size, strength, and hull ratio. The first two are found to be largely redundant, and all three depend on and . We find that, as in 2D systems Bassett et al. (2015), the size and strength exhibit approximately exponential distributions. Using these measures, we observe that there is a crossover in community size and strength for both the pressure () and friction (). In addition, this effect appears to be connected to the homogeneity of the force network.
It is our hope that this technique will prove useful for investigating the statistical properties of force chain networks, by identifying the most important communities of particles. While we have not included tangential forces in this study, including will likely be necessary for addressing questions of mechanical stability.
Acknowledgements.
We are grateful for support from the National Science Foundation (DMR-1206808) and the James S. McDonnell Foundation. The simulations were performed at the NC State High Performance Computing Center. We are grateful to Leo Silbert, Danielle Bassett, and Mason Porter for valuable conversations.References
- Bassett et al. (2015) D. S. Bassett, E. T. Owens, M. A. Porter, M. L. Manning, and K. E. Daniels. Extraction of force-chain network architecture in granular materials using community detection. Soft Matter, 11:2731–2744, 2015.
- Dantu (1957) P. Dantu. Contribution l’étude méchanique et géométrique des milieux pulvérulents. In Proceedings of the Fourth International Conference on Soil Mechanics and Foundation Engineering, London, pages 144–148, 1957.
- Liu et al. (1995) C. H. Liu, S. R. Nagel, D. A. Schecter, S. N. Coppersmith, S. Majumdar, O. Narayan, and T. A. Witten. Force fluctuations in bead packs. Science, 269:513–5, 1995.
- Howell et al. (1999) D. Howell, R. P. Behringer, and C. Veje. Stress Fluctuations in a 2D Granular Couette Experiment: A Continuous Transition. Physical Review Letters, 82:5241–5244, 1999.
- Newman (2010) M. E. Newman. Networks: An Introduction. Oxford University Press, 2010.
- Arévalo et al. (2010) R. Arévalo, I. Zuriguel, and D. Maza. Topology of the force network in the jamming transition of an isotropically compressed granular packing. Physical Review E, 81:041302, 2010.
- Walker and Tordesillas (2010) D. M. Walker and A. Tordesillas. Topological evolution in dense granular materials: A complex networks perspective. International Journal of Solids and Structures, 47:624–639, 2010.
- Walker and Tordesillas (2012) D. Walker and A. Tordesillas. Taxonomy of granular rheology from grain property networks. Physical Review E, 85:011304, 2012.
- Bassett et al. (2012) D. S. Bassett, E. T. Owens, K. E. Daniels, and M. A. Porter. Influence of network topology on sound propagation in granular materials. Physical Review E, 86:041306, 2012.
- Peters et al. (2005) J. Peters, M. Muthuswamy, J. Wibowo, and A. Tordesillas. Characterization of force chains in granular material. Physical Review E, 72:041307, 2005.
- Zhang et al. (2013) L. Zhang, J.-Q. Wu, and J. Zhang. Force-chain identification in quasi-2D granular systems. AIP Conference Proceedings, Powders and Grains 2013, 397:397–400, 2013.
- Kondic et al. (2012) L. Kondic, A. Goullet, C. S. O’Hern, M. Kramar, K. Mischaikow, and R. P. Behringer. Topology of force networks in compressed granular media. Europhysics Letters, 97:54001, 2012.
- Kaczynski et al. (2004) T. Kaczynski, K. M. Mischaikow, and M. Mrozek. Computational Homology, volume 157. Springer Science & Business Media, 2004.
- Radjai et al. (1998) F. Radjai, D. Wolf, M. Jean, and J.-J. Moreau. Bimodal Character of Stress Transmission in Granular Packings. Physical Review Letters, 80:61–64, 1998.
- Porter et al. (2009) M. A. Porter, J.-P. Onnela, and P. J. Mucha. Communities in Networks. Notices of the American Mathematical Society, 56:1082, February 2009.
- Fortunato (2010) S. Fortunato. Community detection in graphs. Physics Reports, 486:103, 2010.
- Navakas et al. (2010) R. Navakas, A. Džiugys, and B. Peters. Application of graph community detection algorithms for identification of force clusters in squeezed granular packs. Modern Building Materials, Structures and Techniques, pages 1–4, 2010.
- Navakas et al. (2014) R. Navakas, A. Džiugys, and B. Peters. A community-detection based approach to identification of inhomogeneities in granular matter. Physica A: Statistical Mechanics and its Applications, 407:312–331, 2014.
- Owens and Daniels (2011) E. T. Owens and K. E. Daniels. Sound propagation and force chains in granular materials. Europhysics Letters, 94:54005, 2011.
- Herrera et al. (2011) M. Herrera, S. McCarthy, S. Slotterback, E. Cephas, W. Losert, and M. Girvan. Path to fracture in granular flows: Dynamics of contact networks. Physical Review E, 83:061303, 2011.
- Mukhopadhyay and Peixinho (2011) S. Mukhopadhyay and J. Peixinho. Packings of deformable spheres. Physical Review E, 84:011302, 2011.
- Saadatfar et al. (2012) M. Saadatfar, A. P. Sheppard, T. J. Senden, and A. J. Kabla. Mapping forces in a 3D elastic assembly of grains. Journal of the Mechanics and Physics of Solids, 60:55–66, 2012.
- Brodu et al. (2015) N. Brodu, J. A. Dijksman, and R. P. Behringer. Spanning the scales of granular materials through microscopic force imaging. Nature Communications, 6:6361, 2015.
- (24) LAMMPS. http://lammps.sandia.gov.
- Plimpton (1995) S. Plimpton. Fast Parallel Algorithms for Short-Range Molecular Dynamics. Journal of Computational Physics, 117:1–19, 1995.
- Chen et al. (2006) Y. Chen, A. Best, H.-J. Butt, R. Boehler, T. Haschke, and W. Wiechert. Pressure distribution in a mechanical microcontact. Applied Physics Letters, 88:20–23, 2006.
- Silbert et al. (2002) L. Silbert, D. Ertas, G. Grest, T. Halsey, and D. Levine. Geometry of frictionless and frictional sphere packings. Physical Review E, 65:031304, 2002.
- Blumenfeld et al. (2005) R. Blumenfeld, S. F. Edwards, and R. C. Ball. Granular Matter and the Marginal Rigidity State. Journal Of Physics: Condensed Matter, 17:11, 2005.
- Owens and Daniels (2013) E. T. Owens and K. E. Daniels. Acoustic measurement of a granular density of modes. Soft Matter, 9:1214–1219, 2013.
- (30) I. S. Jutla, L. G. S Jeub, and P. J Mucha. A generalized Louvain method for community detection implemented in MATLAB. URL http://netwiki.amath.unc.edu/GenLouvain.
- Newman (2004) M. Newman. Fast algorithm for detecting community structure in networks. Physical Review E, 69:066133, 2004.
- Silbert (2010) L. E. Silbert. Jamming of frictional spheres and random loose packing. Soft Matter, 6:2918, 2010.
- Makse et al. (2000) H. A. Makse, D. L. Johnson, and L. M. Schwartz. Packing of Compressible Granular Materials. Physical Review Letters, 84:4160–4163, 2000.
- Zhang and Makse (2005) H. P. Zhang and H. A. Makse. Jamming transition in emulsions and granular materials. Physical Review E, 72:11301, 2005.
- Newman and Girvan (2004) M. Newman and M. Girvan. Finding and evaluating community structure in networks. Physical Review E, 69:026113, 2004.
- Janssen (1895) H A Janssen. Versuche über Getreidedruck in Silozellen. Zeitschr. d. Vereines deutscher Ingenieure, 39:1045–1049, 1895.