Quantifying the quality of peer reviewers through Zipf’s law
- : ma683@le.ac.uk
2eHumanities group111Associate Researcher ,
Royal Netherlands Academy of Arts and Sciences (NKVA),
Joan Muyskenweg 25, 1096 CJ Amsterdam, The Netherlands
3GRAPES222Group of Researchers for Applications of Physics in Economy and Sociology , rue de la Belle Jardiniere 483,
B-4031, Angleur, Belgium
- : marcel.ausloos@ulg.ac.be
4 Institute for the Application of Nuclear Energy (INEP), University of Belgrade, Banatska 31b, Belgrade-Zemun, Serbia
- : olgica@inep.co.rs
5 Faculty of Physics, Warsaw University of Technology,
Koszykowa 75, PL-00-662, Warsaw, Poland
() - : agatka@if.pw.edu.pl
( - : fronczak@if.pw.edu.pl )
Abstract
This paper introduces a statistical and other analysis of peer reviewers in order to approach their ”quality” through some quantification measure, thereby leading to some quality metrics. Peer reviewer reports for the Journal of the Serbian Chemical Society are examined. The text of each report has first to be adapted to word counting software in order to avoid jargon inducing confusion when searching for the word frequency: e.g. C must be distinguished, depending if it means Carbon or Celsius, etc. Thus, every report has to be carefully ”rewritten”. Thereafter, the quantity, variety and distribution of words are examined in each report and compared to the whole set. Two separate months, according when reports came in, are distinguished to observe any possible hidden spurious effects. Coherence is found. An empirical distribution is searched for through a Zipf-Pareto rank-size law. It is observed that peer review reports are very far from usual texts in this respect. Deviations from the usual (first) Zipf’s law are discussed. A theoretical suggestion for the ”best (or worst) report” and by extension ”good (or bad) reviewer”, within this context, is provided from an entropy argument, through the concept of ”distance to average” behavior. Another entropy-based measure also allows to measure the journal reviews (whence reviewers) for further comparison with other journals through their own reviewer reports.
Keywords: peer review, Zipf’s law, rank-size rule, entropic distance
1 Introduction
Peer review is posing many problems. How do behave reviewers? What characterizes good or bad reviewers, good or bad reviews, not only from technical or scientific points of view, but also considering its linguistic, form and content, features.
We dare to claim that the work of reviewers is often not appreciated enough, but it deserves much more attention as it enables: (i) proper valorization of new results, (ii) recognition of new versus already published results, (iii) recognition of unreliable and even false data, (iv) recognition of plagiarism and misconduct, (v) professional and public alert in the case of very good or very bad results, experimental design, ethical approach, etc.
Despite a variety of criticisms (Wager and Jefferson 2001), the importance of the peer review process in maintaining and improving the quality of submissions has been widely acknowledged. More than 80 percent of surveyed academics agreed that journal peer review greatly helps scientific communication (PRC 2008). Nevertheless, there appears to be little agreement about how to measure its quality and effectiveness.
Typical methods proposed in the literature include: (i) surveys among the editors or among the authors whose work had been reviewed (Justice 1998, McNutt 1990, van Rooyen et al. 1999), (ii) measuring agreement among reviewers (Oxman 1991, Strayhorn 1993) or between reviewers and editors (Callaham 1998), (iii) measuring the number of errors that a review detected (Godlee et al. 1998) and finally (iv) measuring the speed of review (Jadad et al. 1998, Feurer et al. 1994, Neuhauser and Koran 1989). The other group of methods assess the quality of reviews indirectly, by analysing the manuscripts undergoing evaluation, e.g. (v) comparing the manuscript quality before and after peer review (Goodman et al. 1994), or (vi) tracking the popularity of rejected (and published elsewhere) and accepted manuscripts (Siler et al. 2015).
Among all feasible quantitative measures of reviews’ (whence reviewers’) quality, the most valuable are those based on objective criteria, e.g. on bibliometric indicators. On the other hand, measuring comprehensibility, soundness or informational content of a report can hardly be done without introducing a bias, due to individual opinions of the survey respondents (editors or authors) on how a good report should look like (Bornmann 2011).
In the present paper, we would like to start a discussion on a possible measure that would allow to quantitatively and objectively assess the quality of the linguistic and informational content of a report.
We will start from a rather trivial and well-known fact that language requires a diversity of words to convey a wide range of information. Regarding reviews, one can think that reviewers which use many different words are those who deal with the manuscript from more different aspects than those who use ”less rich” vocabulary. Maybe these reviewers make more effort to offer authors clearer explanations or even suggest a direction for correction. Moreover, the authors of work being evaluated often want that the referees use a larger, more precise, vocabulary to improve comprehension in view of removing ambiguities. On the other hand, long reports do not always (or necessarily) provide a large amount of information. They could just contain repetitive, rephrased statements. That is why only the length of a review is not a good measure of its informational content.
In this context, we would like to recall that Zipf (Zipf 1949) formulated an algorithm (the so-called Zipf’s law) that allows the evaluation and quantification of deviation between diversity and redundancy of different texts. Zipf’s law is based on the Principle of Least Effort, which proposes that there must be a balance between unification and diversity in a language, such that the number of elements should neither be so highly repetitive that the communication would be too simple, nor so heterogeneous that there would be too many possible combinations making communication unclear and convoluted.
Therefore, since an efficient review should be the one that expresses an appropriate balance between diversity and redundancy (neither too diverse nor too repetitive), we have applied Zipf’s law to estimate the quality of reviews with respect to their informational content. Other metrics could be used (Ausloos 2012a, Ausloos 2012b, Darooneh and Shariati 2014, Febres and Jaffe 2014, Rodriguez et al. 2014, Dubois 2014), but we restrict ourselves to the Zipf approach.
Zipf’s law states that the frequency of a word in the text is inversely proportional to its rank in the frequency table (Hill 2004). For example, the most frequent word is used twice as much as the second most frequent word and three times more often than the third most frequent word. Zipf’s law is formally written
| (1.1) |
where is the frequency of occurrence of the -th ranked item and the parameter, which is usually close to , is estimated from the slope of the resulting straight line that the word data follows on a log-log scatter plot. A steeper line, (a more negative slope), represents a smaller, more repetitive vocabulary that may be too restrictive to efficiently convey information in the text. On the other hand, a flatter line, , represents a more diverse vocabulary.
The deviations of the exponent values have been reported in many different contexts, e.g. in different forms of schizophrenia patients (Ferrer i Cancho 2006) and in children language (McCowan et al. 2002), or in scientific texts (Fairthorne 1969, Ausloos 2013, Miskiewicz 2013, Bougrine 2014). Although, only a few papers are quoted here in order to pin point a few research aspects in the field, but many more exist, none seems to be devoted to the analysis of the aspect of peer-review intending to quantify the peer reviewer writings, in a simple way, at first, as this article proposes. Necessarily, conclusions are to be discussed, whence later on improved, as any of open stage papers.
At the moment we cannot tell how can certain numbers obtained by us for specific reports be scientifically interpreted, but it seems that this part of the peer-review process can be subjected to quantification. Yet, another aspect of peer-review quantification may emerge, as peer-reviewers, becoming aware that their reports are being ”evaluated” along quantitative lines, may become more ”serious” and/or ”professional” when reviewing. Finally, in the light of the general quantifying trend in science, perhaps one day the quality of the peer-review activity may be evaluated and expressed by numbers.
The paper is organized as follows:
In Section 2, the methodology is presented: (i) data acquisition, containing some information on the data origin (Section 2.1); (ii) demonstratoin that a necessary data refinement for adaptation to available word counting softwares (Section 2.2). Thereafter, a coherent data analysis of the various cases provided for the illustration, with the assessment of some rank-size rule fits, is performed in Section 3. It will be observed and emphasized that peer review reports are far from usual literary texts.
Section 4 is devoted to a subsequent analysis of the investigation: within this data and following such results, an attempt is made to differentiate reports from reviewers. This is also made, when possible, i.e. in a few cases, by searching for similarities about reviewers having written reports for different papers.
A thought on entropy consideration to measure reports and reviewers through some so called ”distance” notion is presented in Sect. 5, in order to suggest some useful (”universal”) metrics.
Section 6 allows us to conclude that each report definitely depends on the reviewer, but not especially on the paper content. We offer suggestions for further research lines.
2 Methodology
2.1 Data Acquisition
At first, it is recognized that it is not easy to obtain raw data, even if anonymity is strictly enforced! However, one sub-editor of a section of the Journal of the Serbian Chemical Society (JSCS) has provided us with about 100 among the latest reports arrived in the fall 2014, about papers submitted to the Biochemistry and Biotechnology section of the JSCS. In this data, the names of the referees have been anonymized and replaced by numbers, letters and symbols.
Two sets of reports have been examined: (i) for September and (ii) for October 2014. For September, ten reports , with , were selected: the last 10 which arrived. They correspond to various reviewers () and topics, and to six different papers (): paper was reviewed in , , and ; paper in ; paper in and ; paper in and ; paper in , and paper in .
Except for and having had one common reviewer (the fact that was not known at the beginning of the study), all others had different reviewers.
Ten other reports, , with , were chosen for October 2014. This number was chosen to be equivalent to that of the first set for statistical purposes. The October selection was made out of 100 reports. Due to this large number of reviews, a word scale effect, with both longer and shorter reports, could also be searched for. Of course, longer reports were more intriguing: we expected more reliable conclusions with ”apparently more serious” peer-reviewers, than shorter reports, usually mentioning a positive statement, like ”paper to be accepted for publication (due to whatever reason).
Moreover in order to test a possible personal effect specific to reviewers, we added, from the October set, 2 more reviewers who performed reviews of 2 different papers. Those were selected on the initial observation that they were of interest because having a very large number of words. However, the truly two longest reviews, called and , were selected at this level. Indeed, mainly contains a rather long list of 31 references which the reviewer wanted the authors to include. However, this long list does not bring much in terms of word statistics since it mainly contains titles of papers, thus with chemical compounds, and journal titles. The report also contains several remarks on spelling/grammar errors in the manuscript, thus often misprints, leading to the appearance of many single words, used once. However, the ”long” has next been retained, because it appeared to pertain to the paper , whence could be compared to a shorter set of comments on this same paper, .
For broadening the discussion, three other reports are considered: , , and . Reports and refer to different papers, and , but have been reviewed by the same reviewer. Furthermore, a shorter has been added to the selection because it was about the paper , reviewed by the same reviewer who wrote for .
In summary, there are 10 cases for which a single report corresponds to a single paper; 4 cases in which a paper has been reviewed by a multiple set of reviewers; and 3 cases in which a submitted paper has been reviewed by different reviewers. Thus, 25 reviews () with 22 reviewers () for 20 papers () are studied here.
We stress that authors and reviewers anonymity has been preserved throughout. We guarantee that, at first, there was no information used concerning the fact that a reviewer might have been the same for different papers. Only on the third stage of selection of reviews, when we added 5 papers, as emphasized here above, had this information been (necessarily) taken into account for the selection.
Secondly, the outcome of the reports, i.e. whether the assessed papers were accepted, rejected or whether a revision was suggested, was unknown at the beginning of the study. Since, at first glance, one can guess that accepted papers correspond to short reports, it is tempting to judge by the report length only whether the reviewer’s attitude is positive or negative. However, if the paper is nonsense or it has been already published by the same or other authors, then short negative reports are also probable. This fact also favors a quantification analysis approach based on the distribution of words, as the number of words itself is not sufficient to evaluate reviewers.
It is also worth to mention that, for JSCS, all reviewers are chosen according to their expertise, i.e. they are picked up from SCOPUS database as professionals (experts) in a topic of the submitted manuscript. In this respect, it is unlikely that short reports and small number of words are attributed to insufficient knowledge of chemistry by reviewers.
In summary, in the presented analysis neither the fate of the paper has been considered, nor the conclusive recommendation by the reviewer. In these respects, we can consider that our study was a ”blind one”, unbiased.
2.2 Data Refinement
In order to count the number of words for distinguishing reports and hopefully reviewer behaviors, some slight modification of the report had to be made in order to adapt the review containing technical jargon for available word counting softwares. An important technical point has to be first mentioned: the algorithm does not recognize greek or cyrillic letters, subscripts, digits nor indices, e.g. is equivalent to ; the lowercase letters are equivalent to capital letters; the mathematical and grammatical symbols, like ”-” , ”+”, ” ’ ”, ””, or ”/” are replaced by blanks.
Since the greek letters , , and do represent some information about a chemical compound, (e.g., -sheet; -helix), these letters must be considered as words, rather than as a letter. The same holds for which might be for kilo, but corresponds also to a chemical element Potassium, but can also mean Kelvin, or for which can refer to Carbon or Celsius or a ”constant”; or , an abbreviation for some unit (milli). Also a chemical unit must be distinguished from the greek letter which could also mean when some unit is mentioned. All reports have been adapted to take into account such considerations. Others can be briefly listed and justified: for example,
-
•
the greek letters , , have been replaced by , , ;
-
•
(and similar units) have been kept as specific words, when there is no ambiguity;
-
•
it has been checked whether (or ) is Carbon or Celsius or a ”constant” or some specific symbol for a chemical species, and appropriately rewritten;
-
•
it has been checked whether (or ) is an article or some specific symbol for a chemical species;
-
•
and whether is Kelvin or Potassium, i.e. the for Kelvin has been kept, but for Potassium was replaced by ”Potassium”;
-
•
an identification was made between Pb and Lead; to be distinguished from the verb ”to lead”;
-
•
dash () presence was carefully checked, in order to replace the words by a single one when appropriate: e.g., has been replaced by ”coadministration”, also in order to avoid a misinterpretation of with Cobalt (Co);
-
•
chemical compounds like Vitamin C (or Vitamin A) became or ; rGST-Mus became RGSTMus; yet, are two words and , but is only one word ;
-
•
ionisation-mass spectrometry has been kept as a word set: ionisation mass spectrometry;
-
•
a for ”Peak” was distinguished from ”Phosphorus” or for a page number;
-
•
”” has been replaced by , in order to avoid confusion with , the temperature; idem for and which read and , to keep each of those as the reviewer apparently wishes, i.e. a single word;
-
•
cyrillic letters have been arbitrarily simplified to read like in English alphabet - usually for author’s names;
-
•
when authors have complex names ”El Alali” or ”Gustin-Schwartz” they have been concatenated and have been rewritten as ElAlali or GustinSchwartz;
-
•
initials of names have been attached to the names in order to avoid confusion with chemical compounds sometimes; the names and initials of authors have been kept in the order given by the reviewer, since he/she wishes so, in some sense; for example MDGardiner differs from GardinerMD (although it should be DMGardiner); this concatenation applies to references in the bibliography list as well;
-
•
the words have been forcefully replaced by , in order to avoid confusion with Al for Aluminum;
-
•
the numbers referring to Tables (, , …) have been replaced by their arabic numeral, 1, 2, … in order not to confuse the Table number with the letter I;
-
•
misprints have been kept, including those in comments by reviewers pointing misprints by (and to) authors;
-
•
the name of journals has been concatenated since they refer to a given unit; otherwise ”of” and ”Journal” would appear very often, without any useful meaning for the word counting;
-
•
references to websites were deleted.
Other examples of technical points can be quickly mentioned. Abbreviations have been kept as in the original reviewer report; e.g. is one word, different from . Both Edaravone and EDA are different words, though the same compound. Special confusions could be seen to occur in other cases: (i) a zeolite was called ”zeolite A”; this has been called to avoid over-counting the ”a” as an article (3 times in ); (ii) a is once mentioned (in ); it has been considered to be two words, this has been included as a for not representing as the temperature.
Nevertheless, such possible confusions or ambiguities (and maybe others which have been overlooked) can be considered as minute effects on the overall analysis, discussion, and conclusions. Yet, this cumbersome time consuming task insures more confidence in the following data analysis.
| TW | DW | DW/TW | TW | DW | DW/TW | ||
|---|---|---|---|---|---|---|---|
| 746 | 280 | 0.37534 | 697 | 310 | 0.44476 | ||
| 617 | 215 | 0.34846 | 663 | 277 | 0.41780 | ||
| 386 | 148 | 0.38342 | 611 | 258 | 0.42226 | ||
| 381 | 178 | 0.46719 | 595 | 251 | 0.42185 | ||
| 269 | 139 | 0.51673 | 594 | 271 | 0.45623 | ||
| 237 | 135 | 0.56962 | 594 | 261 | 0.43939 | ||
| 200 | 107 | 0.53500 | 556 | 263 | 0.47302 | ||
| 174 | 123 | 0.70690 | 538 | 232 | 0.43123 | ||
| 174 | 110 | 0.63218 | 485 | 262 | 0.54021 | ||
| 126 | 86 | 0.68254 | 475 | 235 | 0.49474 | ||
| 3310 | 937 | 0.28308 | 5808 | 1510 | 0.25999 |
| report | Max | Mean | RMS | Std Dev | Var | Std Err | Skewn | Kurt |
|---|---|---|---|---|---|---|---|---|
| 29 | 2.14 | 3.76 | 3.11 | 9.68 | 0.23 | 5.58 | 38.28 | |
| 65 | 2.66 | 5.83 | 5.19 | 27.02 | 0.31 | 7.88 | 79.69 | |
| 16 | 1.75 | 2.63 | 1.97 | 3.88 | 0.16 | 4.40 | 23.65 | |
| 18 | 1.86 | 2.95 | 2.29 | 5.26 | 0.22 | 4.91 | 28.15 | |
| 30 | 2.86 | 5.01 | 4.12 | 16.99 | 0.28 | 3.78 | 15.68 | |
| 31 | 2.60 | 4.76 | 3.99 | 15.96 | 0.32 | 4.57 | 24.25 | |
| 12 | 1.58 | 2.19 | 1.52 | 2.31 | 0.14 | 4.00 | 20.28 | |
| 13 | 1.41 | 2.04 | 1.47 | 2.17 | 0.13 | 5.46 | 34.20 | |
| 8 | 1.46 | 1.91 | 1.23 | 1.52 | 0.13 | 3.86 | 16.47 | |
| 13 | 1.93 | 2.76 | 1.97 | 3.91 | 0.16 | 3.473 | 14.22 | |
| 230 | 3.53 | 11.86 | 11.33 | 128.48 | 0.37 | 13.08 | 214.47 |
| report | Max | Mean | RMS | Std Dev | Var | Std Err | Skewn | Kurt |
|---|---|---|---|---|---|---|---|---|
| 69 | 2.24 | 5.28 | 4.79 | 22.95 | 0.27 | 9.97 | 125.31 | |
| 50 | 2.39 | 5.24 | 4.67 | 21.81 | 0.28 | 7.32 | 61.54 | |
| 45 | 2.19 | 4.42 | 3.84 | 14.80 | 0.23 | 7.33 | 66.88 | |
| 35 | 2.11 | 3.90 | 3.29 | 10.82 | 0.20 | 6.03 | 46.55 | |
| 38 | 1.85 | 3.49 | 2.97 | 8.85 | 0.18 | 8.13 | 85.65 | |
| 41 | 2.27 | 4.59 | 3.99 | 15.98 | 0.24 | 6.03 | 44.17 | |
| 66 | 2.36 | 5.50 | 4.97 | 24.79 | 0.31 | 9.30 | 106.17 | |
| 30 | 2.37 | 4.28 | 3.57 | 12.77 | 0.22 | 4.83 | 26.62 | |
| 45 | 2.31 | 4.38 | 3.73 | 13.92 | 0.24 | 7.53 | 75.43 | |
| 41 | 2.02 | 4.07 | 3.54 | 12.58 | 0.23 | 7.32 | 66.80 | |
| 415 | 3.84 | 15.95 | 15.49 | 240.03 | 0.39 | 17.39 | 385.84 |
| 8.720.27 | 0.5640.015 | 10.51 | 0.919 | 64.280.59 | 0.8410.006 | 143 | 0.980 | ||
| 18.380.35 | 0.7030.011 | 18.75 | 0.966 | 55.280.88 | 0.7670.009 | 297 | 0.951 | ||
| 11.810.26 | 0.5950.010 | 11.75 | 0.954 | 45.950.01 | 0.8630.007 | 38.2 | 0.990 | ||
| 12.570.30 | 0.6510.012 | 16.53 | 0.938 | 36.760.37 | 0.6510.008 | 54.7 | 0.981 | ||
| 16.710.23 | 0.6350.007 | 11.34 | 0.978 | 35.150.43 | 0.7230.007 | 69.6 | 0.970 | ||
| 15.850.38 | 0.5670.010 | 33.19 | 0.940 | 44.940.57 | 0.7500.004 | 122 | 0.971 | ||
| 34.990.64 | 0.7140.010 | 85.74 | 0.964 | 62.330.63 | 0.6890.005 | 131 | 0.979 | ||
| 30.270.31 | 0.7080.005 | 24.86 | 0.986 | 36.630.71 | 0.7370.006 | 195 | 0.939 | ||
| 37.481.01 | 0.6220.012 | 357.9 | 0.902 | 41.410.48 | 0.7420.007 | 75.8 | 0.976 | ||
| 63.790.45 | 0.7810.004 | 79.30 | 0.990 | 40.180.49 | 0.7700.007 | 78.6 | 0.973 | ||
| 243.31 1.17 | 0.8120.003 | 1767 | 0.985 | 428.01.3 | 0.8410.002 | 3594 | 0.990 |
3 Data Analysis
Table 1 contains the counting of words in the Sept. and Oct. 2014 reports () by reviewers ranked in decreasing order of the total number of words so used; the number of different words, , is also given. Observe the inversion of and , as well as , , and , between the two Sept. lists. A similar shuffling is found for the Oct. lists, with , , and . Observe the position of for which the ratio is the largest. Such a reviewer though writing a long report has a wide variety of words to express his/her view.
There is apparently no simple relationship between the and used by a reviewer. There is a large variety of report (or reviewer) types from the and point of view. It seems that and depend specifically on reviewers, on their vocabulary, and maybe on their willingness to spend some time of peer-reviewing. Notice from the Sept. data, that it appears that both very long and very short reports can be received for the same paper, with either very detailed or very modest explanations and comments, thereby hinting us to quantify reviewer behavior, through word count at first.
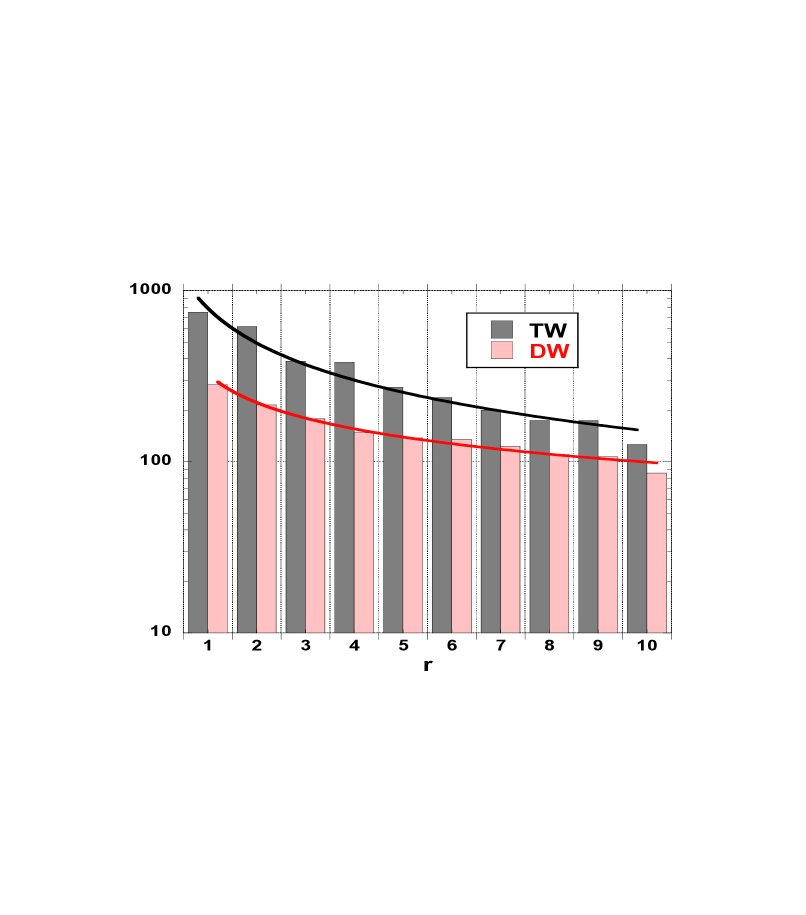
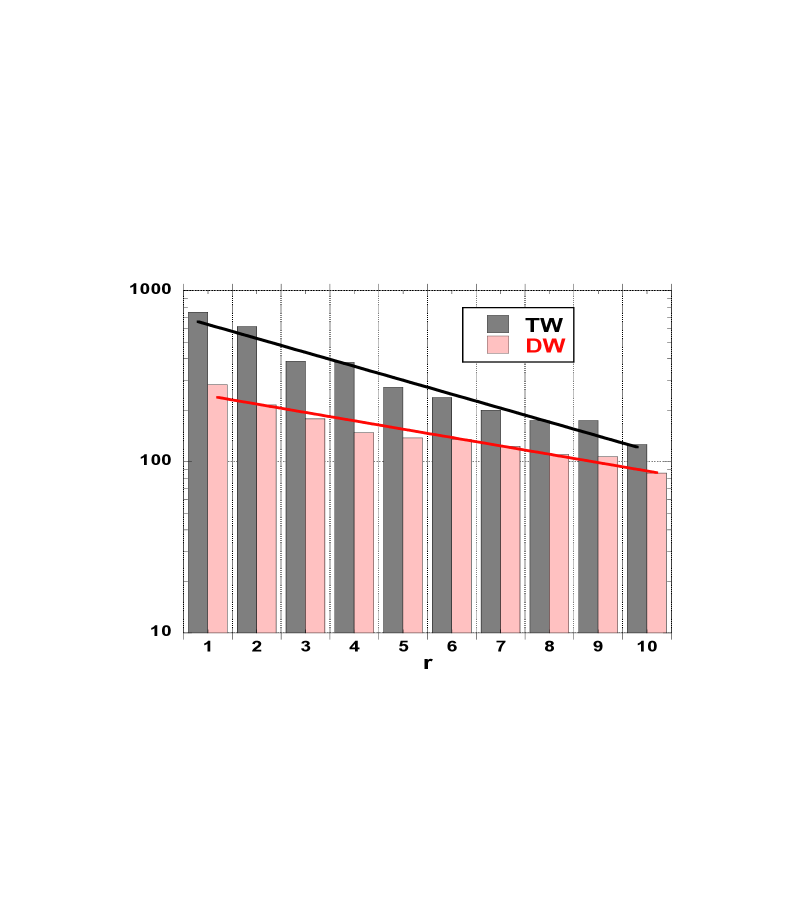
The respective rank-size relationships for and is shown in Fig. 1 and Fig. 2 for the Sept. cases, searching whether the empirical law is either a power law or an exponential. From a regression coefficient values, it appears that is better represented by a power law (), but by an exponential (). The same is observed for the Oct. 2014 data, with and for and , respectively. The relevant graphs are not displayed, for conciseness. There is no apparently immediate explanation for such a different behavior. It can be surely observed from the histogram of words that the and distributions of words span different ranges.
About the results in Table 1, one could induce that a good report made by a good reviewer should contain many words, and many meaningful words. Thus if one plots vs. , one should conclude that is ”the best”, and ”the worst”. However, one could argue that the ratio is more meaningful, the larger the better, since only meaningful words should then be reported; whence becomes ”the best”, and ”the worst”. On the other hand, maybe one should be concerned with some sort of two dimensional measure with the carefully chosen wages scaling the importance of both dimensions and . In Section 4, we propose a measure exploiting Zipf’s law which seems to be an adequate way to tackle this problem.
4 Reports and reviewers. A discussion
First, let it be re-mentioned that Zipf (Zipf 1949) observed that a large number of size distributions, can be approximated by a simple scaling (power) law , where is the ranking (integer) parameter, with , (and obviously ). A more flexible equation, with two parameters, reading
| (4.1) |
is called the rank-size scaling law and has been often applied to many ”sizes” of ”things” (Hill 2004, Cristelli et al. 2012). The particular (Zipf) case is thought to represent a desirable situation, in which forces of concentration balance those of decentralization, what in our study means an appropriate balance between diversity and redundancy in reviewers reports. Such a case, called the rank-size rule, has been frequently identified and sufficiently discussed elsewhere (Lin 2010, McKean et al. 2009, Wieder 2009, Wolfe 2009, Wolfe 2010) to allow us to base much of the present investigation on such a simple law.
In this context, let us consider the 10 September reports, the 10 October reports, and the reports specially added to the investigation, successively.
4.1 September reports
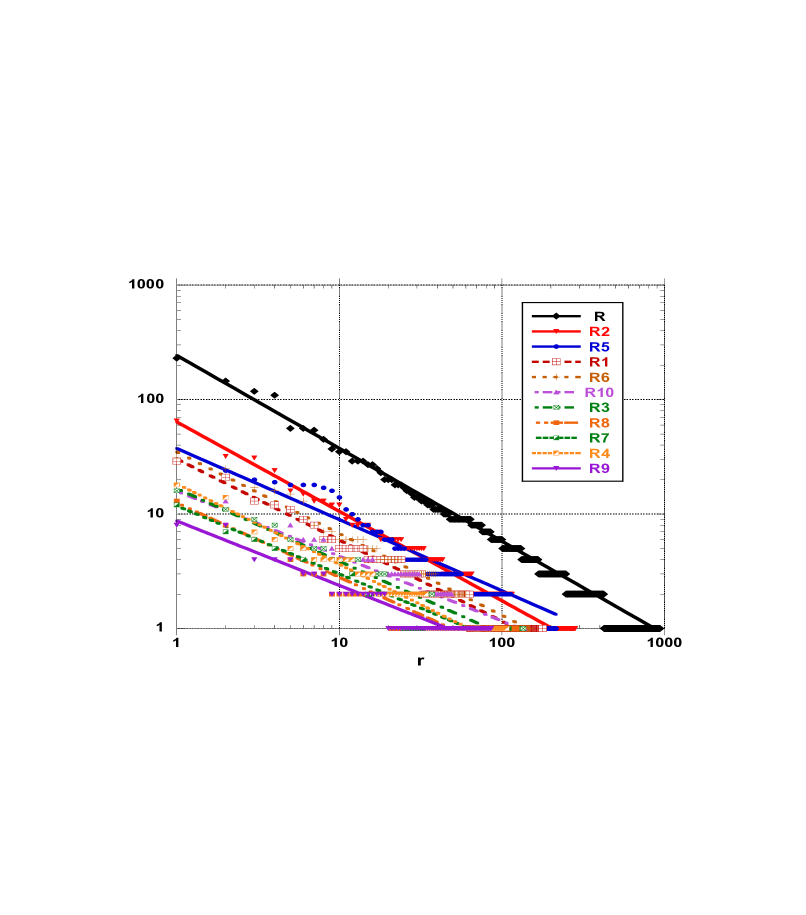
Thus, let us display the number of different words used in each report , from to , and in the overall set , as a function of their specific rank in each case, on a log-log plot, Fig. 3. The fit parameter values for the power law are found in Table 4, with their standard error bars.
Observe that 80 words are very frequent; occurring more than 10 times; thus likely in all reports. The high rank words are likely specific to each report pertaining (most likely) to a few (most likely, bis) different, papers.
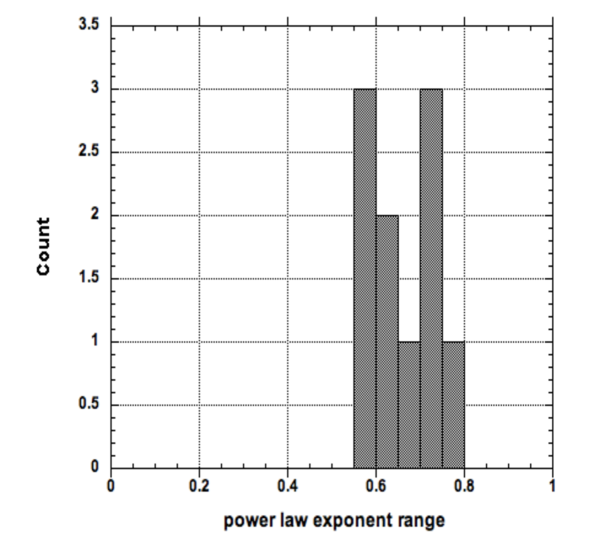
The values of the rank from till , with a mean , itself slightly above the median (); see Fig. 4. It should be obvious from such values that report by reviewers are far from classical texts; in these, the exponent is usually close to 1 indeed.
Several other points are remarkable:
-
•
is (very) anomalous; it has a weak , due to a marked shoulder near , see Fig. 3, but its is close to the average;
-
•
the correlation coefficient for is far from being considered large, but this report contains very few words;
-
•
the largest corresponds to the ”all Sept. reports” case, ; it is known that the highest of a sum of power laws is dragged by the highest of the set, here ;
-
•
although the statistics is only based on ten reports, one can recognize a two peak distribution of values: one below 0.6, the other at 0.7 (Fig.4).
-
•
quite interestingly, it appears that reports and are characterized by the same exponent . Recall that this observation led us to inquire from the editor about whether they were due to the reviewer! It is! By the way, the papers were rejected.
4.2 October reports
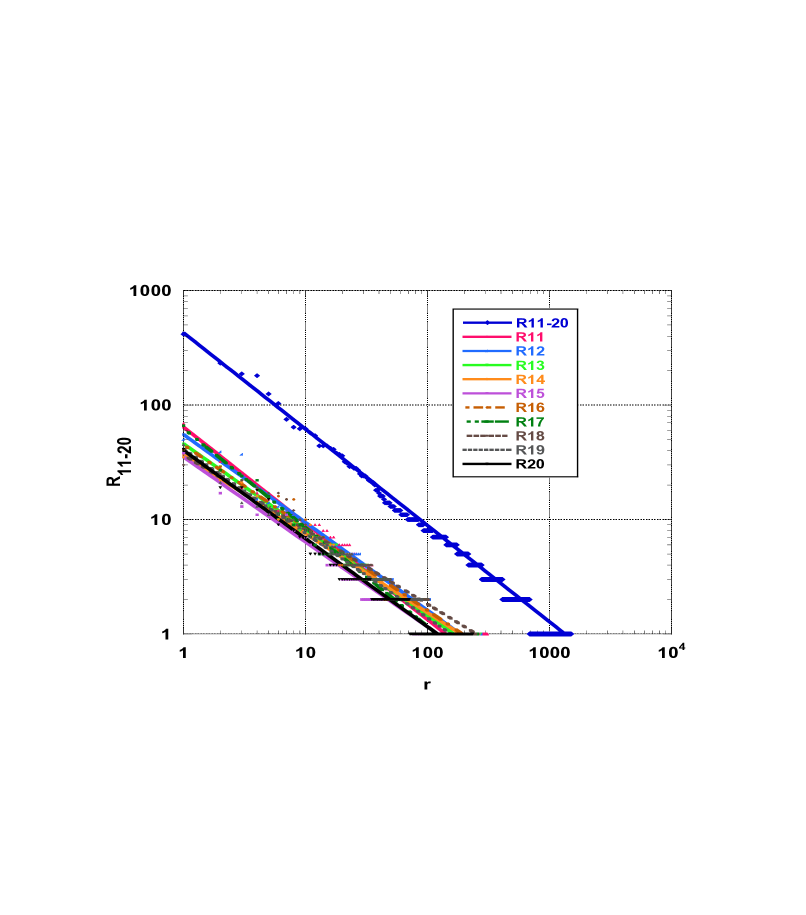
In Fig.5, a log-log plot of the number of different words used in reports to , together with the overall number, , as a function of their rank is shown. The fit parameter values for the power law are found in Table 4. The overall set of reports, , is markedly well represented by a power law with a very high .
At first sight, it appears that the reports can be positioned in two groups, basically according to the distribution of words around the straight line fit on a log-log plot. Also, , , and weakly deviate from the hyperbolic rank-size relationship. and have ”not many” words as the other reports; is an intermediary case in that sense. In these three cases, . The above also indicates that the statistics is better when the text is longer.
However in several reports the word frequency distributions only weakly agree with a power law fit. In particular, two kinds of effects can be observed: a King with Vice-Roy effect (when the low rank data are much above the fitted line) and a Queen with harem effect (when the rare words, often referring to misprints, are too abundant) (Laherrere and Sornette 1998, Ausloos 2013. In that cases, a Zipf-Mandelbrot fit (Fairthorne 1969), i.e. a -parameter natural generalization of a -parameter Zipf’s law, would be more appropriate. Its interest falls outside the framework of our paper and is not here examined further. The King-ViceRoy cases are , , and ; note that and , have the largest exponent () and a large number of words. The Queen-Harem effect is more marked in , , , ; notice that this is the set of reports having a lesser amount of words than the previous reviews. This exponent is in the lower part of the range interval.
These effects (deviations from Zipf’s mere power law) are much tied to the behavior at low rank where the usual (most common) English words appear; the highest ranks pertaining to rare words are often mentions of misprints. Nevertheless, their presence indicates that the reviewer has seriously read the submitted paper. This confirms the interest of a word counting analysis beside the Zipf’s line of approach.
4.3 Comparing reports by the same reviewer on different papers
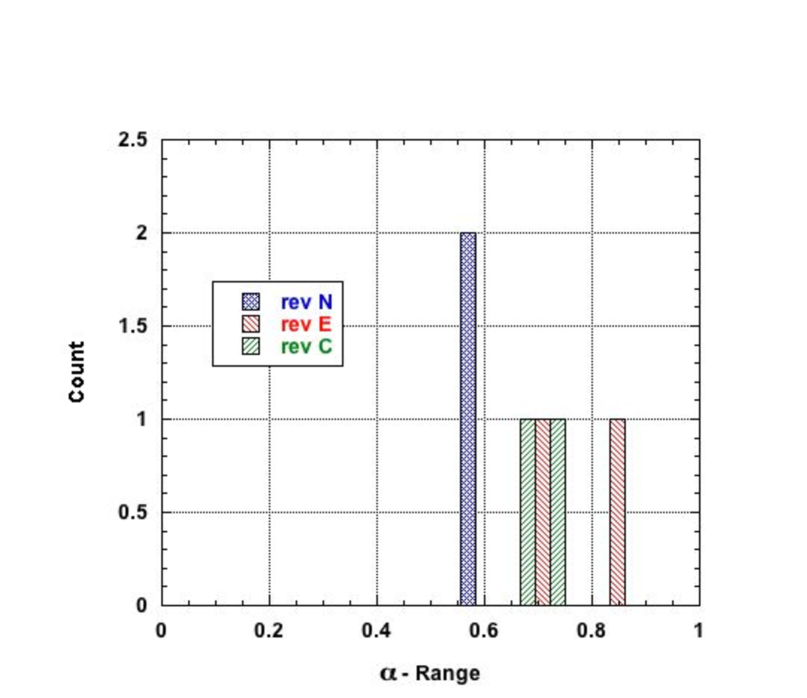
Comparing reports by the same reviewer on different papers is not an easy matter, because it is a rather rare event. Nevertheless, 3 cases occur in our data set. Thus, a comparison of the Zipf power law exponent for three reviewers ( N, E, and C) each having reviewed two (different) papers: and , and , and and , respectively, is made on Fig. 6. The exponents are remarkably different for the three reviewers, but are very close to each other, whatever the report. Thus, a marked identification can be apparently made of the reviewer according to his/her exponent.
4.4 Comparing reports on the same paper by different reviewers
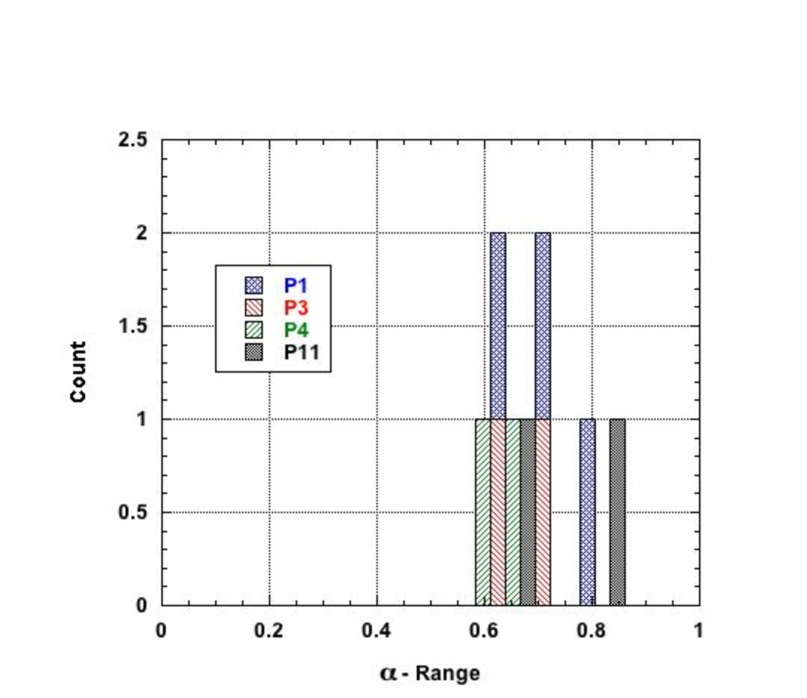
Moreover, for completeness, we can compare reports on the same paper by different reviewers. The Zipf power law exponents for different reviewers for the 4 indicated papers ( through , , and ; through and ; through and ; through and ) are shown on Fig. 7. In contrast to Sect.4.3 and Fig. 6 a distinction of reviewers can hardly be made in this case, due to the grouping of values on a short range interval..
5 Entropy connection
Recall that the exponent is considered to be a characteristic measure of the text content (and reviewer, by extension). Its distribution for the 20 presently examined reports emphasizes a peak at 0.75 or so, but also the possibility of a multi modal structure !
The distribution of exponents is best studied through a normalization condition which allows to define the ”probability” for finding a certain ”-state”, i.e. a rank-size occurrence. Going further, one can imagine to have access to the probability of a certain type of report () by a reviewer (), at a certain rank or value, through
| (5.1) |
where is the number of reports.
In presence of a large number of data points, a formula like
| (5.2) |
where can be considered as the density of in some interval, can be equally interesting.
Consider the 20 reports recorded in Table 4. Each can be easily obtained from Eq.(5.1). Thereafter, one can obtain something which looks like a contribution to a Shannon information entropy (Shannon 1948, 1951) for a given report ,
| (5.3) |
5.1 Report ranking relative distances
To estimate the validity of an empirical distribution, it is practical to compare each () measure to their related maximum disorder number, i.e. , where is the number of different words (DW, or number of data points) found in the report (see values in Table 1). This technique allows to ”measure” some information content of a report (by a reviewer ).
Thereafter, we define the relative ”distance” (of a report ) to the maximum entropy (full disorder) as
| (5.4) |
In order to rank the reports ”in a thermodynamic or information content” sense, with respect to an average report, one can define the average report entropy for a set of reports as
| (5.5) |
Thereafter, the ”distances” with respect to the average report can be defined as the distance between the two entropies
| (5.6) |
where is the total number of different words found in the set of reports.
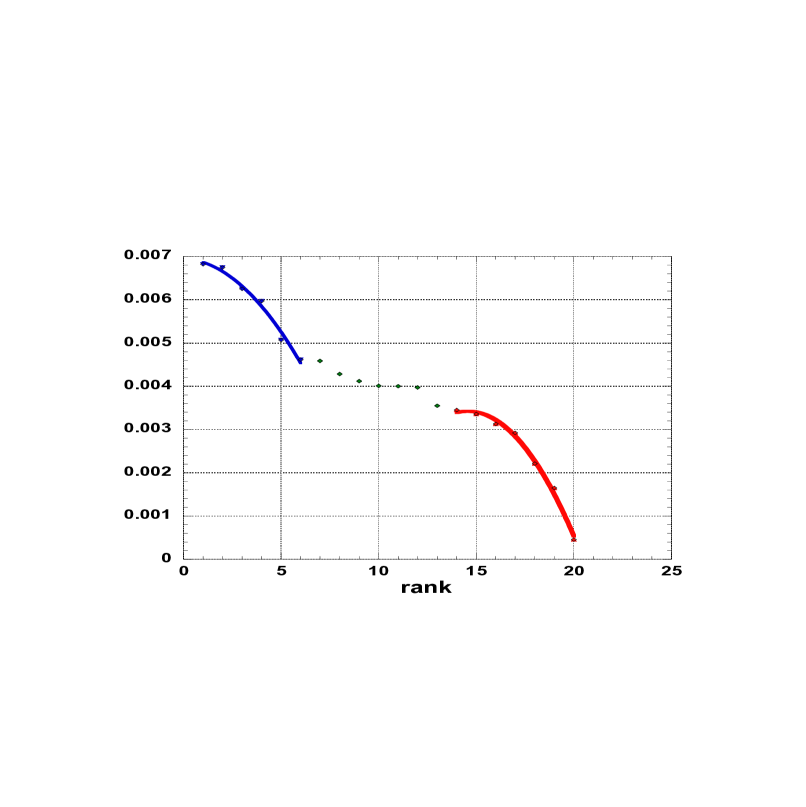
Fig. 8 shows the ranking of the distances, as a function of their rank. The distribution of ”distances” is seen to be far from trivial. In particular, a shoulder is observed between two well marked bumps. This is indicating an interesting output of the investigation . Therefore, a distinction can again be made between two sets of reports, as shown by a simple fit (a quadratic law) to the low rank and high rank cases, respectively. It may be debated, in further work, whether the intermediate set is in fact to be considered as a third set, or results from the other two.
5.2 Report ranking distance to journal editorial standard
Another measure can be proposed from
| (5.7) |
where the value corresponds to the exponent relevant to the whole set of reports, thus to a virtual reviewer, in some sense characterizing the reviewers tied to the journal by the editors. Similarly to Eq. (5.6), let
| (5.8) |
with , leading to a set of .
The ”final results” for the 10 September and for the 10 October reports are given in Table 5 and Table 6 respectively. As could be expected, if the set of reviewers is rather homogeneous in behavior, the relative quantities follow a ranking similar to what is expected through the Zipf’s law analysis. However, the and values are not so coherent: the orders of magnitude differ, due to a different order of magnitude in the number of words, but also the different signs indicate different classes of reports (or reviewers).
In fine, we stress that the interpretation of these two distances is different: measures a distance between reports, but pertains to a ”more general” measure, with respect to a virtual (average) reviewer characterizing this journal. From the latter, different journals could be compared.
| 100 | ||||||||
|---|---|---|---|---|---|---|---|---|
| 0.708 | 5.182 | 178 | 0.108 | 0.241 | 0.954 | -0.073 | -0.145 | |
| 0.781 | 5.635 | 280 | 0.119 | 0.254 | 0.955 | 0.069 | -0.003 | |
| 0.635 | 4.905 | 135 | 0.097 | 0.226 | 0.954 | -0.045 | -0.116 | |
| 0.703 | 4.673 | 107 | 0.107 | 0.240 | 0.949 | -0.557 | -0.628 | |
| 0.622 | 5.371 | 215 | 0.095 | 0.224 | 0.958 | 0.407 | 0.336 | |
| 0.714 | 4.997 | 148 | 0.109 | 0.242 | 0.952 | -0.267 | -0.338 | |
| 0.595 | 4.700 | 110 | 0.091 | 0.218 | 0.954 | -0.070 | -0.141 | |
| 0.651 | 4.812 | 123 | 0.100 | 0.230 | 0.952 | -0.202 | -0.273 | |
| 0.564 | 4.454 | 86 | 0.086 | 0.211 | 0.953 | -0.170 | -0.242 | |
| 0.567 | 4.935 | 139 | 0.087 | 0.212 | 0.957 | 0.275 | 0.204 |
| 100 | 100 | |||||||
|---|---|---|---|---|---|---|---|---|
| 0.841 | 5.737 | 310 | 0.112 | 0.245 | 0.957 | -0.137 | 0.234 | |
| 0.767 | 5.624 | 277 | 0.102 | 0.233 | 0.959 | -0.007 | 0.365 | |
| 0.863 | 5.553 | 258 | 0.115 | 0.248 | 0.955 | -0.341 | 0.031 | |
| 0.651 | 5.526 | 251 | 0.086 | 0.212 | 0.962 | 0.300 | 0.671 | |
| 0.723 | 5.565 | 261 | 0.096 | 0.225 | 0.960 | 0.087 | 0.458 | |
| 0.750 | 5.602 | 271 | 0.099 | 0.230 | 0.959 | 0.029 | 0.401 | |
| 0.689 | 5.572 | 263 | 0.091 | 0.219 | 0.961 | 0.203 | 0.575 | |
| 0.737 | 5.447 | 232 | 0.098 | 0.227 | 0.958 | -0.046 | 0.325 | |
| 0.742 | 5.568 | 262 | 0.098 | 0.228 | 0.959 | 0.030 | 0.401 | |
| 0.770 | 5.460 | 235 | 0.102 | 0.233 | 0.957 | -0.141 | 0.231 |
| 100 | 100 | |||||||
|---|---|---|---|---|---|---|---|---|
| 0.812 | 6.843 | 937 | 0.491 | 0.349 | 0.949 | -0.230 | -0.603 | |
| 0.841 | 7.320 | 1510 | 0.509 | 0.344 | 0.953 | 0.177 | -0.196 | |
| 0.850 | 7.599 | 1996 | 0.514 | 0.342 | 0.955 | 0.373 | 0 |

6 Conclusions
This conclusion section, beside summarizing our findings and their possible limits, allows us to offer a few suggestions for further research lines. To the best of our knowledge, this seems to be the first time that one quantifies reviewers through their report linguistic content. Next, a few findings are likely to be robust, others seem to be reliable. This is encouraging because it suggests the feasibility of using simple quantitative measures to characterize various aspects related to the quality of reviews and reviewers. This opens the door toward developing complementary tools of automatic evaluations in parallel to peer review.
In summary, this paper provides a statistical analysis of 25 reviewer reports for the biochemistry section of respected chemistry journal JSCS (e.g., impact factor= 0.912 in 2012). Each report has been analyzed with respect to its word content, along the first Zipf’s law idea (Zipf 1949).
-
•
It has been shown that the total number of words (TW) and of different words (DW) depend entirely on reviewers, on their vocabulary, whence likely on their willingness to spend time on the peer-review process.
-
•
It is proven that a power law is appealing in describing the size-rank relationship. However, due to the value range of the Zipf exponent, such reports are found to be very different from usual texts by novelists (Darooneh and Shariati, 2014).
-
•
From the Zipf exponent range, it seems that there are two classes of reports.
-
•
It has been observed that the Zipf exponent seems to characterize a specific reviewer, - though the statistics could be refined.
-
•
It is argued that one can compare reports (and maybe reviewers) between themselves through the concept of distance to randomness, basing our analysis on the thermodynamic entropy context, equivalent to the Shannon information entropy.
-
•
It is argued that one can qualify reports (and maybe reviewers) with respect to journal standards, due to the choice of reviewers, through a similar concept of distance to randomness.
Can we finally decide whether the Zipf exponent characterizes the reviewer more than his/her specific report ? Aware of possibly to be raised ”ambiguities” after our findings, it can be considered that many questions, thus suggestions for further work, follow. It can be recommended that
-
•
more discussion can involve the acceptance/rejection effect of papers; one approach could be based on correlations through quantified ”linguistic aspects”; it is of common knowledge that rejected papers can contain quite sharp language
-
•
the statistics can be improved. However this demands much work, since every report must be reviewed for technical purposes as shown in the main text;
-
•
the largest exponents might be correlated to the length (or the number of words) of the report.
Several other lines for further investigations can be imagined to arise (mainly) from restrictions at the start of the data acquisition process. It is suggested that
-
•
more samples, - in order to reduce the error bars
-
•
other sub fields of chemistry and in other scientific fields, - in order to test some universality, if any
-
•
other journals, - in order to test some universality, if any
-
•
other quantifying techniques,
could be examined.
Last but not least, an approach on the peer review dynamics is of interest, i.e., on the willingness of reviewers to spend time on such peer-review reports, when asked. Finding a hierarchy of reviewers within the present aim of paying reviewers is certainly worthwhile to be examined.
Acknowledgements This paper is part of scientific activities in COST Action TD1306 New Frontiers of Peer Review (PEERE).
Appendix A. Data analysis of unmanipulated reports
In this Appendix, the data analysis of the 10 Sept. reports, without any data manipulation, i.e. without in any way modifying the reports for their word content, is reported. It is shown in Table 8 that the power law exponent appears to be , with regression coefficient , for the report.
For , , and , the power law exponent appears to be , with their regression coefficient , but the other exponents evenly spread on 0.423 till 0.683.
It was observed that , and are among the top three longest reports. Thus should be less sensitive to ”slight” data modifications.
In fact, this Table, through the found values, is proving that for short reports one has to be much concerned by the vocabulary; whence one has to distinguish the meaning of (short) words (like ”a”, ”c”, ”k”).
In conclusion, it is highly meaningful to ”adapt” (= rewrite) the reports. The bad thing is that life is not simplified from a scientific point of view since it takes time to rewrite reports in a useful way.
| 8.740.27 | 0.5560.014 | 10.31 | 0.922 | |
| 18.390.35 | 0.7040.011 | 18.93 | 0.966 | |
| 11.730.23 | 0.6040.009 | 9.168 | 0.962 | |
| 37.491.01 | 0.6220.011 | 358.1 | 0.902 | |
| 16.710.23 | 0.6350.007 | 11.34 | 0.978 | |
| 15.860.38 | 0.5670.010 | 33.19 | 0.940 | |
| 35.020.63 | 0.7120.010 | 84.12 | 0.964 | |
| 30.270.31 | 0.7080.005 | 24.91 | 0.986 | |
| 12.570.30 | 0.6510.012 | 16.53 | 0.938 | |
| 63.780.46 | 0.7810.004 | 80.57 | 0.989 | |
| 242.452.05 | 0.8060.005 | 1683.3 | 0.985 |
References
Ausloos M. 2012a Generalized Hurst exponent and multifractal function of original and translated texts mapped into frequency and length time series. Phys. Rev. E 86, 031108.
Ausloos M. 2012b Measuring complexity with multifractals in texts. Translation effects, Chaos, Solitons and Fractals 45, 1349-1357.
Ausloos M. 2013 A scientometrics law about co-authors and their ranking. The co-author core, Scientometrics 95, 895-909.
Bornmann L., 2011 Scientific peer review, Ann. Rev. Inf. Sci. Technol., 45, 199-245.
Bougrine H., 2014 Subfield Effects on the Core of Coauthors, Scientometrics, 98, 1047-1064.
Callaham M.L., Wears R.L., Waeckerle J.F., 1998 Effect of attendance at a training session on peer reviewer quality and performance, Ann. Emerg. Med., 32, 318-322.
Cristelli M., Batty M., Pietronero L., 2012 There is more than a power law in Zipf, Scientific Reports, 2, 812. doi:10.1038/srep00812
Darooneh A.H., Shariati, A., 2014 Metrics for evaluation of the author’s writing styles: Who is the best?, Chaos: An Interdisciplinary Journal of Nonlinear Science, 24, 033132.
Dubois D.M., 2014 Computational Language Related to Recursion, Incursion and Fractal in Language and Recusrsion F. Lowenthal and L. Lefebvre eds.) Springer Science+Business Media, New York, pp. 149-165.
Fairthorne R.A., 1969 Empirical hyperbolic distributions Bradford-Zipf-Mandelbrot) for bibliometric description and prediction, J. Documentation, 25, 319-343.
Febres G., Jaffe K. 2014 Quantifying literature quality using complexity criteria,
preprint .
Ferrer i Cancho R, 2006 When language breaks into pieces. A conflict between communication through isolated signals and language. Bio Systems, 84, 242–253.
Feurer I.D., Becker G.J., Picus D., Ramirez E., Darcy M.D., Hicks M.E., 1994 Evaluating peer reviews: pilot testing of a grading instrument, JAMA 272, 98-100.
Godlee F., Gale C.R., Martyn C.N., 1998 Effect on the quality of peer review of blinding peer reviewers and asking them to sign their reports: a randomized control trial. JAMA 280, 237-240.
Goodman S.N., Berlin J., Fletcher S.W., Fletcher R.H., 1994 Manuscript quality before and after peer review and editing at Annals of Internal Medicine, Ann. Intern. Med. 121, 11-21.
Hill B.M., 2004 The Rank-Frequency Form of Zipf’s Law, J. Am. Stat. Assoc., 9, 1017-1026.
Jadad A.R., Cook D.J., Jones A., Klassen T.P., Tugwell P., Moher M., Moher D., 1998 Methodology and reports of systematic reviews and meta-analyses: a comparison of Cochrane reviews with articles published in paper-based journals. JAMA, 280, 278-280.
Justice A.C., Cho M.K., Winker M.A., Berlin J.A., Rennie D., 1998 Does masking author identity improve peer review quality? a randomized controlled trial. JAMA, 280, 240-242.
Laherrere J., Sornette D., 1998 Stretched exponential distributions in nature and economy fat tails with characteristic scales. Eur. Phys. J. B, 2, 525-539.
Lin S., 2010 Rank aggregation methods. WIREs Comp. Stat., 2, 555-570.
McCowan B., Doyle L.R., Hanser S.F., 2002 Using Information Theory to Assess the Diversity, Complexity, and Development of Communicative Repertoires. J. Comp. Psychol. 116, 166-.
McKean J.W., Terpstra J.T., Kloke J.D., 2009 Computational rank-based statistics. WIREs Comp. Stat., 2, 132-140.
McNutt R.A., Evans A.T., Fletcher R.H., Fletcher S.W., 1990 The effects of blinding on the quality of peer-review. a randomized trial. JAMA, 263, 1371-1376.
Miskiewicz J., 2013 Effects of Publications in Proceedings on the Measure of the Core Size of Coauthors. Physica A, 392, 5119-5131.
Neuhauser D., Koran C.J., 1989 Calling Medical Care reviewers first: a randomized trial. Med. Care, 27, 664-666.
Oxman A.D., Guyatt G.H., Singer J., 1991 Agreement among reviewers of review articles. J. Clin. Epidemiol., 44, 91-98.
Publishing Research Consortium, 2008 Peer review in scholarly journals: Perspective of the scholarly community: an international study.
Rodriguez E., Aguilar-Cornejo M., Femat R., Alvarez-Ramirez J., 2014 Scale and time dependence of serial correlations in word-length time series of written texts. Physica A 414, 378–386.
van Rooyen S., Godlee F., Evans S., Black N., Smith R., 1999 Effect of open peer review on quality of reviews and on reviewers’ recommendations: a randomised trial. BMJ, 318, 23-27.
Shannon C., 1948 A mathematical theory of communications. Bell System Technical Journal, 27, 379-423.
Shannon C., 1951 Prediction and entropy of printed English. Bell System Technical Journal, 30, 50-64.
Siler K., Lee K., Bero L., 2015 Measuring the effectiveness of scientific gatekeeping. Proc. Nat. Acad. Sci., 112, 360-365.
Strayhorn Jr J., McDermott Jr J.F., Tanguay P., 2015 An intervention to improve the reliability of manuscript reviews for the Journal of the American Academy of Child and Adolescent Psychiatry. Am. J. Psychiatry, 150, 947-952.
Wager E., Jefferson T., 2001 The shortcomings of peer review. Learned Publishing, 14, 257-263.
Wieder T., 2009 The Number of Certain Rankings and Hierarchies Formed from Labeled or Unlabeled. Appl. Math. Sci., 3, 2707-2724.
Wolfe D.A., 2009 Rank methods. WIREs Comp. Stat., 2, 342-347.
Wolfe D.A., 2010 Ranked set sampling. WIREs Comp. Stat., 2, 460-466.
Zipf G.K., 1949 Human Behavior and the Principle of Least Effort : An Introduction to Human Ecology, Cambridge, Mass.: Addison Wesley Press.