Photodegradation and Self-Healing in a Rhodamine 6G Dye and Y2O3 Nanoparticle-Doped Polyurethane Random Laser
Abstract
One of the fundamental difficulties in implementing organic dyes in random lasers is irreversible photodegradation of the dye molecules, leading to loss of performance and the need to replace the dye. We report the observation of self-healing after photodegradation in a Rhodamine 6G dye and nanoparticle doped polyurethane random laser. During irradiation we observe two distinct temporal regions in which the random lasing (RL) emission first increases in intensity and redshifts, followed by further redshifting, spectral broadening, and decay in the emission intensity. After irradiation the emission intensity is found to recover back to its peak value, while still being broadened and redshifted, which leads to the result of an enhancement of the spectrally integrated intensity. We also perform IR-VIS absorbance measurements and find that the results suggest that during irradiation some of the dye molecules form dimers and trimers and that the polymer host is irreversibly damaged by photooxidation and Norrish type I photocleavage.
I Introduction
Lasing in disordered media was first predicted in the late 1960’s by Letokhov Letokhov66.01 ; Letokhov67.01 ; Letokhov67.02 and first demonstrated in the mid 1990’s Lawandy94.01 . This form of lasing – in which scattering acts as the feedback mechanism – is known as random lasing. Random lasing (RL) is found to have two regimes of behavior: intensity feedback random lasing (IFRL) and resonant feedback random lasing (RFRL) Cao03.01 ; Cao03.02 ; Cao05.01 . IFRL is characterized by a single emission peak with a linewidth of approximately 5-10 nm Cao03.02 ; Lawandy94.01 ; Cao05.01 while RFRL is characterized by the appearance of multiple sub-nm peaks Cao03.02 ; Meng09.01 ; Cao99.01 ; Ling01.01 ; Cao05.02 . The sharp peaks of RFRL arise due to a small number of lasing modes in the scattering material being active. As the number of active modes increases they merge into a broad peak corresponding to IFRL Cao03.01 ; Cao03.02 ; Ling01.01 ; Tureci08.01 ; Ignesti13.01 .
The multimode nature of IFRL results in the emission having a low degree of spatial coherence Redding11.01 , which makes it attractive as a high-intensity low-coherence light source Redding12.01 , which has applications in biological imaging Redding12.01 ; Hecht12.01 , picoprojectors, cinema projectors Hecht12.01 , photodynamic therapy, tumor detection Hoang10.01 ; Cao05.01 , flexible displays, and active elements in photonics devices Cao05.01 . On the other hand, lasing in few modes creates unique spectral signatures that can be used in encoding for authentication, labeling of cells for biological imaging, and emergency beacons Hoang10.01 ; Cao05.01 . Additionally, the spectrum of a RFRL can be controlled by spatial modulation of the pump beam Leonetti12.01 ; Cao05.01 ; Leonetti13.02 ; Leonetti12.02 ; Leonetti12.03 ; Andreasen14.01 ; Bachelard12.01 ; Bachelard14.01 . Controlled RFRL can be used to create tunable light sources Cao05.01 and implement optically based physically unclonable functions Anderson14.04 ; Anderson14.05 .
While RL has been observed in a wide variety of materials, one of the primary material classes used for studying RL is organic dyes and nanoparticles doped into solution or polymer. These materials are attractive as they are easy and cheap to produce, and allow for the formation of arbitrary shapes Cao05.01 . While organic dyes have these attractive features, they also have a major flaw in that they tend to irreversibly photodegrade under extended exposure to high intensity light wood03.01 ; taylo05.01 ; Avnir84.01 ; Knobbe90.01 ; Kaminow72.01 ; Rabek89.01 . Irreversible photodegradation leads to a loss in performance and efficiency, which eventually requires the dye to be replaced if the random laser is to continue to work.
A possible solution to irreversible photodegradation of organic-dye-based random lasers is to make random lasers using self-healing dye-doped polymers. Self-healing dye-doped polymers are materials which display the characteristics of irreversible photodegradation when exposed to intense light, but once the light is removed the material “heals” itself returning to its original efficiency. The phenomenon of self-healing in dye-doped polymers was first observed by Peng et al. in Rhodamine B and Pyrromethene dye-doped poly(methyl-methacrylate) (PMMA) optical fibers Peng98.01 . Since Peng et al.’s observation, self-healing has been observed in disperse orange 11 (DO11) dye-doped PMMA howel04.01 ; howel02.01 , DO11 dye-doped copolymer of styrene and MMA Hung12.01 , air force 455 (AF455) dye-doped PMMA Zhu07.01 , 8-hydroxyquinoline (Alq) dye-doped PMMA Kobrin04.01 , anthraquinone-derivative-doped PMMA Anderson11.02 , and Rhodamine 6G dye-doped polyurethane with dispersed ZrO2 nanoparticles Anderson15.01 .
In this study we present the observation of self-healing in random lasers composed of Rhodamine 6G dye-doped polyurethane with dispersed Y2O3 nanoparticles. We find that photodegradation results in a reversible decrease in the peak lasing intensity, while also resulting in irreversible changes to the lasing wavelength and linewidth. We also perform IR-VIS absorbance measurements to determine probable mechanisms of the irreversible changes in the random laser due to photodegradation.
II Method
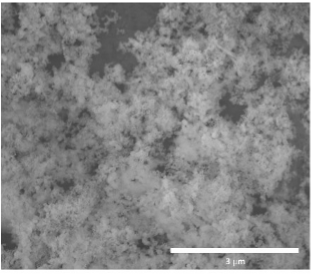
The random laser samples used for this study are prepared as follows. We first dissolve Rhodamine 6G (R6G) in tetraethylene glycol (TEG) such that the resulting dye concentration is 1 wt% of the polymer. To prepare the polymer we mix equimolar amounts of TEG and poly(hexamethylene diisocyanate) (pHDMI) together along with 0.1 wt% di-n-butyltin dilaurate (DBTDL) catalyst, where the TEG, pHMDI, and DBTDL are purchased from Sigma-Aldrich. The resulting dye-doped mixture is then centrifuged for 3 min at 3000 rpm to remove air bubbles, at which point it is poured into a 1” circular die. Next we add a dispersion of Y2O3 NPs (Inframat, 30-50 nm diameter, Figure 1 shows an SEM image) in 1,4-dioxane and DBTDL to the mixture and stir until it is homogeneous. The mixture is then left at room temperature to cure over night.
Photodegradation and recovery of the R6G+ Y2O3/PU samples is measured using an intensity stabilized random lasing system consisting of a Spectra-Physics Quanta-Ray Pro frequency doubled Nd:YAG laser (532 nm, 10 ns, 10 Hz), a motorized half-waveplate (HWP), polarizing beam splitter (PBS), a Thorlabs Si photodiode, a motorized shutter, a plano-convex lens ( mm), and a Princeton Instruments spectrometer. See Figure 2 for a schematic of the experimental setup.
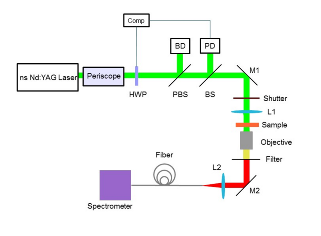
The laser’s power is monitored and controlled using a feedback loop between the photodiode and motorized half-waveplate, with five pulse averaging used to determine the feedback signal. Using this technique we maintain the on sample intensity within 1% over the entire experimental time period. The main limitation to reducing the intensity variance further is the laser’s shot-to-shot noise value of approximately 1%. For our various trials we use pump energies between 1.5 mJ and 33 mJ with an on sample spot size of 2.8 mm, giving an intensity range of 2.44 MW/cm2 to 53.6 MW/cm2.
Additionally, we perform imaging and IR-VIS absorbance measurements to characterize the underlying changes in the material due to irradiation. For VIS absorbance measurements we focus white light to a 0.25 mm spot on the sample and collect the reflected light into a spectrometer. The reason for using reflected light is that the majority of the photo-induced changes occur near the surface of the sample and, due to scattering, reflected light is a more accurate probe of surface changes than transmitted light, which undergoes more scattering and a longer optical pathlength in the sample.
For these reasons our FTIR measurements are also performed in reflection using an FTIR-ATR (Varian 680) using a frequency range of 4000 cm-1 to 400 cm-1, a step size of 1 cm-1, and 32 spectrum averaging. To better differentiate between photo-induced changes in the IR spectrum and those due to variations within the sample, we measure the pristine IR absorbance at five different points on the sample and compute the average absorbance and standard deviation. We find that the pristine sample has a consistent IR absorbance at all points tested and that changes in the IR absorbance spectrum due to irradiation are larger than the point-to-point variations.
III Results and Discussion
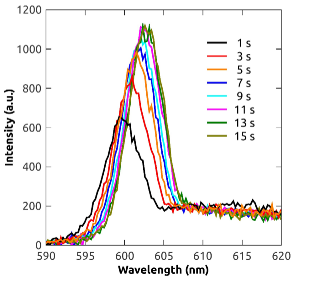
We begin our study of photodegradation and self-healing in R6G+Y2O3/PU random lasers by considering the peak lasing intensity as a function of time during pumping and recovery, shown in Figure 3. From the figure we observe three distinct temporal regions. The first region, which we call conditioning, begins the moment the pump laser is incident on the material and lasts for 0.2 min (120 pulses). This region is characterized by a rapid increase in peak intensity and a large red-shift in the emission spectrum. Figure 4 shows spectra at several times during conditioning. While we observe conditioning of the RL spectra in R6G+ Y2O3/PU, this effect is not observed in R6G+ZrO2 /PU Anderson15.01 , suggesting that the phenomenon is related to the properties of the NPs dispersed into the polymer. Most likely the different NPs affect the polymerization of the sample as FTIR results, discussed below, show that conditioning corresponds to photothermal induced polymerization of leftover monomer in the system.
After conditioning, the random laser emission decreases in intensity, red-shifts, and is broadened. After degradation the pump beam is blocked by a shutter and the sample begins to self-heal. During recovery, at semi-log time intervals, the pump shutter is opened for three pulses and the RL emission is measured. As the sample self-heals the RL emission intensity is found to increase back to its conditioned value (see Figure 3).
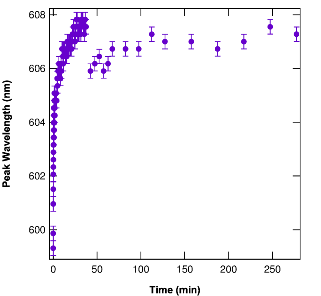
While the peak intensity is found to return to it’s conditioned value, the emission wavelength and linewidth are found to irreversibly change due to photodegradation. Figure 5 shows the peak wavelength as a function of time, where it rapidly redshifts during conditioning and degradation, but then blueshifts when the pump beam is blocked and the sample is left in the dark for 15 min. From the observation of a blue shift when the laser is turned off we hypothesize that part of the red shift is due to photothermal heating Anderson15.01 , as an increase in temperature is known to result in a red shift of RL emission Vutha06.01 . To address the remaining redshift we propose that the polymer undergoes irreversible photo-induced changes, which modify the index mismatch of the system Anderson14.02 resulting in an increase in scattering. This hypothesis is supported by the observation that increases in the amount of scattering in a material results in the lasing wavelength becoming redshifted Yi12.01 ; Shuzhen09.01 ; Anderson14.04 ; Dong11.01 . Later in the paper we will identify several possible candidates for the photo-induced modifications of the polymer host.
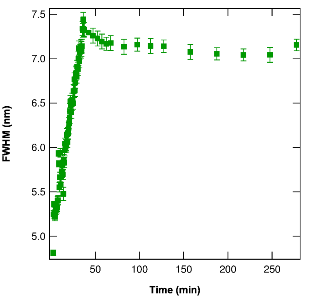
Along with the lasing wavelength redshifting during photodegradation, we also observe the lasing linewidth increasing, as shown in Figure 6. The FWHM is found to increase from 4.8 nm to 7.4 nm during degradation, and then to decrease slightly to 7.1 nm during recovery. The increase in linewidth suggests the addition of new lasing modes to the lasing emission, as the linewidth of IFRL depends on the number of active modes Cao03.02 ; Cao03.01 ; Ling01.01 ; Tureci08.01 ; Ignesti13.01 ; Redding11.01 . These new modes most likely arise due to new scattering resonances formed when the polymer is damaged and its refractive index is modified. The slight decrease during recovery can be explained by slow chemical/mechanical changes in the polymer after illumination is removed.
While the general trends of the linewidth and peak wavelength during photodegradation and recovery are consistent for both R6G+Y2O3/PU and a previous study on R6G+ZrO2/PU Anderson15.01 , we note that the magnitudes of the effects are quite different. Namely, for the ZrO2 NPs the emission experiences a redshift of approximately 3 nm and a linewidth increase of 0.8 nm, while for the Y2O3 NPs the emission experiences a redshift of 9 nm and a linewidth increase of 2.8 nm. In both cases the pump fluences are similar, suggesting that the mechanism behind the different magnitudes is related to the NPs dispersed in the two systems. One possible explanation is that the different sizes of the NPs (average diameter of ZrO2 NPs is 250 nm, while the average diameter of the Y2O3 NPs is 40 nm) influences the irreversible photodegradation of the polymer, which is the mechanism behind the wavelength’s redshift and linewidth’s broadening.
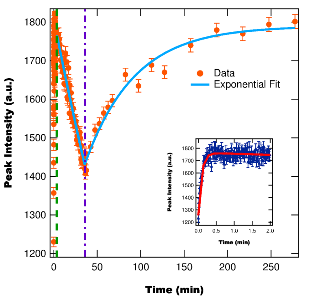
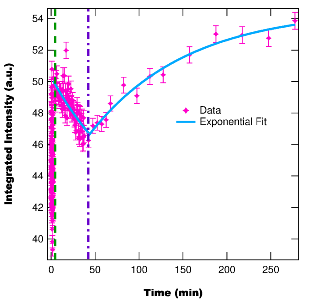
Due to the peak intensity fully recovering and the linewidth increasing, we find that the spectrally integrated intensity increases after a decay and recovery cycle. Figure 7 shows the integrated intensity as a function of time, with it recovering to a higher value than before degradation. Fitting the recovery curve to an exponential curve gives an asymptotic intensity that is times greater than the conditioned sample’s emission intensity. The observation of an enhanced integrated intensity due to photodegradation and recovery is consistent with previous measurements in R6G+ZrO2/PU Anderson15.01 .
The enhancement of the broadband IFRL intensity of R6G+NP/PU is of special importance to applications requiring high-intensity low-coherence light, such as optical coherence tomography Redding11.01 ; Redding12.01 and laser based projectors Hecht12.01 where scattering results in unwanted interference effects. Previously, it was demonstrated that broadening the RL emission of a system results in the light becoming less coherent, thereby minimizing the effects of interference due to scattering Redding12.01 . This implies that by increasing the linewidth of R6G+NP/PU’s RL emission – while maintaining peak intensity – photodegradation and recovery cycling results in the material having better broadband performance than the pristine material.
III.1 Photodegradation and recovery cycling
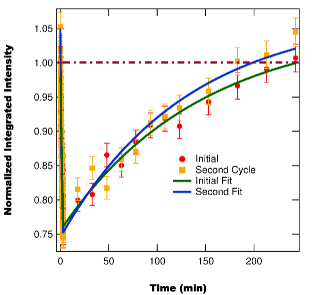
Based on the observation of an enhancement in the integrated intensity as a result of photodegradation and recovery, we perform measurements in which we put the material through two cycles of degradation and recovery to see how much enhancement can be achieved. Both cycles are performed using the same intensity and timing to make direct comparisons. Figure 8 shows the integrated intensity during decay and recovery for both cycles. During the first cycle the integrated intensity decays 29% at a rate of min-1, after which it recovers to a value times larger than the conditioned integrated intensity at a rate of min -1, which is within experimental uncertainty of the recovery rate determined for R6G+ZrO2/PU Anderson15.01 . After a period of twenty hours we cycle the sample once again and find that the integrated intensity now decays 37% at a rate of min-1, which is both more rapid and to a higher degree than the first cycle. After the second degradation the integrated intensity recovers at the same rate as the first cycle, but now to a value times larger than the conditioned integrated intensity, which is within uncertainty of the first cycle’s enhancement.
From these results we see that while the first decay and recovery cycle results in an enhancement of the integrated intensity, additional cycles contribute little, if any, additional enhancement. Additional measurements using different amounts of decay in the first degradation cycle support this observation. However, they also reveal that the amount of enhancement in the second cycle depends strongly on the amount of decay in the first cycle. Strong first decays result in little enhancement in the second decay, while light first decays result in larger enhancements in the second decay. These results suggest that continued cycling of the material results in the broadening linewidth reaching a steady state value, which stops further enhancement of the integrated intensity.
III.2 Lasing Threshold of the Recovered System
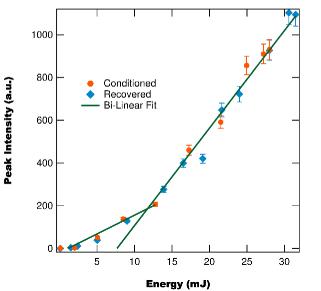
Thus far we have considered the emission properties of the system at a fixed pump intensity. Next we consider the peak intensity and linewidth as a function of pump energy in order to compare the lasing threshold of the conditioned and recovered sample.
We first measure the peak intensity as a function of pump energy for the conditioned and recovered sample, shown in Figure 9. From Figure 9 we see that the peak intensity curves of the conditioned and recovered samples overlay; with bi-linear fits of each giving lasing thresholds within uncertainty of each other ( mJ and mJ ). This suggests that the dye fully recovers, as the lasing threshold is very sensitive to the concentration of undamaged dye molecules Cao03.02 ; Yi12.01 ; Shank75.01 ; Anderson14.04 .
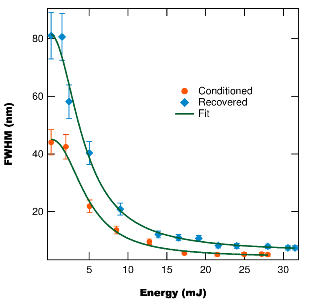
Next we measure the emission linewidth as a function of pump energy, shown in Figure 10, for both the conditioned and recovered samples. From Figure 10 we find that while the magnitude of the linewidth differs between the conditioned and recovered samples, the shape of the curves are consistent, with the half-max pump energy of both curves being within uncertainty of each other ( mJ and mJ). Once again this result suggests that the lasing threshold is unchanged due to decay and recovery, as the half-max pump energy is related to the lasing threshold Cao05.01 . Additionally, Figure 10 demonstrates that the recovery process is not reversible for all components of the sample, as the FWHM of the recovered sample is larger than the FWHM of the conditioned sample. If the photodegradation process was completely reversible the linewidth would be unchanged after recovery.
III.3 Material Characterization
Up to this point we have focused on the RL properties of R6G+Y2O3/PU during conditioning, decay, and recovery. However, these results can only go so far in illuminating the underlying mechanisms behind conditioning, decay and recovery. To gain further insight, we now turn to considering the linear optical properties of the system, namely the visual characteristics and IR-VIS absorbance.
III.3.1 Images and VIS absorbance.
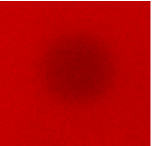
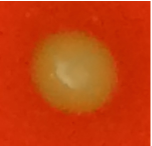
To visually chronicle the changes to the sample during irradiation, we first image the pristine sample. We then condition the sample for 5 s, block the pump and image the conditioned area. The pump beam is then unblocked and the sample is irradiated until the sample is sufficiently damaged, at which point it is once again imaged. Figure 11 shows the images of the pristine, conditioned, and damaged sample. From the images we see that conditioning results in a darkening of the sample, while further irradiation results in a yellowing of the damaged area. The darkening of the conditioned area suggests an increase in the absorption of the sample, while the yellowing of the decayed area suggests a decrease in absorption in the green-yellow region of the spectrum.

To verify these observations we perform surface absorbance measurements on a sample before conditioning, after conditioning, and finally after degradation. We begin by first measuring the reflected light from a silver mirror to obtain the spectrally flat reflected intensity from the sample plane. Next we replace the mirror with a sample and measure the spectral intensity of the reflected/emitted light from the sample, , which we use to calculate the surface absorbance given by,
| (1) |
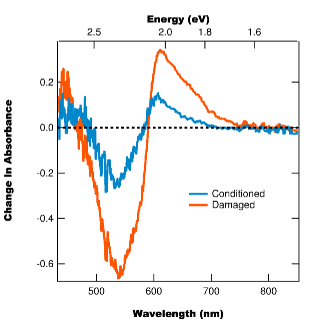
where is a factor used to account for the sample and mirror having different baseline reflectances. Figure 12 shows the absorption spectra for the three regimes, with fluorescence included in the absorption calculation, leading to some spectral regions having a negative absorbance value. From Figure 12 we see that as the sample is irradiated the absorption in the green-yellow region (500 nm to 600 nm) decreases, while the absorption in the red and blue spectral regions increases. To better display these changes we plot the change in absorbance (compared to the pristine sample) for the conditioned sample and damaged sample in Figure 13.
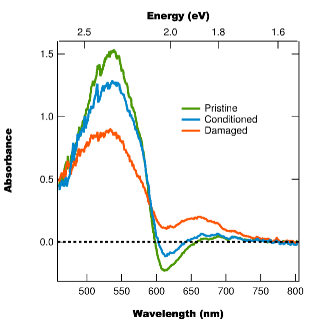
From Figure 12 and Figure 13 we observe that as the sample is irradiated the pristine absorbance peak decreases, while two new peaks are formed. This behavior is different than previously measured for irreversible photobleaching, where the absorbance peak decreases with no new peaks being formed Kurian02.01 ; Annieta05.01 ; George99.01 ; Ghorai13.01 . One possible explanation for the observed behavior is the photo-induced formation of J-Type dimers Gavrilenko06.01 ; Arbeloa88.01 ; Bojarski96.01 and/or trimers Arbeloa88.01 . When R6G forms dimers/trimers its absorbance spectrum redshifts, becomes broader, and has decreased absorbance at the monomer peak Gavrilenko06.01 ; Arbeloa88.01 ; Bojarski96.01 , which is what we observe. Additionally, the formation of R6G dimers is known to cause the fluorescence spectrum to redshift Bojarski96.01 ; Penzkofer87.01 , which can help to explain the observed redshift in the RL emission.
III.3.2 FTIR Measurements.
To identify underlying chemical changes in R6G+Y2O3/PU we use ATR-FTIR to measure the IR absorbance spectrum of the sample before, during, and after irradiation. Figure 14 shows the IR absorbance spectra for the pristine, conditioned, and damaged samples. Given the chemical makeup of R6G, we also measure the IR absorbance spectrum of Y2O3/PU with no dye (shown in Figure 15) to better determine the source of the IR absorbance peaks. However, from Figure 15 we find that the IR absorbance spectrum for both nanocomposites (without and with dye) are very similar, with the peak positions consistent between the two, suggesting that Y2O3/PU dominates the IR absorbance. This result is expected as the amount of dye present is relatively small compared to the amount of polymer and NPs. Given the lack of an obvious IR absorbance component due to R6G – with its contributions overwhelmed by the polymer – it is difficult to say definitively that observed changes are due to the dye and/or host. However, we find that the observed changes are consistent with previous studies of photodegradation in neat PU Rabek95.01 ; Nguyen02.01 ; Wang05.01 ; Decker99.01 ; Abuin72.01 ; Yang70.01 ; Laue05.01 and therefore we proceed with the assumption that the changes in the IR absorbance spectrum are due to the polymer and not the dye.
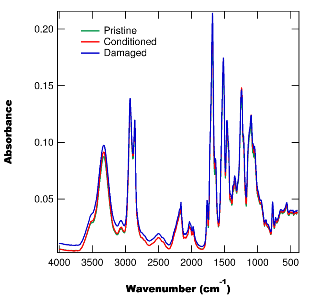
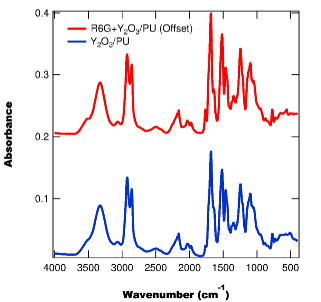
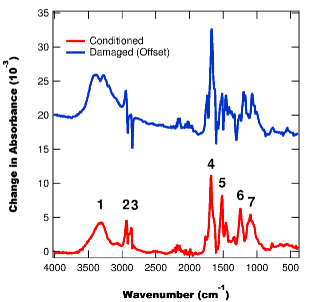
Figure 16 shows the change in IR absorbance of the sample due to conditioning and degradation. From Figure 16 we find that seven of the IR absorbance peaks from Figure 15 increase due to conditioning and further irradiation results in four of the peaks continuing to increase while the other three decrease. Table 1 lists the peak locations and their assignments. Based on the location and behavior of the peaks – as well as previous studies on neat polyurethane Rabek95.01 ; Nguyen02.01 ; Wang05.01 ; Decker99.01 – we can make several conclusions about the peak behavior:
-
1.
The broad peak centered at 3300 cm-1 is most likely due to the formation of amines Rabek95.01 ; Laue05.01 .
-
2.
The increase during conditioning in the peaks at 2944 cm-1 and 2858 cm-1 correspond to the formation of alkanes arising from the abstraction of -protons from carbonyl fragments Abuin72.01 ; Yang70.01 ; Laue05.01 . The subsequent decrease during further irradiation corresponds to decomposition of the alkanes due either to photooxidation Calvert08.01 or C-H bond rupture Mozumder03.01
-
3.
The increase of the peak at 1516 cm-1 during conditioning corresponds to an increase of N-H bonds, most likely due to photothermally induced curing of leftover monomer Pretsch00.01 . The subsequent decrease with further irradiation is consistent with chain scission of polyurethane Nguyen02.01 ; Wang05.01 .
-
4.
The increase in the peak at 1672 cm-1 corresponds to the formation of more C=O bonds, which occurs due to photooxidation Nguyen02.01 ; Decker99.01 .
-
5.
The peak at 1244 cm-1 is related to the polymerization of the PU and its increase is most likely due to photothermally induced curing of leftover monomer Pretsch00.01 .
-
6.
The increase at 1097 cm-1 could possibly be due to the formation of peroxides and hydroperoxides from photooxidation Pretsch00.01 ; Rabek95.01 ; Wicks07.01 ; Ranby75.01 ; Cutrone88.01 .
From these observations – and a review of the literature on photodegradation of neat polyurethanes – we can conclude that during irradiation the primary mechanism of irreversible polymer photodegradation is Norrish type I photocleavage Rabek95.01 ; Laue05.01 , with additional degradation occurring due to photooxidation Nguyen02.01 . We also conclude that during conditioning leftover monomer undergoes polymerization due to photothermal heating leading to increases in the peaks associated with polyurethane Pretsch00.01 . As the neat polymer is transparent at the pump wavelength, the most likely degradation pathway is via energy transfer between the dye and polymer Moshrefzadeh93.01 ; Gonzalez00.01 ; Chang01.01 ; Rabek95.01 with thermalization Fellows05.01 ; Ishchenko08.01 being the largest effect.
| Peak # | Center (cm-1) | Assignment |
|---|---|---|
| 1 | 3300 | N-H |
| 2* | 2944 | Alkanes |
| 3* | 2858 | Alkanes |
| 4 | 1672 | C=O |
| 5* | 1516 | N-H |
| 6 | 1244 | N-CO-O |
| 7 | 1097 | C-O-C or C-O-O |
IV Conclusions
Based on the various measurements we perform on the photodegradation and self-healing of R6G +Y2O3/PU we determine several important results:
-
1.
When the system is illuminated with intense light its RL emission first increases in amplitude, redshifts, and widens – in a process we call conditioning – after which the emission continues to redshift and widen, but now with the amplitude decreasing during decay.
-
2.
After degradation, the RL emission returns to its initial intensity, but the emission remains redshifted and widened.
-
3.
The net effect of the amplitude fully recovering and the linewidth increasing is an enhancement of the spectrally integrated intensity.
-
4.
Further cycling of the system through degradation and recovery will reach a stable level of enhancement beyond which no further enhancement occurs.
-
5.
Cycling is found to decrease the photostability of the system, while the recovery rate and efficiency is maintained.
-
6.
Degradation results in the pristine absorbance peak decreasing, while a new broadened and redshifted peak forms, which is consistent with the formation of R6G dimers and trimers.
-
7.
Changes in the FTIR spectrum suggest that both Norrish type I photocleavage and photooxidation are responsible for the irreversible photodegradation of the polymer host.
From these results we conclude that there are at least two species of damaged products formed during photodegradation: one reversibly damaged and the other one irreversibly damaged. Given the irreversible changes in the RL linewidth and peak location, as well as the irreversible changes in the IR-VIS absorbance, we can conclude that the irreversibly damaged species is primarily related to Norrish type I photocleavage and photooxidation of the polymer host, with additional changes due to the photoinduced formation of R6G dimers and trimers. Since the polymer host is transparent at the pump wavelength, its damage is most likely mediated by energy transfer between the dye and polymer Moshrefzadeh93.01 ; Gonzalez00.01 ; Chang01.01 ; Annieta ; Rabek95.01 ; Fellows05.01 ; Ishchenko08.01 . To further refine the identification of the irreversible damaged species we plan on performing dose-dependent studies using imaging Anderson11.01 , absorbance embaye08.01 ; Anderson14.02 ; Ramini11.01 , interferometry Anderson13.02 ; Anderson14.03 and FTIR.
As to the nature of the reversible portion of photodegradation, our current results remain inconclusive. However, the underlying mechanism is most likely similar to that proposed for DO11/PMMA. In that system, dye molecules are hypothesized to form domains of correlated molecules along polymer chains Ramini13.01 ; Anderson14.01 with reversible degradation resulting in the formation of charged fragments Desau09.01 ; Anderson14.01 . These fragments are confined in space by the polymer and recovery occurs when molecular interactions within a domain result in the recombination of the fragments Anderson14.01 . To determine if charged species are formed, and possibly identify them, we are planning degradation and recovery studies with an applied electric field Anderson13.01 .
V Acknowledgements
This work was supported by the Defense Threat Reduction Agency, Award # HDTRA1-13-1-0050 to Washington State University.
VI Compliance with Ethical Standards
Conflict of Interest: The authors declare that they have no conflict of interest.
References
- (1) P. K. R.V. Ambartsumian, N.G. Basov and V. Letokhov, “Lasers with non-resonant feedback,” IEEE Journ.of Quant.Electr. 2, 442–446 (1966).
- (2) V. Letokhov, “Light generation by a scattering medium with a negative resonant absorption.” Zh. Eskp. Teor. Fiz 53, 1442 (1967).
- (3) V. Letokhov, “Stimulated emission of an ensemble of scattering particles with a negative absorption,” Pis’ma Zh. Eksp. Teor. Fiz. 5, 262–265 (1967).
- (4) N. M. Lawandy, R. M. Balachandran, A. S. L. Gomes, and E. Sauvain, “Laser action in strongly scattering media,” Nature 368, 436–438 (1994).
- (5) H. Cao, X. Jiang, Y. Ling, J. Y. Xu, and C. M. Soukoulis, “Mode repulsion and mode coupling in random lasers,” Phys. Rev. B 67, 161101 (2003).
- (6) H. Cao, “Lasing in random media,” Waves in Random Media 13, R1–R39 (2003).
- (7) H. Cao, “Random lasers: development, features, and applications,” Opt. Photon. News 16, 24–29 (2005).
- (8) X. Meng, K. Fujita, S. Murai, and K. Tanaka, “Coherent random lasers in weakly scattering polymer films containing silver nanoparticles,” Phys. Rev. A 79, 053817 (2009).
- (9) H. Cao, Y. G. Zhao, S. T. Ho, E. W. Seelig, Q. H. Wang, and R. P. H. Chang, “Random laser action in semiconductor powder,” Phys. Rev. Lett. 82, 2278–2281 (1999).
- (10) Y. Ling, H. Cao, A. L. Burin, M. A. Ratner, X. Liu, and R. P. H. Chang, “Investigation of random lasers with resonant feedback,” Phys. Rev. A 64, 063808 (2001).
- (11) H. Cao, “Review on latest developments in random lasers with coherent feedback,” J. Phys. A: Math. Gen. 38, 10497–10535 (2005).
- (12) H. E. Türeci, L. Ge, S. Rotter, and A. D. Stone, “Strong interactions in multimode random lasers,” Science 320, 643–646 (2008).
- (13) E. Ignesti, F. Tommasi, L. Fini, S. Lepri, V. Radhalakshmi, D. Wiersma, and S. Cavalieri, “Experimental and theoretical investigation of statistical regimes in random laser emission,” Phys. Rev. A 88, 033820 (2013).
- (14) B. Redding, M. A. Choma, and H. Cao, “Spatial coherence of random laser emission,” Opt. Lett. 36, 3404 (2011).
- (15) B. Redding, M. A. Choma, and H. Cao, “Speckle-free laser imaging using random laser illumination,” Nature Photonics 6, 355 (2012).
- (16) J. Hecht, “Biomedical imaging: random laser produces speckle-free images,” www.laserfocusworld.com (2012).
- (17) D. V. Hoang, N. T. Phuong, and N. V. Phu, “Random lasers: Characteristics, applications and some research results,” COMPUTATIONAL METHODS IN SCIENCE AND TECHNOLOGY 2, 47–51 (2010).
- (18) M. Leonetti and C. Lopez, “Random lasing in structures with multi-scale transport properties,” Applied Physics Letters 101, 251120 (2012).
- (19) M. Leonetti and C. Lopez, “Active subnanometer spectral control of a random laser,” Applied Physics Letters 102, 071105 (2013).
- (20) M. Leonetti, C. Conti, and C. Lopez, “Random laser tailored by directional stimulated emission,” Phys. Rev. A 85, 043841 (2012).
- (21) M. Leonetti, C. Conti, and C. López, “Tunable degree of localization in random lasers with controlled interaction,” App. Phys. Lett. 101, 051104 (2012).
- (22) J. Andreasen, N. Bachelard, S. B. Bhaktha, H. Cao, P. Sebbah, and C. Vanneste, “Partially pumped random lasers,” International Journal of Modern Physics B 28, 1430001 (2014).
- (23) N. Bachelard, J. Andreasen, S. Gigan, and P. Sebbah, “Taming random lasers through active spatial control of the pump,” Phys. Rev. Lett. 109, 033903 (2012).
- (24) N. Bachelard, S. Gigan, X. Noblin, and P. Sebbah, “Adaptive pumping for spectral control of random lasers,” Nature 10, 426–431 (2014).
- (25) B. R. Anderson, R. Gunawidjaja, and H. Eilers, “Low-threshold and narrow linewidth diffusive random lasing in Rhodamine 6g dye-doped polyurethane with dispersed ZrO2 nanoparticles,” JOSA B 31, 2363–2370 (2014).
- (26) B. R. Anderson, R. Gunawidjaja, and H. Eilers, “Spatial light modulator controlled random lasing in Rhodamine 6g dye-doped polyurethane with dispersed ZrO2 nanoparticles,” in “Frontiers in Optics 2014,” (Optical Society of America, 2014), p. FTh3C.7.
- (27) R. M. Wood, Laser-Induced Damage of Optical Materials, Series in Optics and Optoelectronics (Taylor & Francis, Boca Raton, 2003).
- (28) E. W. Taylor, J. E. Nichter, F. D. Nash, F. Haas, A. A. Szep, R. J. Michalak, B. M. Flusche, P. R. Cook, T. A. McEwen, B. F. McKeon, P. M. Payson, G. A. Brost, A. R. Pirich, C. Castaneda, B. Tsap, and H. R. Fetterman, “Radiation resistance of electro-optic polymer-based modulators,” Appl. Phys. Lett. 86, 201122 (2005).
- (29) D. Avnir, D. Levy, and R. Reisfeld, “The nature of the silica cage as reflected by spectral changes and enhanced photostability of trapped Rhodamine 6g,” J. Phys. Chem 88, 5956–5959 (1984).
- (30) E. T. Knobbe, B. Dunn, P. D. Fuqua, and F. Nishida, “Laser behavior and photostability characteristics of organic dye doped silicate gel materials,” Appl. Opt 29, 2729–2733 (1990).
- (31) I. P. Kaminow, L. W. Stulz, E. A. Chandross, and C. A. Pryde, “Photobleaching of organic laser dyes in solid matrices,” Appl. Opt 11, 1563–1567 (1972).
- (32) J. F. Rabek and J.-P. Fouassier, Lasers in Polymer Science and Technology: Applications, Volume I (CRC Press, 1989).
- (33) G. D. Peng, Z. Xiong, and P. L. Chu, “Fluorescence Decay and Recovery in Organic Dye-Doped Polymer Optical Fibers,” J. Lightwave Technol. 16, 2365–2372 (1998).
- (34) B. Howell and M. G. Kuzyk, “Lasing Action and Photodegradation of Disperse Orange 11 Dye in Liquid Solution,” Appl. Phys. Lett. 85, 1901–1903 (2004).
- (35) B. Howell and M. G. Kuzyk, “Amplified Spontaneous Emission and Recoverable Photodegradation in Disperse-Orange-11-Doped-Polymer,” J. Opt. Soc. Am. B 19, 1790 (2002).
- (36) S.-T. Hung, S. K. Ramini, D. G. Wyrick, K. Clays, and M. G. Kuzyk, “The role of the polymer host on reversible photodegradation in Disperse Orange 11 dye,” in “SPIE Optics and Photonics: Organic Photonics + Electronics,” (San Diego, CA), 84741A.
- (37) Y. Zhu, J. Zhou, and M. G. Kuzyk, “Two-photon fluorescence measurements of reversible photodegradation in a dye-doped polymer,” Opt. Lett. 32, 958–960 (2007).
- (38) P. Kobrin, R. Fisher, and A. Gurrola, “Reversible photodegradation of organic light-emitting diodes,” Appl. Phys. Lett. 85, 2385 (2004).
- (39) B. R. Anderson, S. K. Ramini, and M. G. Kuzyk, “Imaging studies of photodamage and self-healing of anthraquinone derivative dye-doped polymers.” in “SPIE Laser Damage Symposium Proc.”, G. Exarhos, ed. (SPIE, Boulder, CO, 2011), [8190-16].
- (40) B. R. Anderson, R. Gunawidjaja, and H. Eilers, “Self-healing random lasers,” Optics Letters 40, 577–580 (2015).
- (41) A. C. Vutha, S. Tiwari, and R. Thareja, “Random laser action in ZnO doped polymer,” J. Appl. Phys 99, 123509 (2006).
- (42) B. R. Anderson, S.-T. Hung, and M. G. Kuzyk, “The effect of pump depletion on reversible photodegradation.” Opt. Com. 318, 180–185 (2014).
- (43) J. Yi, G. Feng, L. Yang, K. Yao, C. Yang, Y. Song, and S. Zhou, “Behaviors of the Rh6g random laser comprising solvents and scatterers with different refractive indices,” Optics Communications 285, 5276–5282 (2012).
- (44) F. Shuzhen, Z. Xingyu, W. Qingpu, Z. Chen, W. Zhengping, and L. Ruijun, “Inflection point of the spectral shifts of the random lasing in dye solution with TiO2 nanoscatterers,” Journal of Physics D: Applied Physics 42, 015105 (2009).
- (45) L. Dong, F. Ye, J. Hu, S. Popov, A. Friberg, and M. Muhammed, “Fluorescence quenching and photobleaching in Au/Rh6g nano-assemblies: impact of competition between radiative and non- radiative decay,” Journal of the European Optical Society 6, 11019 (2011).
- (46) C. V. Shank, “Physics of dye lasers,” Rev. Mod. Phys. 47, 649–657 (1975).
- (47) C. Bosshard, K. Sutter, P. Pretre, J. Hulliger, M. Florsheimer, P. Kaatz, and P. Gunter, Organic Nonlinear Optical Materials (Gordon and Breach Science Publishers, Basel, Switzerland, 1995).
- (48) A. Kurian, N. George, B. Paul, V. Nampoori, and C. Vallabhan, “Studies on fluorescence efficiency and photodegradation of Rhodamine 6g doped PMMA using a dual beam thermal lens technique,” Laser Chemistry 20, 99–110 (2002).
- (49) P. Annieta, L. Joseph, L. Irimpan, P. Radhakrishnan, and V. Nampoori, “Photoacoustic study on the photostability of polymethyl methacrylate films doped with Rhodamine 6g/Rhodamine b dye mixture system,” J. Phys. D: Appl. Phys. 38, 2904–2909 (2005).
- (50) N. A. George, B. Aneeshkumar, P. Radhakrishnan, and C. Vallabhan, “Photoacoustic study on photobleaching of Rhodamine 6g doped in poly(methyl methacrylate),” J. Phys. D: Appl. Phys. 32, 1745–1749 (1999).
- (51) T. K. Ghorai and N. Biswas, “Photodegradation of Rhodamine 6g in aqueous solution via SrCrO4 and TiO2 nano-sphere mixed oxides,” J. Mater. Res. Tech. 2, 10–17 (2013).
- (52) V. I. Gavrilenko and M. A. Noginov, “Ab initio study of optical properties of Rhodamine 6g molecular dimers,” The Journal of Chemical Physics 124, 044301 (2006).
- (53) F. L. Arbeloa, P. R. Ojeda, and I. L. Arbeloa, “Dimerization and trimerization of Rhodamine 6g in aqueous solution,” J. Chem. Soc.: Faraday Trans. 2 84, 1903–1912 (1988).
- (54) P. Bojarski, A. Matczuk, C. Bojarski, A. Kawski, B. Kuklinski, G. Zurkowska, and H. Diehl, “Fluorescent dimers of Rhodamine 6g in concentrated ethylene glycol solution,” Chemical Physics 210, 485 – 499 (1996).
- (55) A. Penzkofer and W. Leupacher, “Fluorescence behavior of highly concentrated Rhodamine 6g solutions,” Journal of Luminescence 37, 61–72 (1987).
- (56) J. F. Rabek, Polymer Photodegradation: Mechanisms and experimental methods (Springer-Science+Business Media, 1995).
- (57) T. Nguyen, J. W. Martin, E. Byrd, and E. Embree, “Effects of spectral uv on degradation of acrylic-urethane coatings,” in “Proceedings of the 80th Annual Meeting of the Program of the FSCT,” (2002).
- (58) L.-Q. Wang, G.-Z. Liang, G.-C. Dang, F. Wang, X.-P. Fan, and W.-B. Fu, “Photochemical degradation study of polyurethanes as relic protection materials by ftir-atr,” Chinese Journal of Chemistry 23, 1257–1263 (2005).
- (59) C. Decker and K. Zahouily, “Photodegradation and photooxidation of thermoset and uv-cured acrylate polymers,” Polymer Degradation and Stability 64, 293 – 304 (1999).
- (60) E. Abuin, M. Encina, and E. Lissi, “The photolysis of 3-pentanone,” Journal of Photochemistry 1, 387–396 (1972).
- (61) N.-C. Yang, E. D. Feit, M. H. Hui, N. J. Turro, and J. C. Dalton, “Photochemistry of di-tert-butyl ketone and structural effects on the rate and efficiency of intersystem crossing of aliphatic ketones,” Journal of the American Chemical Society 92, 6974–6976 (1970).
- (62) T. Laue and A. Plagens, Named Organic Reactions (John Wiley & Sons, 2005), 2nd ed.
- (63) J. G. Calvert, R. G. Derwent, J. J. Orlando, G. S. Tyndall, and T. J. Wallington, Mechanisms of Atmospheric Oxidation of the Alkanes (Oxford Univ. Press, 2008).
- (64) A. Mozumder and Y. Hatano, Charged Particle and Photon Interactions with Matter: Chemical, Physicochemical, and Biological Consequences with Applications (CRC Press, 2003).
- (65) E. Pretsch, P. Buhlmann, and C. Affolter, Structure Determination of Organic Compounds (Springer Verlang, 2000).
- (66) Z. W. Wicks, F. N. Jones, S. P. Pappas, and D. A. Wicks, Organic coatings: science and technology (John Wiley & Sons, 2007), 3rd ed.
- (67) B. Ranby and J. Rabek, Photodegradtion, photo-oxidation and photostabilisation of polymers, principles and application (Wiley-Interscience, 1975).
- (68) L. Cutrone, D. Moulton, and L. Simpson, “Studies on the influence of titanium dioxide on durability,” FATIPEC-Kongr 3, 23–46 (1988).
- (69) R. S. Moshrefzadeh, D. K. Misemer, M. D. Radcliffe, C. V. Francis, and S. K. Mohapatra, “Nonuniform photobleaching of dyed polymers for optical waveguides,” Appl. phys. lett. 62, 16–18 (1993).
- (70) A. Galvan-Gonzalez, M. Canva, G. I. Stegeman, R. Twieg, K. P. Chan, T. C. Kowalczyk, X. Q. Zhang, H. S. Lackritz, S. Marder, and S. Thayumanavan, “Systematic behavior of electro-optic chromophore photostability,” Optics Lett. 25, 332–334 (2000).
- (71) S.-C. Chang, G. He, F.-C. Chen, T.-F. Guo, and Y. Yang, “Degradation mechanism of phosphorescent-dye-doped polymer light-emitting diodes,” App. Phys. Lett. 79, 2088 (2001).
- (72) C. Fellows, U. Tauber, C. Carvalho, and C. Carvalhaes, “Amplified spontaneous emission of proton transfer dyes in polymers,” Brazilian Journal of Physics 35, 933 (2005).
- (73) A. A. Ishchenko, “Photonics and molecular design of dye-doped polymers for modern light-sensitive materials,” Pure Appl. Chem. 80, 1525–1538 (2008).
- (74) P. Annieta, L. Joseph, L. Irimpan, P. Radhakrishnan, and V. Nampoori, “Photosensitivity of laser dye mixtures in polymer matrix: a photoacoustic study,” .
- (75) B. R. Anderson, S. K. Ramini, and M. G. Kuzyk, “Imaging studies of photodamage and self-healing in Disperse Orange 11 dye-doped PMMA,” J. Opt. Soc. Am. B 28, 528–32 (2011).
- (76) N. Embaye, S. K. Ramini, and M. G. Kuzyk, “Mechanisms of reversible photodegradation in Disperse Orange 11 dye-doped in PMMA polymer,” J. Chem. Phys. 129, 054504 (2008).
- (77) S. K. Ramini, B. R. Anderson, and M. G. Kuzyk, “Recent progress in reversible photodegradation of Disperse Orange 11 when doped in PMMA.” in “SPIE Laser Damage Symposium Proc.”, G. Exarhos, ed. (SPIE, Boulder CO, 2011), [8190-18].
- (78) B. R. Anderson, E. Bernhardt, and M. G. Kuzyk, “A white light interferometric microscope for measuring dose-dependent reversible photodegradation,” J. Apl. Phys. 114, 123103 (2013).
- (79) B. R. Anderson and M. G. Kuzyk, “Mechanisms of the refractive index change in DO11/PMMA due to photodegradation,” Optical Materials 36, 1227–1231 (2014).
- (80) S. K. Ramini, B. R. Anderson, S. T. Hung, and M. G. Kuzyk, “Experimental tests of a new correlated chromophore domain model of self-healing in a dye-doped polymer,” Polymer Chemistry 4, 4948 (2013).
- (81) B. R. Anderson and M. G. Kuzyk, “Generalizing the correlated chromophore domain model of reversible photodegradation to include the effects of an applied electric field,” Phys. Rev E 89, 032601 (2014).
- (82) L. DesAutels, M. G. Kuzyk, and C. Brewer, “Femtosecond bulk transparent material processing and recovery,” Opt. Express 17, 18808–18819 (2009).
- (83) B. R. Anderson, S.-T. Hung, and M. G. Kuzyk, “Electric field dependent photodegradation and self healing of Disperse Orange 11 dye-doped PMMA thin films,” J. Opt. Soc. Am. B 30, 3193–3201 (2013).