To Cool is to Accrete:
Analytic Scalings for Nebular Accretion of Planetary Atmospheres
Abstract
Planets acquire atmospheres from their parent circumstellar disks. We derive a general analytic expression for how the atmospheric mass grows with time , as a function of the underlying core mass and nebular conditions, including the gas metallicity . Planets accrete as much gas as can cool: an atmosphere’s doubling time is given by its Kelvin-Helmholtz time. Dusty atmospheres behave differently from atmospheres made dust-free by grain growth and sedimentation. The gas-to-core mass ratio (GCR) of a dusty atmosphere scales as GCR , where (for not too close to 1) is the mean molecular weight at the innermost radiative-convective boundary. This scaling applies across all orbital distances and nebular conditions for dusty atmospheres; their radiative-convective boundaries, which regulate cooling, are not set by the external environment, but rather by the internal microphysics of dust sublimation, H2 dissociation, and the formation of H-. By contrast, dust-free atmospheres have their radiative boundaries at temperatures close to nebular temperatures , and grow faster at larger orbital distances where cooler temperatures, and by extension lower opacities, prevail. At 0.1 AU in a gas-poor nebula, GCR , while beyond 1 AU in a gas-rich nebula, GCR . We confirm our analytic scalings against detailed numerical models for objects ranging in mass from Mars () to the most extreme super-Earths (10–), and explain why heating from planetesimal accretion cannot prevent the latter from undergoing runaway gas accretion.
1. Introduction
The Kepler mission has discovered that at least 50% of Sun-like stars harbor “super-Earths”—here defined as planets having radii 1– (e.g., Fressin et al., 2013).111What we call “super-Earths” are sometimes sub-divided into “super-Earths” and the larger “mini-Neptunes”. We do not make this distinction here. Their masses, measured by transit timing variations (e.g., Hadden & Lithwick, 2014) and Doppler radial velocities (e.g., Weiss & Marcy, 2014), imply bulk densities that are typically g cm-3. These densities are too low to be compatible with a pure rock composition. The consensus view (see also Rogers, 2015) is that the masses of super-Earths are dominated by their solid cores — of mass – and radius – — while their total radii can be more than doubled by voluminous, hydrogen-rich atmospheres. Interior models suggest gas-to-core mass ratios (GCRs) up to 10% (e.g., Lopez & Fortney, 2014) and more typically 1% (Wolfgang & Lopez, 2015).
Unlike the Earth’s atmosphere (GCR ), the atmospheres of extrasolar super-Earths are likely too massive to have been outgassed from rock (e.g., Rogers & Seager, 2010). More plausibly, super-Earth atmospheres originated as the envelopes of gas giants like Jupiter did, by accretion from the primordial nebula. Studies of nebular accretion (e.g., Ikoma & Hori, 2012; Bodenheimer & Lissauer, 2014; Inamdar & Schlichting, 2015) find that super-Earth cores can accrete atmospheres having GCRs of 1–10% before the gas disk dissipates on Myr timescales. Even higher GCRs can be obtained under a variety of conditions (Lee et al., 2014). These higher values may be required because once the parent nebula disperses and planets are laid bare, atmospheric loss driven by stellar irradiation (e.g., Lopez & Fortney, 2013; Owen & Wu, 2013) and by the young planet’s heat of formation (Owen & Wu, 2015) can pare GCRs down by factors of several or more.
Lee et al. (2014), hereafter paper I, computed nebular accretion histories for a range of core masses, disk temperatures and densities, and atmospheric metallicities and dust contents. Our aim here, in paper II, is to provide an analytic understanding of their numerical results. Benefiting from hindsight, we will reduce our model to a few essential elements and obtain simple power-law scalings between GCR, time , core mass , and metallicity . These scalings will be derived against a variety of backdrops: gas-rich vs. gas-poor nebulae; dusty vs. dust-free atmospheres; close-in vs. far-out orbital distances.
Before we present these scaling relations (Section 2), we revisit the fundamental assumption underlying them: that the nascent atmospheres have no power source but passively cool by radiating into their nebular wombs. One source of power that we ignore — but that is commonly invoked in the literature — is the accretion of planetesimals. Paper I provided reasons why planetesimal accretion could plausibly be dropped when considering the origin of super-Earth atmospheres; in Section 1.1 below, we flesh these arguments out more fully and quantitatively. Readers interested in the main results of this paper can skip ahead to Section 2 which derives the GCR scalings for passively cooling atmospheres, and to Section 3 which contains a recapitulation with commentary.
1.1. Planetesimal Accretion
Paper I articulated one of the main puzzles posed by super-Earths: how, despite their large core masses, they avoided being transformed into Jupiter-mass giants by runaway gas accretion, and instead had their GCRs stabilized at values of several percent.
One way to stop an atmosphere from growing is to supply it with sufficient heat — enough to balance cooling and arrest secular contraction. The energy released by the accretion of planetesimals is a candidate heat source. We can estimate the required rates of mass delivery by equating the accretion luminosity
| (1) |
to the cooling luminosity , where the latter is computed from the models presented in paper I. Here is the gravitational constant. Equation (1) assumes that planetesimals are large enough to penetrate the atmosphere and release their kinetic energy at the core surface.
Figure 1 displays the planetesimal accretion rates so estimated, using the dusty atmosphere models from paper I (dust-free atmospheres will be considered shortly). Every curve exhibits a minimum in with GCR; this minimum corresponds to the minimum in with time that appears in all passively cooling and growing atmospheres (see also Piso & Youdin, 2014) and that we used in paper I to mark the onset of runaway gas accretion. To the left of the minima, the increasing atmospheric density with increasing GCR renders the envelope more opaque and causes to drop (see Section 3.1 of paper I and Section 2 of this paper). To the right of the minima, at GCR , the self-gravity of the gas envelope becomes significant, and larger is required to balance stronger gravity.
The curves in Figure 1 represent the loci of thermal equilibrium: atmospheres are stabilized at a given GCR when solids rain down at the corresponding . We now consider the stability of these equilibria. To the left of the minima, at lower GCR, equilibria are stable; for example, a perturbation to higher GCR decreases below (which is presumed fixed), resulting in a net heating that expands the atmosphere and lowers the GCR back down to its equilibrium value. To the right of the minima, at higher GCR, there are no stable equilibria because increases with both GCR and . As increases from planetesimal accretion, rises rapidly (see Section 3.2.3 of paper I and Section 2 of this paper), outpacing and triggering runaway.
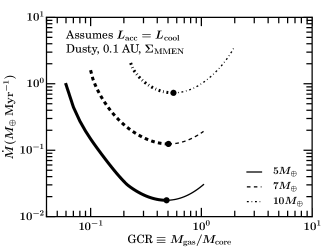
The values of to the left of the minima in Figure 1 represent possible solutions to the puzzle of how super-Earths avoided runaway gas accretion. But we find these solutions unsatisfactory for a couple of reasons. The first is that planetesimal accretion rates must be fine-tuned to the values plotted. Why, for example, should cores accrete /Myr in solids to have their GCRs stabilized at 0.1? Planetesimal accretion rates are influenced by a host of factors (e.g., Goldreich et al., 2004), and most estimates lead to rates orders of magnitude higher than the ones plotted in Figure 1 (see, e.g., Appendix A of Rafikov, 2006). The much higher accretion rates are natural consequences of the high disk surface densities and short orbital times characterizing the small orbital distances where Kepler super-Earths are found, and lead us to surmise that planetesimals are fully incorporated into planets on timescales much shorter than the 1–10 Myrs required for atmospheres to cool and grow.222Our discussion here pertains to “planetesimals”, not to the larger protocores which are thought to assemble into super-Earth cores by “major mergers”. Such mergers take place over a wide range of timescales that can overlap or even exceed gas disk lifetimes, depending sensitively on the disk’s solid surface density (Dawson et al., 2015). Energy release from the last major merger could, in principle, provide a significant source of heat to stop gas accretion (Inamdar & Schlichting, 2015), but only if the core transports its internal energy outward on a timescale comparable to the atmospheric cooling time of 1–10 Myr. The actual energy transport timescale of the core is highly uncertain, depending on the unknown viscosity (see paper I, section 3.1.2).
The second reason we do not find planetesimal accretion attractive is that it bites off more than it can chew: Figure 1 implies that a core has to accrete planetesimals at such a high rate that it doubles in mass within the disk lifetime of Myr. The core that results is certain to undergo runaway gas accretion in a disk that is gas-rich (i.e., with a gas surface density comparable to that of the minimum-mass solar nebula).
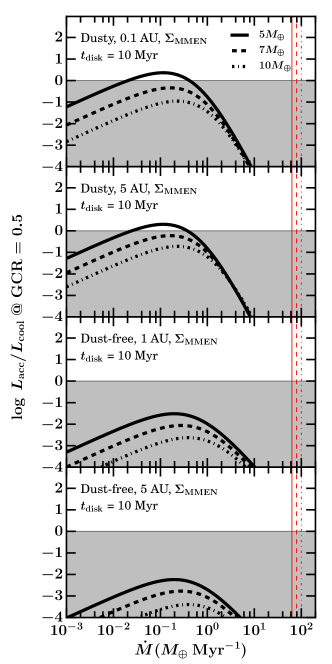
We can illustrate with another calculation how planetesimal accretion leads to problems of fine-tuning and runaway gas accretion. An atmosphere does not grow if . In particular, runaway is avoided if when , the critical GCR above which envelope self-gravity starts becoming significant. We therefore evaluate the ratio when GCR = 0.5, presuming the core has accreted planetesimals at a constant rate for the preceding time :
| (2) |
where is evaluated using our atmospheric models for the final core mass . (This evaluation uses the scaling relation between and as derived in Section 2 below.) Figure 2 plots against . Cores of initial mass can avoid runaway — but only if their atmospheres are dusty, and if is tuned to a narrow range. This window closes completely for cores of initial mass : such cores will inevitably undergo runaway within 10 Myr in gas-rich disks, regardless of the magnitude of planetesimal accretion or their proximity to their central stars. These conclusions are only amplified for cores with dust-free atmospheres. We will elaborate in Section 2 on these trends with nebular environment and atmospheric composition. The point here is that planetesimal accretion does not generically prevent runaway. Avoiding runaway for even low-mass cores with requires delicate adjustment of which seems difficult to achieve under general circumstances. We are motivated therefore to study gas accretion histories that omit planetesimal accretion — this is the main subject of this paper, to which we now turn.
2. Scaling Relations for GCR (
We derive general scaling relations for how the gas-to-core mass ratio GCR varies with core mass , time , and metallicity , in the absence of external heating. The derivation is semi-analytic in that a few parameters will be calibrated using our numerical models (see paper I for details on how we build our numerical models).
Accretion is mediated by cooling: upon radiating away its energy, a planet’s atmosphere contracts, allowing nebular gas to refill the Hill sphere. The system self-regulates so that whatever atmosphere of mass has been accreted has a cooling time equal to the time that has elapsed:
| (3) |
where is the atmosphere’s total energy and is its luminosity. Statement (3) is perhaps more easily understood by considering the inverse cases (GCR is overestimated because not enough time has elapsed to accrete such a thick atmosphere) and (GCR is underestimated because there is plenty of time for the atmosphere to continue cooling and growing).
The relevant cooling time is that of the innermost convective zone which contains most of the atmosphere’s mass and energy. To estimate , we use the fact that in hydrostatic equilibrium, an atmospheric mass has a total energy of order its gravitational potential energy:
| (4) |
where is the gravitational constant. What should we choose: the core radius or the radiative-convective boundary ?333The outer radius of our numerical models is either the Bondi or Hill radius, whichever is smaller. Neither of these radii enters into our analytic theory, since not much mass is situated near the outer boundary. The answer depends on how steep the density profile is. For fixed adiabatic index , the density profile in the isentropic convective zone follows
| (5) |
where is the density at the radiative-convective boundary (rcb), is the adiabatic gradient, , and are the temperature and mean molecular weight evaluated at the rcb, is Boltzmann’s constant, and is the atomic mass of hydrogen. Now because and (the last equality follows from hydrostatic equilibrium), equation (5) can be approximated as
| (6) |
where . Equation (6) implies that if , then the atmosphere’s mass is concentrated near rather than near . We find that the convective zones of all our numerical models are indeed characterized by : the adiabatic gradient drops at temperatures exceeding 2500 K as energy is spent dissociating H2 rather than heating the gas. Therefore we choose in equation (4):444This is contrary to equation (32) in paper I which mistakenly assumes the atmosphere’s mass is concentrated near instead of near . The correction lengthens the runaway time estimated in that equation by a factor of 10, bringing it into closer agreement with the numerical result cited there.
| (7) |
where and is the bulk density of the core (assumed constant for this paper; we neglect the small variation of core density with core mass; see, e.g., Valencia et al. 2006 and Fortney et al. 2007).
We now examine . The rcb controls the rate at which the innermost convective zone cools. Very little luminosity is generated above the rcb (as verified in paper I, section 3.1.2), so we evaluate at the rcb:
| (8) |
where is the Stefan-Boltzmann constant and is the opacity at the rcb. We parameterize the latter as
| (9) |
where the various constants depend on microphysics which vary from case to case (details to be given in the subsections below).
We relate to GCR as follows. The total atmospheric mass in the inner convective zone is
| (10) |
where we substituted (6). Then
| (11) |
When all the hydrogen is molecular, the mean molecular weight depends on as:
| (15) | ||||
where and are the hydrogen and helium mass fractions, respectively. The prefactor of 0.06 for corresponds to the contribution from atomic metals using the abundances of Grevesse & Noels (1993); these abundances are the ones adopted by Ferguson et al. (2005), whose opacities we use.
Collecting (2) and (2) into (3) yields
| (16) |
which we invert to arrive at our desired relation for GCR as a function of and , valid for GCR :555Retaining the dependence on and adopting (Valencia et al., 2006) yields GCR . This correction hardly changes the dependence of GCR on ; for example, for dusty atmospheres, GCR instead of (see later subsections).
| (17) |
We have introduced a dimensionless fudge factor which we will normalize against our numerical models. The parameters that vary most from one scenario to another are the opacity constants in equation (9), and the rcb variables and . All these input constants will be drawn from our numerical solutions.
The following subsections examine how equation (2) plays out in various formation environments. We consider dusty vs. dust-free atmospheres in gas-poor vs. gas-rich nebulae at small orbital distances and large. The plausibility of these scenarios is not assessed; that exercise is deferred to a later study (paper III). In “dusty” models, we assume the ISM-like grain size distribution of Ferguson et al. (2005), and in dust-free models, we assume all metals to be in the gas phase. By “gas-rich” we mean a nebula whose gas surface density equals that of the minimum-mass extrasolar nebula (MMEN; see equation 12 of paper I; for comparison, the Hayashi 1981 nebula is 7 less dense), and by “gas-poor” we mean a nebula whose gas content is smaller (one whose gas mass equals its solid mass). Nebular temperatures are taken from equation (13) of paper I ( K at orbital distances AU).
2.1. Dusty Atmospheres
Dusty atmospheres are high opacity atmospheres and tend to be convective in their upper layers. They cease being dusty at depths below which temperatures are high enough for dust sublimation. The disappearance of grains causes the opacity to drop by two orders of magnitude; the sudden transparency opens a radiative window at depth. This radiative zone appears universally over all core masses and orbital distances as long as the upper layers are dusty. The base of the radiative zone — i.e., the innermost radiative-convective boundary — is located where H2 dissociates and H- appears with its strongly temperature-sensitive opacity:
| (18) |
Equation (18), obtained by numerically fitting the tabulated opacities of Ferguson et al. (2005), defines the relevant opacity constants when evaluating equation (2) for dusty atmospheres. Also characterizing dusty models is K: the temperature at which H2 dissociates.
2.1.1 Dusty and Gas-Poor from 0.1–1 AU
Substituting K and the parameters from (18) into (2), and further restricting our attention to gas-poor nebulae for which the gas surface density is 1/200 that of the MMEN, we find
| (19) |
Here we have fixed and (cf. Figure 3 of paper I which shows that ranges from 1.2 to 1.3 inside the innermost convective zone; although that figure pertains to a gas-rich nebula, similar values of are obtained in a gas-poor nebula). In writing (2.1.1), the last parameter to be calculated is the overall normalization ; the best agreement with our numerical models is obtained for between ( AU) and ( AU). (We cannot calibrate for AU in gas-poor nebulae because the relevant densities fall below those in our opacity tables.)
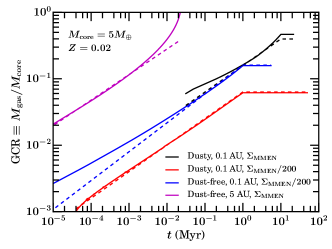
Figures 3, 4, and 5 demonstrate how well our semi-analytic scaling relation (2.1.1) does in reproducing the full numerical results. We emphasize that the exponents in equation (2.1.1) are not merely fit parameters, but follow from the physical considerations underlying equations (3)–(18).
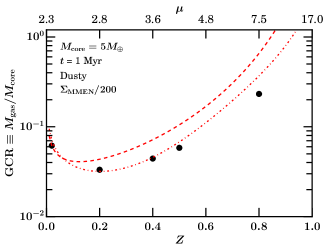
Interestingly, we see in Figure 4 that the dependence of GCR on at fixed time Myr differs across . Atmospheres atop core masses have cooled to their isothermal endstates and have stopped accreting before the sampled time; their GCRs have reached their maximum values.
2.1.2 Dusty and Gas-Rich from 0.1–5 AU
This case is almost identical to the case considered above. The only change in going from gas-poor () to gas-rich conditions () is that the fitted normalizations are higher, running from (0.1 AU) to 2 (1 AU) to 1.8 (5 AU):
| (20) |
This scaling relation is compared against the numerical model in Figures 3 and 4; the agreement is good.
Without the fudge factor to mop up discrepancies, our derivation states that conditions at the rcb are independent of the nebular environment — i.e., K and are determined by the microphysics governing the conversion of H2 to H-, and as given by equation (11) does not depend on the outer boundary conditions. These statements are largely but not completely true. In reality, there is a slight dependence of on the nebular density (as noted in paper I). For the same core mass, GCR, and outer boundary radius, a larger implies a shallower atmospheric density profile. Then the density at the rcb (whose temperature is assumed fixed at K) should be lower; in turn, the lower reduces the optical depth and thereby enhances the cooling luminosity (equation 2). This explains qualitatively why the GCR (equivalently, ) is a few times larger for the gas-rich case than for the gas-poor case, all other factors being equal.
Figure 3 also illustrates how the threat of runaway gas accretion is greater in gas-rich disks, not only because they produce slightly faster cooling = slightly faster accreting atmospheres, but also because they last longer than gas-poor disks. A 10 longer lifetime enables the GCR to grow by an extra factor of . The final GCR shown for the gas-rich case skirts dangerously close to the runaway value (formally evaluated to be 0.48; paper I). Although the curves for dusty atmospheres shown in Figure 3 refer only to 5 cores at 0.1 AU, the same propensity to runaway applies to dusty 5 planets at all orbital distances out to 5 AU ( hardly varies between 0.1 AU and 5 AU).
Note that Piso et al. (2015) quoted a much larger critical core mass of 30 at 5 AU in a dusty nebula (see their Figure 7). We have traced the origin of the discrepancy to three sources. First, Piso et al. (2015) used the analytic opacity model of Bell & Lin (1994) which, unlike the Ferguson et al. (2005) opacities that we use, does not account for different sublimation temperatures of different dust species and appears to overestimate at the rcb. Their higher suppresses cooling relative to our models. Second, these authors defined the runaway time as the moment when falls to 10% of its maximum value. This time appears systematically longer than our —defined as the time when attains its minimum—by factors of 2–3. We prefer our definition as the minimum has physical significance: it divides stable from unstable thermal equilibria in the presence of planetesimal accretion (see discussion surrounding our Figure 1). Finally, Piso et al. (2015) compared their against a disk lifetime of Myr, whereas we adopt Myr for our gas-rich models.
2.2. Dust-Free Atmospheres
Dust-free atmospheres behave qualitatively differently from dusty atmospheres. Removing dust as a source of opacity (either through grain growth or sedimentation; e.g., Mordasini 2014; Ormel 2014) renders the outermost atmospheric layers entirely radiative. The only rcb of the atmosphere sits at the base of this radiative and nearly isothermal outer shell: , the temperature at the atmosphere’s outer boundary, set by the ambient disk. Not surprisingly, how the GCR evolves depends more sensitively on nebular conditions for dust-free atmospheres than for dusty atmospheres, as the latter are buffered by the radiative window opened by dust sublimation (Section 2.1). Here we quote fitting formulae for and evaluate our GCR scaling relation (2) for dust-free atmospheres under various nebular conditions.
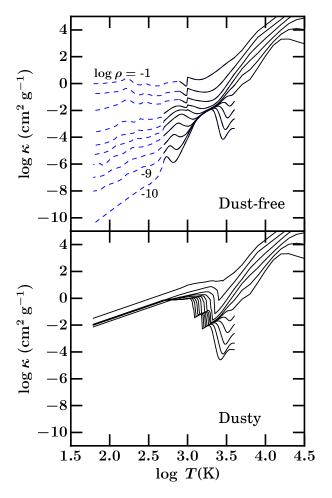
The opacities underlying our models are drawn from Ferguson et al. (2005) and Freedman et al. (2014). We employ the former for (the domain of their tabulations), and the latter for colder temperatures. A smooth merging of the two datasets is effected by offsetting all of the data from Freedman et al. (2014) to match the Ferguson et al. (2005) data at . Depending on , the offset in ranges from 0.1 to 0.4 dex. If no numerically tabulated value for is available for a desired below , we use the analytic fits given by equations (3)–(5) of Freedman et al. (2014); above , we extrapolate following the procedure described in paper I.
The top panel of Figure 6 plots the dust-free . We surmise the following features. At , the main absorbers are water, methane, and ammonia whose lines are pressure broadened. At , atomic alkali metals dominate the opacity (see Freedman et al., 2014, their Figure 1). The spike in that the alkalis produce is washed out at large , presumably from pressure broadening. At still higher , H- reigns, as it does for dusty atmospheres.
Two-dimensional power laws fitted to in restricted domains of are presented below. It is assumed throughout that ; Freedman et al. (2014) found a nearly linear -dependence for –3000 K.
2.2.1 Dust-Free and Gas-Poor at 0.1 AU
For dust-free atmospheres at 0.1 AU,
| (21) |
valid for and . The corresponding GCR is
| (22) |
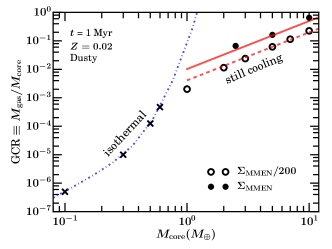
where the nominal values for and are drawn from our full numerical model at 0.1 AU (for comparison, K), and where we have calibrated . Equation (2.2.1) is plotted against the full numerical solution in Figure 3.
The quoted above is most relevant for gas-poor disks at 0.1 AU whose surface densities . The opacity behaves differently in gas-rich disks. We do not present results for dust-free atmospheres in gas-rich disks at 0.1 AU because such atmospheres stay fully convective for GCRs at least up to 0.3 and cannot be evolved using our numerical model. There would not be much point to following them anyway, since the combination of dust-free and gas-rich conditions leads to rapid runaway.
2.2.2 Dust-Free and Gas-Rich Beyond 1 AU
Outside 1 AU, temperatures fall. For and ,
| (23) |
whence
| (24) |
where the nominal (equivalently, ) represents a rough average over our dust-free numerical models at distances AU. The numerical models also indicate that at these large distances, nearly equals ; more distant planets have more nearly isothermal outer layers. Equation (2.2.2), normalized for nebular conditions at 5 AU, is tested against the full numerical solution in Figure 3.
Equation (2.2.2) highlights just how susceptible dust-free super-Earths are to runaway at large distances in gas-rich disks. At 5 AU, K and a core will attain GCR 0.5 in as short a time as 0.05 Myr. (We do not present solutions for gas-poor disks at large distances because the relevant gas densities fall below those covered by our opacity tables. It is easy, however, to guess what these solutions would look like: GCRs would increase on timescales almost as fast as those in gas-rich disks, and would be limited only by the gas available and the remaining disk lifetime.)
3. Summary
We have developed an analytic model describing how a solid core accretes gas from its parent disk. The model assumes that the planet’s growing atmosphere cools passively: heat inputs from external sources such as planetesimal accretion are ignored. Heating from planetesimal accretion can be relevant for low-mass cores, but only under exceptionally fine-tuned conditions. Too high a planetesimal accretion rate leads to excessively massive cores which undergo runaway, while too low an accretion rate is energetically irrelevant. The window for planetesimal accretion to be relevant is so narrow — it vanishes completely for core masses , which cannot help but undergo runaway in gas-rich disks that persist for 10 Myr — that neglecting energy deposition by solids is almost certainly safe.
We derived how the gas-to-core mass ratio (GCR) varies with time , core mass , and metallicity for passively cooling atmospheres. The scaling relationship, given by equation (2), applies in various formation environments at times preceding the onset of runaway gas accretion (at times when the envelope’s self-gravity is still negligible, i.e., when GCR ). The analytic results agree with numerical calculations to within factors of 1–3.
Three physical ingredients make our derivation possible. (1) To cool is to accrete: in the absence of any heat source, atmospheres of mass grow on a timescale equal to their cooling time: , where is the atmosphere’s energy and is its cooling luminosity. The final GCR is then set by the condition that the atmosphere’s cooling time equals the gas disk’s depletion time . (2) Most of the mass of the atmosphere is concentrated toward the core, whose given properties provide an easy reference for scaling our variables. The mass concentration follows from density gradients made steep by the dissociation of H2 and the consequent lowering of the adiabatic index down to 1.2–1.3. (3) The cooling luminosity is regulated by the radiative-convective boundary (rcb) and therefore can be evaluated there. Specifying the microphysical properties of this boundary (temperature, opacity) enables us to quantify the rate of cooling.
The scaling indices of GCR (, , ) are determined by the innermost convective zone’s adiabatic index (calibrated using our numerical models) and the dependencies of the opacity at the rcb. Dusty atmospheres have rcb’s that are distinct from those of atmospheres rendered dust-free by grain growth and sedimentation. In dusty atmospheres (Section 2.1), the rcb occurs universally — at all orbital distances and in gas-rich or gas-poor nebulae — at the H2 dissociation front, setting the temperature K. The rcb in dusty atmospheres is insensitive to external nebular conditions because dust sublimation opens a radiative window in the interior of the planet, whose base (the rcb) is determined by the local microphysics of how H2 converts into H- whose opacity rises sharply with temperature. All dusty atmospheres evolve as GCR : the scaling indices apply globally. Note that the mean molecular weight depends inversely on so that all other factors being equal, GCR first decreases with (as ; this dependence arises from opacity) and then increases (via ) as atmospheres become “heavier”.
Dust-free atmospheres (Section 2.2) are more transparent in their outer layers and their rcb’s are located at higher altitudes: conveniently, , the given temperature of the ambient nebula. For dust-free atmospheres, the dependence of rcb properties on nebular properties implies that the GCR scaling indices change with orbital distance, depending on the behavior of the local opacity. We examined two cases. At 0.1 AU in a gas-poor nebula, GCR . Beyond 1 AU in a gas-rich nebula, GCR . For all the cases we evaluated, GCR . The GCR- scaling is determined by the - scaling (see equation 2). It appears the latter scaling does not change much across environments ( where –0.6; this appears to be an average between characterizing pressure-broadened opacities at K and characterizing the opacity at K; see Figure 7 of Freedman et al. 2014).
While dusty atmospheres behave more-or-less the same way under a variety of nebular conditions, dust-free atmospheres depend more sensitively on disk temperatures. Gas opacities tend to decrease with colder temperatures and therefore dust-free atmospheres grow faster the farther they are from their central stars.
Atmospheres accrete faster in gas-rich environments than in gas-poor ones, but not by much. For example, in our numerical models of dusty atmospheres, dropping the nebular density by a factor of 200 drops the GCR by a factor of 2.5, all other factors being equal. We have checked that similar results obtain for dust-free atmospheres. Without introducing a normalization correction (our factor of in equation 2), our analytic scalings for dusty atmospheres would predict no dependence at all on the ambient nebular density (see Section 2.1.2 for the technical reason why in reality there is a small dependence). The insensitivity to nebular density suggests that the accretion of planetary atmospheres proceeds about the same way whether or not planets open gaps in disks. Gap opening in viscous gas disks does not starve the planet; it is well-recognized that material continues to flow past the planet, through the gap (e.g., Lubow & D’Angelo, 2006; Duffell et al., 2014). Moreover, the factors by which densities are suppressed in gaps are likely overestimated in 2D simulations (e.g., Kanagawa et al., 2015): 3D gaps are messier. Careful studies of the 3D flow dynamics of planets embedded in disks (e.g., D’Angelo & Bodenheimer, 2013; Ormel et al., 2015; Fung et al., 2015) are clearly needed to test whether gap opening and/or hydrodynamic effects substantively alter the 1D accretion theory we have presented.
The analytic solutions for gas-to-core ratios developed here enable us to calculate the properties of planetary envelopes just before protoplanetary disk gas disperses. The solutions — encapsulated in the condition — provide initial conditions for models of subsequent atmospheric loss by hydrodynamic winds powered by stellar irradiation or internal heat (Owen & Wu, 2013, 2015). Our model complements studies that include detailed molecular chemistry (e.g., Hori & Ikoma, 2011; Venturini et al., 2015); we find good agreement with those models for up to 0.5. The simplicity of our solutions make them suitable for the construction and/or diagnosis of more realistic models that include 3D hydrodynamic effects (e.g., D’Angelo & Bodenheimer, 2013; Ormel et al., 2015; Fung et al., 2015). The solutions can also be used to quickly assess the plausibility of various planet formation scenarios. This is the task we set ourselves for paper III.
References
- Bell & Lin (1994) Bell, K. R., & Lin, D. N. C. 1994, ApJ, 427, 987
- Bodenheimer & Lissauer (2014) Bodenheimer, P., & Lissauer, J. J. 2014, ApJ, 791, 103
- D’Angelo & Bodenheimer (2013) D’Angelo, G., & Bodenheimer, P. 2013, ApJ, 778, 77
- Dawson et al. (2015) Dawson, R. I., Chiang, E., & Lee, E. J. 2015, ArXiv e-prints, arXiv:1506.06867
- Duffell et al. (2014) Duffell, P. C., Haiman, Z., MacFadyen, A. I., D’Orazio, D. J., & Farris, B. D. 2014, ApJ, 792, L10
- Ferguson et al. (2005) Ferguson, J. W., Alexander, D. R., Allard, F., et al. 2005, ApJ, 623, 585
- Fortney et al. (2007) Fortney, J. J., Marley, M. S., & Barnes, J. W. 2007, ApJ, 659, 1661
- Freedman et al. (2014) Freedman, R. S., Lustig-Yaeger, J., Fortney, J. J., et al. 2014, ApJS, 214, 25
- Fressin et al. (2013) Fressin, F., Torres, G., Charbonneau, D., et al. 2013, ApJ, 766, 81
- Fung et al. (2015) Fung, J., Artymowicz, P., & Wu, Y. 2015, ArXiv e-prints, arXiv:1505.03152
- Goldreich et al. (2004) Goldreich, P., Lithwick, Y., & Sari, R. 2004, ARA&A, 42, 549
- Grevesse & Noels (1993) Grevesse, N., & Noels, A. 1993, in Origin and Evolution of the Elements, ed. N. Prantzos, E. Vangioni-Flam, & M. Casse, 15–25
- Hadden & Lithwick (2014) Hadden, S., & Lithwick, Y. 2014, ApJ, 787, 80
- Hayashi (1981) Hayashi, C. 1981, Progress of Theoretical Physics Supplement, 70, 35
- Hori & Ikoma (2011) Hori, Y., & Ikoma, M. 2011, MNRAS, 416, 1419
- Ikoma & Hori (2012) Ikoma, M., & Hori, Y. 2012, ApJ, 753, 66
- Inamdar & Schlichting (2015) Inamdar, N. K., & Schlichting, H. E. 2015, MNRAS, 448, 1751
- Kanagawa et al. (2015) Kanagawa, K. D., Tanaka, H., Muto, T., Tanigawa, T., & Takeuchi, T. 2015, MNRAS, 448, 994
- Lee et al. (2014) Lee, E. J., Chiang, E., & Ormel, C. W. 2014, ApJ, 797, 95
- Lopez & Fortney (2013) Lopez, E. D., & Fortney, J. J. 2013, ApJ, 776, 2
- Lopez & Fortney (2014) —. 2014, ApJ, 792, 1
- Lubow & D’Angelo (2006) Lubow, S. H., & D’Angelo, G. 2006, ApJ, 641, 526
- Mordasini (2014) Mordasini, C. 2014, A&A, 572, A118
- Ormel (2014) Ormel, C. W. 2014, ApJ, 789, L18
- Ormel et al. (2015) Ormel, C. W., Shi, J.-M., & Kuiper, R. 2015, MNRAS, 447, 3512
- Owen & Wu (2013) Owen, J. E., & Wu, Y. 2013, ApJ, 775, 105
- Owen & Wu (2015) —. 2015, ArXiv e-prints, arXiv:1506.02049
- Piso & Youdin (2014) Piso, A.-M. A., & Youdin, A. N. 2014, ApJ, 786, 21
- Piso et al. (2015) Piso, A.-M. A., Youdin, A. N., & Murray-Clay, R. A. 2015, ApJ, 800, 82
- Rafikov (2006) Rafikov, R. R. 2006, ApJ, 648, 666
- Rogers (2015) Rogers, L. A. 2015, ApJ, 801, 41
- Rogers & Seager (2010) Rogers, L. A., & Seager, S. 2010, ApJ, 716, 1208
- Valencia et al. (2006) Valencia, D., O’Connell, R. J., & Sasselov, D. 2006, Icarus, 181, 545
- Venturini et al. (2015) Venturini, J., Alibert, Y., Benz, W., & Ikoma, M. 2015, A&A, 576, A114
- Weiss & Marcy (2014) Weiss, L. M., & Marcy, G. W. 2014, ApJ, 783, L6
- Wolfgang & Lopez (2015) Wolfgang, A., & Lopez, E. 2015, ApJ, 806, 183