The cluster ages experiment (CASE). VII. Analysis of two eclipsing binaries in the globular cluster NGC 6362∗
Abstract
We use photometric and spectroscopic observations of the detached eclipsing binaries V40 and V41 in the globular cluster NGC 6362 to derive masses, radii, and luminosities of the component stars. The orbital periods of these systems are 5.30 and 17.89 d, respectively. The measured masses of the primary and secondary components (, ) are (0.83370.0063, 0.79470.0048) M⊙ for V40 and (0.82150.0058, 0.72800.0047) M⊙ for V41. The measured radii (, ) are (1.32530.0075, 0.9970.013) R⊙ for V40 and (1.07390.0048, 0.73070.0046) R⊙ for V41. Based on the derived luminosities, we find that the distance modulus of the cluster is 14.740.04 mag – in good agreement with 14.72 mag obtained from CMD fitting. We compare the absolute parameters of component stars with theoretical isochrones in mass-radius and mass-luminosity diagrams. For assumed abundances [Fe/H] = -1.07, [/Fe] = 0.4, and Y = 0.25 we find the most probable age of V40 to be 11.70.2 Gyr, compatible with the age of the cluster derived from CMD fitting (12.50.5 Gyr). V41 seems to be markedly younger than V40. If independently confirmed, this result will suggest that V41 belongs to the younger of the two stellar populations recently discovered in NGC 6362. The orbits of both systems are eccentric. Given the orbital period and age of V40, its orbit should have been tidally circularized some 7 Gyr ago. The observed eccentricity is most likely the result of a relatively recent close stellar encounter.
Key words: binaries: eclipsing – binaries: spectroscopic – globular clusters: individual (NGC 6362) – stars: individual (V40 NGC 6362, V41 NGC 6362)
††footnotetext: †Deceased††footnotetext: ∗This paper includes data gathered with the 6.5-m Magellan Baade and Clay Telescopes, and the 2.5-m du Pont Telescope located at Las Campanas Observatory, Chile.1 Introduction
The Cluster AgeS Experiment (CASE) is a long term project conducted mainly at Las Campanas Observatory with a principal aim of the detection and detailed study of detached eclipsing binaries (DEBs) in nearby globular clusters (GCs). The main goal is to measure masses, luminosities and radii of DEB components with a precision of better than one per cent in order to determine GC ages and distances, and to test stellar evolution models (Kaluzny et al., 2005). The methods and assumptions we employ follow the ideas of Paczyński (1997) and Thompson et al. (2001). Thus far, we have presented results for seven DEBs from four clusters: Cen, 47 Tuc, M4 and M55. These were the first and, to the best of our knowledge, the only direct measurements of the fundamental parameters of main-sequence and subgiant stars in GCs. More details on the project and references to earlier papers can be found in Kaluzny et al. (2014a).
The present paper is devoted to an analysis of two DEBs, V40 and V41, belonging to the globular cluster NGC 6362. Radial velocity and photometric observations are used to derive masses, luminosities, and radii of the component stars. In Section 2 we describe the photometric observations and determine orbital ephemerides. Section 3 presents spectroscopic observations and radial-velocity measurements. The combined photometric and spectroscopic solutions for the orbital elements and the resulting component parameters are obtained in Section 4. In Section 5, we compare the derived parameters to Dartmouth stellar evolution models, with an emphasis on estimating the age of the binaries. Finally, in Section 6 we summarize our findings.
2 Photometric observations
Photometric observations analyzed in this paper were obtained at Las Campanas Observatory between 1995 and 2011 using the 2.5-m du Pont telescope equipped with the TEK5 and SITE2K CCD cameras, and the 1.0-m Swope telescope equipped with the SITE3 CCD camera. The scale was 0.26 arcsec/pixel and 0.44 arcsec/pixel for the du Pont and Swope telescopes, respectively. For each telescope the same set of filters was used for the entire duration of the project. The first likely eclipse events of V40 and V41 were observed in June 1991. For the next eight years observations were conducted in a survey mode with the aim of detecting more eclipses and to establish ephemerides for both variables. The periodic variability of V40 and V41 was firmly established by Mazur et al. (1999). Starting with the 2001 season, we attempted to cover predicted eclipses of V40 or V41. Several eclipses were observed with both telescopes. The light curve analysis in Section 4 is based exclusively on the du Pont data. The less accurate Swope photometry was used solely to improve the ephemerides (the difference in accuracy between the two telescopes resulted from the difference in the light-gathering power and the poorer sampling of the point spread function of the Swope telescope).
The core and half-light radii of NGC 6362 are ″ and ″, respectively (Harris, 1996, 2010 edition). V40 is located in the core region at a distance of ″ from the cluster center. V41 resides at the half-light radius with a distance of ″. The du Pont images show no evidence of unresolved visual companions to either binary. In the case of V40 this is confirmed by the examination of HST/ACS images obtained within the program GO-10775 (PI Ata Sarajedini). Both systems are proper-motion members of NGC 6362 (Zloczewski et al., 2012; Kaluzny et al., 2014b). Coordinates and finding charts for V40 and V41 can be found in Mazur et al. (1999).
The light curves presented here were measured with profile fitting photometry extracted with the Daophot/Allstar codes (Stetson, 1987, 1990), and transformed to the standard Johnson system based on observations of Landolt (1992) standards. A more detailed description of the data and the reduction procedures can be found in a paper presenting the photometry of 69 variables from the field of NGC 6362 (Kaluzny et al., 2014b). We note that, in general, more accurate photometry of crowded fields can be obtained with an image subtraction technique. However, profile fitting photometry is less vulnerable to systematic errors, and as such it is a better option whenever the star is free from blending.
2.1 Ephemerides
Several eclipse events of V40 were covered densely enough to determine individual times of minima. They were found using the KWALEX code which is based on an improved version of the algorithm presented by Kwee & van Woerden (1956) (see Appendix). The linear ephemerides:
| (1) |
proved to be an adequate fit to the moments of minima listed in Table 1. The orbit of V40 is eccentric. Since the secondary (shallower) minimum was observed more times than the primary one, we decided to choose it as a base of the phase count. Thus, we set , which necessarily results in .
Altogether, 13 eclipses of V41 were observed between August 2007 and September 2011. However, ingress and egress were only covered for a few of them. This prevented us from a classical period study based on the determination of individual moments of minima and the O-C technique. To find the ephemeris, a combined light curve including data from all seasons and both telescopes was used. This was fitted with the help of the JKTEBOP v34 code111described in detail at and available from http://www.astro.keele.ac.uk/jkt/codes/jktebop.html (Southworth, 2013, and references therein), allowing only for variations of and moment of the primary eclipse . Mode 8 of the code was used, which enabled a robust determination of the errors of the two parameters with the help of Monte Carlo simulations. The following linear ephemeris
| (2) |
was obtained. The light curves phased with ephemerides given by equations (1) and (2), and used for the subsequent analysis, are shown in Fig. 1.
3 Spectroscopic observations
The spectra were taken with the MIKE echelle spectrograph (Bernstein et al., 2003) on the Magellan Baade and Clay 6.5-m telescopes, using a 0.7″ slit which provided a resolution R 40,000. A typical observation consisted of two 1800-second exposures of the target, flanking an exposure of a thorium-argon hollow-cathode lamp. The raw spectra were reduced with the pipeline software written by Dan Kelson, following the approach outlined in Kelson (2003). For the further processing, the IRAF package ECHELLE was used. The velocities were measured using software based on the TODCOR algorithm (Zucker & Mazeh, 1994), kindly made available by Guillermo Torres. Synthetic echelle-resolution spectra from the library of Coelho et al. (2006) were used as velocity templates. These templates were interpolated to the values of and derived from the photometric solution (see Section 4) and Gaussian-smoothed to match the resolution of the observed spectra. For the interpolation in chemical composition we assumed and , i.e. values adopted for the cluster as a whole (Caretta et al., 2009; Dotter et al., 2010). These values are not well determined (see the discussion in Sect. 4), however the results of the velocity measurements are insensitive to minor changes in [Fe/H] or .
Radial velocities were measured on the wavelength intervals 4120-4320 Å and 4350-4600 Å, covering the region of the the best signal-to-noise ratio while avoiding the H line. The final velocities, obtained by taking the mean of these two measurements, are given in Tables 2 a nd 3, which list the heliocentric Julian dates at mid-exposure, velocities of the primary and secondary components, and the orbital phases of the observations calculated according to the ephemerides given by Equations (1) and (2). An estimate of the error in the velocity measurements is the rms of half of the differences between velocities obtained from the two wavelength intervals. The corresponding values are 0.63, 0.59, 0.23 and 0.52 km/s for the primary and secondary of V40 and the primary and secondary of V41, respectively. They are consistent with the rms values of the residuals from orbital fits given in Table 4.
4 Analysis of light and velocity curves
We assume that reddening is uniform for NGC 6362. Harris (1996, 2010 edition) lists as measured by West and Zinn (1984) based on the Q39 index. The map of total galactic extinction by Schlegel et al. (1998) predicts mag for the position of NGC 6362. This value agrees with an estimate resulting from isochrone fitting applied to HST/ACS photometry of the cluster by Dotter et al. (2010). They obtained , equivalent to . This value is also compatible with values obtained by Kovács & Walker (2001) () and Olech et al. (2001) () from an analysis of RR Lyr stars in NGC 6362. We adopt and neglect the differential reddening, which according to (Bonatto et al., 2013) is 0.025 mag on the average. (Bonatto et al., 2013) comment that this differential reddening may result from uncorrected zero-point variations in the original photometry.
We employed a quadratic formula for limb darkening, and calculated coefficients iteratively together with effective temperatures of the components of both systems. The temperatures were derived from dereddened colors using the empirical calibration of Casagrande et al. (2010). The coefficients were then interpolated from the tables of Claret (2000) with the help of the JKTLD code.222Written by John Southworth and available at www.astro.keele.ac.uk/jkt/codes/jktld.html The updated colors in turn were computed from total and magnitudes at maximum light and light ratios derived from the light curve solution. We note that a slightly more recent calibration by Sousa et al. (2011) results in temperatures higher by 8 K on average, however the agreement between calibrations is excellent over the relevant range of colors.
We checked that using a square root or logarithmic formula for the limb darkening instead of a quadratic formula had a negligible impact on the photometric solution. In particular, relative radii derived from the three two-parameter formulas differed by less than ), whereas using a linear limb darkening formula resulted in a slightly poorer fit, and caused the relative radii to differ by from those obtained with the quadratic formula. We conclude that, for the stars analyzed here, two-parameter formulate provide a better description of the limb darkening than the linear law.
Light and radial velocity curves of V40 and V41 were analyzed with the JKTEBOP v34 code, which allows for a simultaneous solution of one light curve and two radial velocity curves (one for the primary and one for the secondary component). The -curve was solved for the following parameters: inclination , sum of fractional radii and , ratio of the radii ; surface brightness ratio (secondary to primary), luminosity ratio , and where is the orbital eccentricity and the longitude of the periastron, amplitudes of radial velocity curves and , and systemic velocity . Errors of stellar parameters were derived using a Monte Carlo approach implemented in mode 8 of the JKTLD code. We performed 10000 Monte Carlo simulations for each of V40 and V41.
Since the -data were of poorer quality than those collected in the -band, we decided to use them solely to a measurement of the luminosity ratio . This was accomplished by fixing all parameters but the surface brightness ratio . However, the formal error of calculated by JKTEBOP would have been seriously underestimated if uncertainties of other parameters had not been taken into account. To avoid this problem we used the PHOEBE package v0.31a (Prša & Zwitter, 2005), which allows for a simultaneous solution of several light curves but can be unstable when attempting to solve light and velocity curves simultaneously. We initialized the package with the photometric solution found by JKTEBOP, loaded curves, and, allowing all geometrical parameters to vary, found the standard error of using another Monte Carlo procedure written in PHOEBE-scripter. The procedure replaces the observed light curves and with the fitted values and , generates Gaussian perturbations and such that the standard deviation of the perturbation is equal to the standard deviation of the corresponding residuals shown in Figure 2, and performs PHOEBE iterations on and . As before, 10000 Monte Carlo simulations were performed for each binary. In our opinion such a hybrid approach based on both the JKTEBOP and PHOEBE codes is optimal when analyzing data sets similar to those presented in this paper.
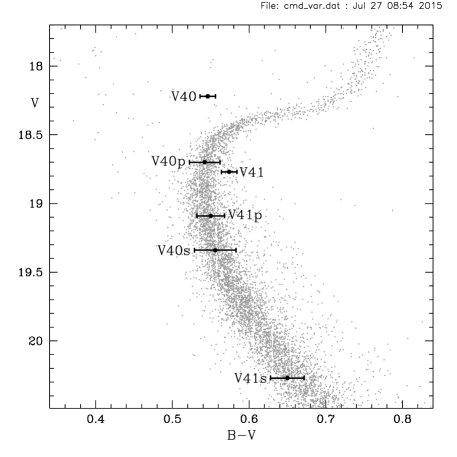
The quality of the final fits is illustrated in Figures 2 and 3. Orbital and photometric parameters derived for both systems are presented in Table 4, and absolute parameters of the components are listed in Table 5. The errors of the effective temperatures include uncertainties of observed colors, reddening, and photometric zero points (0.015 mag for and ). The bolometric luminosities are calculated from radii and temperatures adopting ergs.333 https://sites.google.com/site/mamajeksstarnotes/basic-astronomical-data-for -the-sun To derive absolute visual magnitudes, we used bolometric corrections based on atmosphere models of Castelli & Kurucz (2004) which ranged from mag for the primary of V40 to mag for the secondary of V41. The absolute visual magnitudes along with the -magnitudes derived from light curve solutions allowed for a determination of the apparent distance moduli listed in Table 5. The location of the components of V40 and V41 on the CMD of NGC 6362 is shown in Figure 4. All four stars are placed on the main sequence: three of them at the turnoff region, and the fourth one (the secondary of V41) well below the turnoff.
5 Age and distance analysis
The fundamental parameters obtained from the analysis of V40 and V41 allow us to derive the ages of the components of these systems, using theoretical isochrones. However, before a model comparison is made it is necessary to review the information available on the chemical composition of NGC 6362 since the model-based ages are sensitive to the adopted values of helium abundance, [Fe/H] and [/Fe].
Unfortunately, the metallicity of NGC 6362 is not well known. A literature search reveals that determinations of [Fe/H] from high resolution spectra are limited to the study by Carretta & Gratton (1997), who found and for two red giants. Caretta et al. (2009) used this determination along with some older estimates based on the integrated photometry of NGC 6362 to derive on their newly proposed metallicity scale. For the sake of completeness, we note that Harris (1996, 2010 edition) listed – a value obtained by combining that of Caretta et al. (2009) with derived by Geisler et al. (1997) based on Washington photometry of 10 cluster giants. Olech et al. (2001) obtained a helium content Y=0.292 from the analysis of RRc stars. Finally, Dalessandro et al. (2014) presented convincing evidence of multiple populations in NGC 6362. We adopt a fiducial composition of [Fe/H]=, [/Fe]=+0.4 and Y=0.25, but will investigate the dependence on these parameters when deriving the ages of the component stars.
In a study of three binary systems in M4 (Kaluzny et al., 2013) we used two sets of theoretical isochrones: Dartmouth (Dotter et al., 2008, henceforth DSED) and Victoria-Regina (VandenBerg et al., 2012). Since the differences in the derived ages turned out to be smaller than the uncertainties imposed by the observational errors, the present analysis is based on DSED isochrones only. Figure 5 shows DSED isochrones for ages ranging from 9-Gyr to 13-Gyr plotted on mass-radius and mass-luminosity diagrams, together with values for V40 and V41. Both diagrams indicate that V41 may be younger than V40, and the mass-radius diagram suggests that the secondary of V41 is younger than the primary (or, if both components are of the same age, the secondary is too small compared to the primary).
A detailed comparison of the ages of the individual components, which requires a quantitative age estimate from the data and the isochrones, was undertaken following the approach developed by Kaluzny et al. (2013) to study the binary systems in M4. Briefly, the or plane is densely sampled in both dimensions for each component separately, and the age of an isochrone matching the properties of the sampled point is found. The age ensembles generated in this way are visualized in the form of mass-age diagrams (MADs). The MAD of a given component is composed of two ellipses derived from and relations. Each ellipse defines a range of ages achieved by stars whose parameters differ from the corresponding entries or in Table 5 by at most or , where for the plane and likewise for the plane; , and being the standard errors of , and from Table 5. The MADs of the components of V40 and V41 are shown in Figure 6.
The age of each component was calculated as the weighted mean of the ages derived from the two corresponding MADs. For V40 we obtained 11.70.3 Gyr for the primary and 11.50.4 Gyr for the secondary. The difference is 0.20.5 Gyr. For V41 the ages are 10.70.3 Gyr and 9.20.6 Gyr, respectively, for the primary and the secondary. The difference is 1.50.7 Gyr. Possible origins of this two-sigma effect are discussed in Section 6. We estimated the age of each system from the weighted mean of the ages derived from each pair of corresponding MADs. For V40 we obtained 11.70.2 Gyr, in agreement with 12.50.5 Gyr derived by Dotter et al. (2010) from CMD fitting. For V41 we obtained 10.40.3 Gyr, which suggests that this system is significantly younger than V40, with a formal difference of 1.30.4 Gyr.
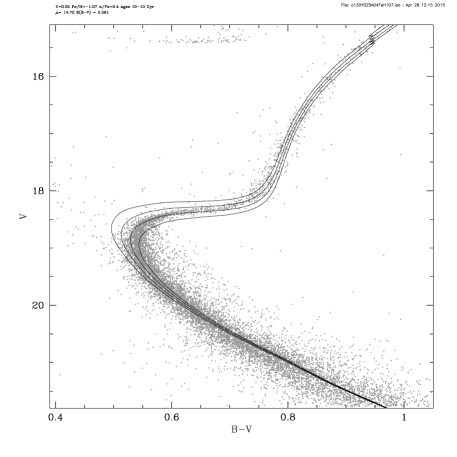
To independently estimate the age of the cluster as a whole, we fitted the CMD of NGC 6362 with DSED isochrones (see Figure 7). Since uncertainties of stellar models grow larger with evolutionary time, when fitting we assigned the largest weight to main sequence and turnoff stars. This results in an age estimate of 12.50.75 Gyr - again in agreement with the result of Dotter et al. (2010), which is based on an independent set of photometric data. The CMD fit yielded a distance modulus of 14.72 mag - larger than 14.55 mag derived by Dotter et al. (2010), but in good agreement with 14.68 mag listed by Harris (1996, 2010 edition). The reddening derived from the CMD-fit ( mag) is slightly lower than the value of 0.075 mag adopted in Sect. 4, but decreasing [Fe/H] from the fiducial -1.07 to -1.15 brings it back to the adopted value (we checked that such a small change in metallicity does not influence the parameters listed in Tables 4 and 5 in any significant way). The distance moduli of all four stars forming V40 and V41 agree with each other (see Table 5), and the mean weighted modulus of 14.740.04 mag is consistent with that obtained from CMD fitting.
To sum up, the age derived from the MADs of V40 components is compatible with that derived from CMD fitting, however the age of the primary of V41 is Gyr younger than the age of V40, with the secondary of V41 being another Gyr younger. The problem looks much milder in the diagram, in which all the four components are marginally coeval within 1- limits. We stress, however, that the diagram and associated MADs must be given a smaller weight because the luminosities in Table 5 are sensitive to adopted chemical composition (via , see Dotter et al., 2010) and possible differential reddening, whereas the radii are entirely reddening and composition-independent.
6 Discussion and summary
We derived absolute parameters of the components of V40 and V41, two detached eclipsing binaries located near the main sequence turnoff of NGC 6362. The accuracy of mass and radii measurements is generally better than 1 per cent, with the only exception being the radius of the secondary in V40 which is determined with an accuracy of 1.3 per cent. The luminosities of the components were found using effective temperatures estimated from - calibrations compiled by Casagrande et al. (2010). While their errors are rather large (between 7 and 10 per cent), all the four distance moduli have nearly the same value, and the formally calculated mean modulus of 14.740.04 mag agrees very well with 14.72 mag derived from the comparison of DSED isochrones with the CMD of the cluster.
Based on the parameters of V40 and DSED isochrones for Y=0.25, [Fe/H]= and [/Fe] =, we derived an age of 11.70.2 Gyr. The good agreement of this result with the age of NGC 6362 derived from isochrone comparison with the CMD of the cluster is encouraging. This is particularly the case given the age of the cluster as obtained by Dotter et al. (2010) based on an independent photometry (12.50.5 Gyr). However, one should keep in mind that the uncertainty of 0.2 Gyr is a purely statistical one, and, as pointed out by Kaluzny et al. (2013), it should be increased by 0.85 Gyr to account for the sensitivity of stellar age to uncertainties in the chemical composition.
The situation with V41 is less clear. Isochrone fits to and diagrams of this system suggest that it is significantly (by Gyr) younger than V40. However, given the recent discovery of two stellar populations in NGC 6362, such a possibility does not seem to be entirely implausible. Upon examining CMDs obtained from HST photometry, Dalessandro et al. (2014) found that the red giant branch of the cluster splits into two sub-branches separated by about 0.1 mag in , while such effect is not observed in . Their Figure 1 explains the split by a difference in light-element content. While they use isochrones of the same age, which is reasonable given the relatively weak dependence of RGB location on time, they clearly identify the Na-poor populations with the first generation of stars, and the Na-rich population with the second one ”formed during the first few 100 Myr of the cluster life from an intra-cluster medium polluted by the first generation”. We observed similar effects (i.e. a large split in and a much smaller one in ) using same-age DSED isochrones differing by 0.1 dex in [Fe/H], or 0.3 dex in [/Fe], or 0.1 in Y. The RGB also splits when the populations have the same composition but differ in age by 4-5 Gyr, however an age difference this large causes the subgiant branch to split even more widely than the RGB, while the opposite is observed in NGC 6362. Thus, we corroborate the results of Dalessandro et al. (2014) and their scenario involving two star formation episodes, with the second-generation stars slightly enriched in metals (and possibly in helium).
The discrepancy of the ages of V41 components ( Gyr) may be regarded as statistically insignificant. However we decided to study the possible origin of the difference by varying chemical composition parameters Y, [Fe/H] and [/Fe] (only one of them was varied at a time), and looking for isochrones joining locations of the primary and the secondary in the and diagrams. We found acceptable (albeit only marginally) fits with Y = 0.26 at an age of 9.5 Gyr; [/Fe] = 0.2 at an age of 9.7 Gyr, and [Fe/H] = -0.90 at an age of 11.3 Gyr. This suggests that V41 may have formed from material enriched in products of stellar nucleosynthesis, and thus it may indeed be younger than V40. We note parenthetically that the results of our fitting experiments are in line with the findings of Kaluzny et al. (2013), who, while discussing diagrams for binaries in M4, wrote “increasing Y decreases the age derived from the plane while increasing [Fe/H] or [/Fe] increases the age.”
V40 is also somewhat peculiar because of the eccentricity of its orbit. At an age of 12 Gyr and a period of 5.3 d the orbit should long ago have been fully circularized by tidal friction (Mazeh, 2008; Mathieu et al., 2004). There is no evidence for the presence of a third body in this system, which means that it must have undergone a close encounter during the last few Gyr. According to Dalessandro et al. (2014) NGC 6362 may have had a complicated dynamical history, losing perhaps as much as 80% of its original mass. Since close encounters account for a few per cent of the total mass loss (M. Giersz, private communication), the very existence of the nonzero eccentricity of V40 lends some support to this conjecture.
While V40 and V41 seem to belong to distinct populations, we feel it is too early to claim a direct detection of non-coevality among stars in globular clusters. It is clear, however, that DEBs offer the potential to test theories describing the origin of multiple populations in GCs, and to verify estimates of age differences between populations based on CMD-fitting. For the latter, both the theoretical predictions and fitting procedures yield values ranging from yr to several hundred Myr (Nardiello et al., 2015, and references therein), and any independent constraints are highly desirable. The most obvious test for the reality of the age difference between our two systems would be to determine the chemical composition of their components using disentangling software (see e.g. Hadrava, 2009). The existing spectra do not have adequate quality to measure abundances, but, given the brightnesses of the components and the orbital periods, it should be possible to improve the S/N ratio.
There is also room for improving the accuracy of parameter measurements. As noted by Kaluzny et al. (2013), the errors in the masses of the components originate almost entirely from the orbital solution, which may only be improved by taking additional spectra (preferably with the same instrument). Admittedly, this would require a substantial observational effort, as doubling of the present set of radial velocity data would lead to an improvement of only 33% in the mass estimates (Thompson et al., 2010). The errors in the radii of the components are dominated in turn by the photometric solution, whose quality depends on the accuracy of the photometry. We estimate that an accuracy of 0.002 – 0.003 mag in would reduce the errors of the radii by 50%. This goal could be easily achieved on a 6-8 m class telescope equipped with a camera capable of good PSF sampling. Finally, IR photometry should be obtained to reduce errors in luminosity with the help of existing accurate calibrations linking color to -band surface brightness.
Appendix: Kwalex: A method for timing eclipses
Kwee & van Woerden (1956) proposed an analyis of the timing of eclipses by fitting them with symmetric curves, so that any asymmetries would be reflected in observed-minus-calculated deviations. Their classical method does have its drawbacks. As far as the algorithm is concerned: (i) the interpolation of a light curve into a somewhat arbitrary evenly spaced time mesh yields a slight dependence of a final estimate of the central time on its initial approximation and (ii) the resulting estimate of the eclipse centre depends on the initial selection of data points and on the initial guess of the eclipse centre. There are also statistical drawbacks: (iii) interpolation effectively assigns uneven weights to points and (iv) the effective model, a polyline, suffers from excess number of parameters describing all nodes. Such a waste of degrees of freedom is known in statistics to decrease accuracy.
Let us adopt the zero point of the time scale as the current estimate of the eclipse centre . Following Kwee & van Woerden (1956) we fit both the input light curve and its reflexion with respect to . The novelty here is that we employ the orthogonal polynomial approximation of the combined light curve (e.g. Ralston 1965),rather than on a poly-line interpolation. In doing so we optimize the sensitivity of our method by keeping the number of model parameters at a statistically justifiable minimum (Occam razor). By virtue of the Fisher lemma (e.g. Brandt 1975), parameters of the orthogonal model are uncorrelated with noise hence they yield the minimum variance model estimate.
Next, again following Kwee & van Woerden (1956), we freeze the model curve and shift by and calculate of for the time shifts . These 3 values of are fitted with a parabola
| (3) |
and the location of its minimum may be adopted as the next approximation of . However, to assure convergence, we trim time steps and carefully select to avoid going too far away from the solution, yet possibly ensuring bracketing it within . Such orthogonal polynomials retain only even powers and are optimal both in terms of degrees of freedom and numerical procedure relying on orthogonal projection. By the incorporation of weight coefficients in the scalar product our algorithm is able to account for uneven errors of data.
Complications, both conceptual and algorithmic, arise due to our ultimate aim of minimizing the dependence of the final result on somewhat accidental selection of the initial data points. Discrete selection/modification of observations may result in numerical instability and/or non-converging limit cycles. To minimize such danger we resort to smooth down-weighting of points near edge of eclipse by a symmetric Fermi-Dirac distribution function (e.g. Kittel 1996):
| (4) |
The final weight of data measured at time with an error is . As our time zero-point moved during iterations towards the final solution, so our weights vary between iterations. We roughly followed principles of the minimization algorithm by simulated annealing (Otten & van Ginneken, 1989). At the start of iterations we adopt a rather crude model curve for and smooth weighting . Note, that in statistical physics would be proportional to the temperature. Only after successful progress of our algorithm do we tighten our data sample by decreasing (i.e. ’lower temperature’) and refine our model by increasing . Also, we trimmed the time step .
After each iteration we calculate two error estimates: and . The error corresponds to such a model shift that grows over its minimum value by its variance , where is the number of degrees of freedom. The error is defined similarly, for growth by . For this purpose has to be renormalized by a factor such, that . For an approximate normalization we substitute the minimum value of the parabola in Eq. (3) for its expectation, so that . and are calculated by solving of Eq. (3). In this way we obtain: and similarly for :
| (5) | |||||
| (6) |
To force a positive result we apply Eq. (3) to rather then to . In statistical terms, corresponds to the maximum reasonable uncertainty of , were other parameters strongly correlated with it and is its likely error, assuming weak correlation.
During iterations we keep as large as . Thus decreases for an improved model fit at a moderate rate. The polynomial order is raised in steps of , up to its maximum allowed value, only after decrease of corrections of to . We terminate iterations when reaches its selected maximum value and time steps become small , where is our tolerance parameter. Our result is the final eclipse centre and its likely error . Note, that for correlated observations errors need to be increased (Schwarzenberg-Czerny, 1991).
References
- Bernstein et al. (2003) Bernstein, R., Shectman, S. A., Gunnels, S. M., Mochnacki, S. & Athey, A. E. 2003, Instrument Design and Performance for Optical/Infrared Ground-based Telescopes. Edited by Iye, M. & Moorwood, A. F. M. Proceedings of the SPIE, 4841, 1694
- Bonatto et al. (2013) Bonatto, C., Campos, F. & Kepler, S. O., MNRAS, 435, 263
- Brandt (1975) Brandt, S. 1975, Statistical and Computational Methods in Data Analysis, Amsterdam, North Holland.
- Casagrande et al. (2010) Casagrande, L., Ramírez , I., Meléndez, J., Bessell, M. & Asplund, M. 2010, A&A, 512, 54
- Claret (2000) Claret, A. 2000, A&A, 363, 1081
- Caretta et al. (2009) Carretta, E., Bragaglia, A., Gratton, R., D’Orazi, V. & Lucatello, S. 2009, A&A, 508, 695
- Carretta & Gratton (1997) Carretta, E. & Gratton, R. G. 1997, A&AS, 121, 95
- Castelli & Kurucz (2004) Castelli, F. & Kurucz, R. L. 2004, arXiv:astro-ph/0405087
- Coelho et al. (2006) Coelho, P., Barbuy, B., Meléndez, J., Schiavon, R. P. & Castilho, B. V. 2005, A&A, 443, 735
- Dalessandro et al. (2014) Dalessandro, E., Massari, D., Bellazzini, M. et al. 2014, ApJ, 791, L4
- Dotter et al. (2008) Dotter, A., Chaboyer, B. Jevremović, D. et al. 2008, ApJS, 178, 89
- Dotter et al. (2010) Dotter, A., Sarajedini, A., Anderson, J. et al. 2010, ApJ, 708, 698
- Hadrava (2009) Hadrava, P. 2009, A&A, 494, 399
- Harris (1996, 2010 edition) Harris, W. E. 1996, AJ, 112, 1487
- Kaluzny et al. (2014b) Kaluzny, J., Rozyczka, M., Pych, W. & Thompson, I. B. 2014, Acta Astron., 64, 309
- Kaluzny et al. (2014a) Kaluzny, J., Thompson, I. B., Dotter, A., Rozyczka, M., Pych, W. et al. 2014, Acta Astron., 64, 11
- Kaluzny et al. (2013) Kaluzny, J., Thompson, I. B., Rozyczka, M., Dotter, A., Pych, W. et al. 2013, AJ, 145, 43
- Kaluzny et al. (2005) Kaluzny, J., Thompson, I. B., Krzeminski, W. et al. 2005, AIP Conf. Proc., Vol. 752, Stellar Astrophysics with the World’s Largest Telescopes, ed. J. Mikolajewska and A. Olech, p. 70
- Kelson (2003) Kelson D. D. 2003, PASP, 115, 688
- Kovács & Walker (2001) Kovács, G. & Walker, A. R. 2010, A&A, 371, 579
- Kwee & van Woerden (1956) Kwee, K. K. & van Woerden, H. 1956, Bull. Astron. Inst. Netherlands, 12, 327
- Kittel (1996) Kittel, Ch., 1996, Introduction to Solid State physics, NY, Wiley.
- Landolt (1992) Landolt, A. U. 1992, AJ, 104, 372
- Mathieu et al. (2004) Mathieu, R. D., Meibom, S. & Dolan, C. J. 2004 ApJ, 602, L121
- Mazeh (2008) Mazeh, T. 2008, EAS Publ. Series, 29, 1
- Nardiello et al. (2015) Nardiello, D., Piotto, G., Milone, A. P. et al. 2015, MNRAS, 451, 4831
- Mazur et al. (1999) Mazur, B., Kaluzny, J. & Krzeminski, W. 1999, MNRAS, 306, 727
- Otten & van Ginneken (1989) Otten, R.H.J.M. & van Ginneken, L.P.P.P. 1989, The Annealing Algorithm (Boston: Kluver)
- Olech et al. (2001) Olech, A., Kaluzny, J., Thompson, I. B. et al. 2001, MNRAS, 321, 421
- Paczyński (1997) Paczyński, B. 1997, in Space Telescope Science Institute Series, The Extragalactic Distance Scale, ed. M. Livio (Cambridge: Cambridge Univ. Press), p. 273
- Prša & Zwitter (2005) Prša, A. & Zwitter, T. 2005, AJ, 628, 426
- Ralston (1965) Ralston, A. 1965, (NY: McGraw-Hill)
- Schwarzenberg-Czerny (1991) Schwarzenberg-Czerny, A. 1991, MNRAS253, 198
- Southworth (2013) Southworth, J. 2013, MNRAS, 434, 1300
- Stetson (1987) Stetson, P. B. 1987, PASP, 99, 191
- Stetson (1990) Stetson, P. B. 1990, PASP, 102, 932
- Thompson et al. (2001) Thompson, I. B., Kaluzny, J., Pych, W. et al. 2001, AJ, 121, 3089
- Thompson et al. (2010) Thompson, I. B., Kaluzny, J., Rucinski, S. M., et al. 2010, AJ, 139, 329
- VandenBerg et al. (2012) VandenBerg, D. A., Bergbusch, P. A., Dotter, A. et al. 2012, ApJ, 755, 15
- Zloczewski et al. (2012) Zloczewski, K., Kaluzny, J., Rozyczka, M., Krzeminski, W., Mazur, B., & Thompson, I. B. 2012, Acta Astron., 62, 357
- Zucker & Mazeh (1994) Zucker, S. & Mazeh, T. 1994, ApJ, 420, 806
| E | HJD-2450000 | ||
|---|---|---|---|
| -480.5 | 1349.66400 | 0.00129 | 0.00060 |
| -274.5 | 2440.67681 | 0.00083 | -0.00019 |
| 0.5 | 3891.82809 | 0.00027 | 0.00045 |
| 3.5 | 3907.71733 | 0.00024 | -0.00027 |
| 16.5 | 3976.56802 | 0.00139 | -0.00069 |
| 77.5 | 4299.63424 | 0.00026 | -0.00024 |
| 138.5 | 4622.70052 | 0.00025 | 0.00015 |
| 276.5 | 5353.57276 | 0.00031 | 0.00003 |
| 0. | 3915.50987 | 0.00028 | -0.00022 |
| 1. | 3920.80387 | 0.00096 | 0.00196 |
| 139.0 | 4651.67750 | 0.00035 | 0.00014 |
| 335.0 | 5689.72753 | 0.00039 | -0.00007 |
| HJD-2450000 | [km s | [km s | phase |
|---|---|---|---|
| 2870.5433 | 52.73 | -78.06 | 0.665 |
| 3183.6775 | 57.18 | -85.40 | 0.790 |
| 3201.5720 | -74.19 | 52.16 | 0.169 |
| 3206.5845 | -65.72 | 41.55 | 0.115 |
| 3210.5848 | 35.22 | -64.64 | 0.871 |
| 3517.7456 | 36.05 | -63.77 | 0.867 |
| 3521.7538 | 40.02 | -66.70 | 0.624 |
| 3580.5437 | 60.61 | -87.52 | 0.725 |
| 3585.6468 | 56.59 | -84.07 | 0.688 |
| 3586.6453 | 33.28 | -59.01 | 0.877 |
| 3815.8955 | -74.88 | 52.41 | 0.163 |
| 3816.8897 | -62.77 | 41.06 | 0.350 |
| 3877.8517 | 38.86 | -66.45 | 0.861 |
| 3890.7002 | -74.76 | 55.72 | 0.287 |
| 3935.6890 | 57.56 | -86.79 | 0.782 |
| 3937.6503 | -72.90 | 50.94 | 0.152 |
| 3938.5635 | -68.71 | 47.47 | 0.324 |
| 3991.5267 | -68.84 | 47.33 | 0.325 |
| 4258.7016 | 59.64 | -88.13 | 0.771 |
| 4258.7465 | 57.69 | -86.47 | 0.780 |
| 4258.7904 | 58.16 | -85.71 | 0.788 |
| 4329.5454 | -72.97 | 49.67 | 0.148 |
| 4648.6241 | -49.91 | 27.55 | 0.395 |
| 4656.6819 | 15.95 | -41.39 | 0.916 |
| HJD-2450000 | [km s | [km s | phase |
|---|---|---|---|
| 2871.5571 | -32.73 | 8.93 | 0.181 |
| 2872.5519 | -38.27 | 15.99 | 0.236 |
| 3179.7609 | -47.66 | 27.81 | 0.410 |
| 3206.5336 | 20.39 | -52.18 | 0.906 |
| 3517.7940 | -43.64 | 23.06 | 0.306 |
| 3520.7452 | -46.33 | 26.13 | 0.471 |
| 3521.7074 | -40.89 | 20.15 | 0.525 |
| 3580.6885 | 42.56 | -73.79 | 0.822 |
| 3581.6731 | 30.56 | -59.28 | 0.877 |
| 3582.5946 | 16.30 | -44.91 | 0.928 |
| 3891.6858 | -34.69 | 14.52 | 0.207 |
| 3937.6050 | 44.58 | -76.40 | 0.774 |
| 3938.6590 | 40.59 | -73.04 | 0.833 |
| 3990.5131 | 35.50 | -66.03 | 0.731 |
| 4329.6373 | 15.02 | -42.95 | 0.689 |
| 4648.7184 | -41.08 | 19.93 | 0.525 |
| 4649.6742 | -30.79 | 8.04 | 0.579 |
| 4649.7192 | -30.27 | 7.02 | 0.581 |
| 4652.7191 | 40.41 | -73.29 | 0.749 |
| 4655.7155 | 19.30 | -48.17 | 0.917 |
| 4967.7970 | -47.13 | 25.65 | 0.362 |
| 5012.6510 | 30.80 | -62.41 | 0.870 |
| 5038.5921 | -44.61 | 23.99 | 0.320 |
| 6842.6401 | -30.67 | 7.75 | 0.167 |
| 6844.6397 | -41.48 | 20.30 | 0.279 |
| 6845.6556 | -46.30 | 24.06 | 0.336 |
| Parameter | V40 | V41 |
|---|---|---|
| (km s-1) | -12.34(11) | -12.55(8) |
| (km s-1) | 70.18(17) | 46.59(14) |
| (km s-1) | 73.63(25) | 52.57(17) |
| (km s-1) | 0.72 | 0.53 |
| (km s-1) | 1.07 | 0.65 |
| (R⊙) | 15.037(32) | 33.294(71) |
| 0.05054(73) | 0.3125(13) | |
| (deg) | 206.6(17) | 321.23(33) |
| (deg) | 88.22(7) | 89.547(20) |
| 0.08817(45) | 0.03225(13) | |
| 0.06627(87) | 0.02195(12) | |
| 0.9815(35) | 0.7333(63) | |
| 0.9686(18) | 0.669(11) | |
| 1.803(54) | 2.964(27) | |
| 1.8272(57 ) | 3.264(44) | |
| (mmag) | 11 | 12 |
| (mmag) | 13 | 16 |
| (mag)bbFor and both the internal error (from the photometric solution and profile photometry) and the total error is given, the latter including 0.015 mag uncertainty of the zero point of the magnitude scale. | 18.698(13)(20) | 19.089(7)(17) |
| (mag)bbFor and both the internal error (from the photometric solution and profile photometry) and the total error is given, the latter including 0.015 mag uncertainty of the zero point of the magnitude scale. | 19.338(22)(27) | 20.274(10)(18) |
| (mag)bbFor and both the internal error (from the photometric solution and profile photometry) and the total error is given, the latter including 0.015 mag uncertainty of the zero point of the magnitude scale. | 0.542(18)(23) | 0.550(10)(18) |
| (mag)bbFor and both the internal error (from the photometric solution and profile photometry) and the total error is given, the latter including 0.015 mag uncertainty of the zero point of the magnitude scale. | 0.556(31)(34) | 0.650(16)(22) |
| Parameter | V40 | V41 |
|---|---|---|
| (M⊙) | 0.8337(63) | 0.8215(58) |
| (M⊙) | 0.7947(48) | 0.7280(47) |
| (R⊙) | 1.3253(77) | 1.0739(48) |
| (R⊙) | 0.997(13) | 0.7307(46) |
| (K) | 6156(123) | 6124(121) |
| (K) | 6100(158) | 5747(122) |
| (L⊙) | 2.27(18) | 1.46(11) |
| (L⊙) | 1.24(13) | 0.524(45) |
| (mag) | 3.92(8) | 4.40(8) |
| (mag) | 4.59(11) | 5.54(9) |
| (mag) | 14.78(8) | 14.69(8) |
| (mag) | 14.75(9) | 14.73(8) |
| (Gyr) | 11.7(3) | 10.7(3) |
| (Gyr) | 11.5(4) | 9.2(6) |
| (Gyr) | 11.7(2) | 10.4(3) |