What do IRIS observations of Mg II k tell us about the solar plage chromosphere?
Abstract
We analyze observations from the Interface Region Imaging Spectrograph (IRIS) of the Mg II k line, the Mg II UV subordinate lines, and the O I 135.6 nm line to better understand the solar plage chromosphere. We also make comparisons with observations from the Swedish 1-m Solar Telescope (SST) of the H line, the Ca II 8542 line and Solar Dynamics Observatory/Atmospheric Imaging Assembly observations of the coronal 19.3 nm line. To understand the observed Mg II profiles, we compare these observations to the results of numerical experiments. The single-peaked or flat-topped Mg II k profiles found in plage imply a transition region at a high column mass and a hot and dense chromosphere of about 6500 K. This scenario is supported by the observed large-scale correlation between moss brightness and filled-in profiles with very little or absent self-reversal. The large wing width found in plage also implies a hot and dense chromosphere with a steep chromospheric temperature rise. The absence of emission in the Mg II subordinate lines constrain the chromospheric temperature and the height of the temperature rise while the width of the O I 135.6 nm line sets a limit to the non-thermal velocities to around 7 km s-1.
Subject headings:
Sun: atmosphere — Sun: chromosphere — Sun: faculae, plages1. Introduction
Plages are regions of the solar atmosphere with strong unipolar magnetic field. The Interface Region Imaging Spectrograph mission (IRIS; De Pontieu et al., 2014b), provides new diagnostics for the properties of plage in the form of the Mg II h&k lines, the Mg II subordinate UV lines, which are sensitive to heating in the low chromosphere (Pereira et al., 2015); and the O I line at 135.56 nm that samples the chromosphere but forms under optically thin conditions (Lin & Carlsson, 2015). In this Letter we investigate what the IRIS observations, together with observations from the Swedish 1-m Solar Telescope (SST; Scharmer et al., 2003) and the Atmospheric Imaging Assembly (AIA; Lemen et al., 2012) on board the Solar Dynamics Observatory (SDO) can tell us about the heating of the chromosphere and the neighboring regions (transition region (TR) and corona).
Understanding the physical mechanisms driving the formation of Mg II h&k is of great interest, not only for understanding the heating in the chromosphere, but also because these lines are used extensively as a proxy for the Sun’s cyclical variability over the entire UV spectral domain (i.e., the “Mg II index”; Heath & Schlesinger, 1986).
2. Observations
We used four data sets of active regions (including sunspots, pores, and plage regions) obtained with IRIS, one of which (2014 June 11 at 07:36 UT) was coordinated with H and Ca II 854.2 nm spectral line scans from the CRisp Imaging SPectrapolarimeter (CRISP; Scharmer, 2006; Scharmer et al., 2008) mounted on the SST. All IRIS raster scans were dense ( steps) with a spatial sampling of along the slit (unless otherwise noted). The 2014 June 11 data set focused on NOAA active region (AR) 12080 and consists of 20 large dense rasters with 96 raster steps resulting in a field of view of 335182″ centered at . The exposure time per raster step was 4 s. The raster cadence was 516 s.
The other IRIS data sets are similar large dense rasters with 400 raster steps and a resulting field of view of 140″182″. They have different exposure times, raster durations, and pointings of, respectively, 30s, 3.5 hr, (NOAA AR 12104) for the 2014 July 4, 11:40 UT data set; 8s, 1 hr, (NOAA AR 12139) for the 2014 August 16, 21:17 UT data set; and 30s, 3.5 hr, (NOAA AR 12187) for the 2014 October 18, 06:45 UT data set. The last data set included spatial binning by two along the slit to improve the signal-to-noise of the weak O I 135.6 nm line. All data sets were co-aligned with images in the 17.1 and 19.3 nm AIA passbands.
3. Observed Plage Properties
3.1. Typical Mg II k Profiles
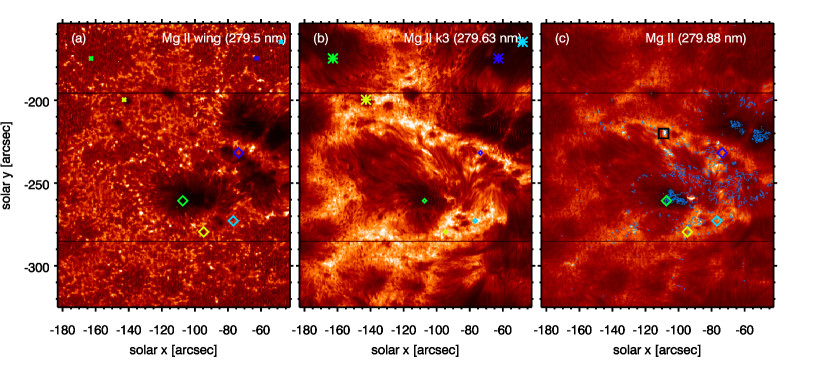
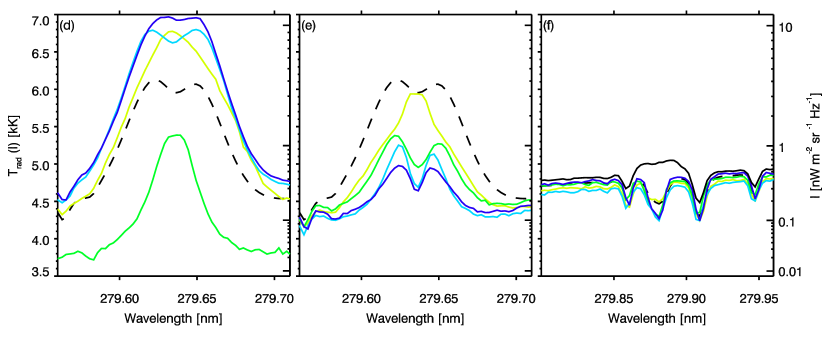
The Mg II k line shows a wide range of profiles throughout AR 12104 (Fig. 1). While the average profile of the field of view shows the typical central reversal (although significantly reduced compared to the quiet Sun), this average hides a wide range of types of profiles. Quiet-Sun regions in the vicinity of a plage (which is bright in Mg II wing; Fig. 1(a)) show deep central reversals with typically fainter k2 peaks (for a definition of spectral features, see Leenaarts et al., 2013a) and mostly narrower profiles (blue, cyan, and green profiles/locations in Fig. 1(b),(e)). Sunspots (green in Fig. 1(a),(d)) and pores (yellow in Fig. 1(b),(e)) are fainter, much narrower than the average AR profile (dashed lines in Fig. 1(d)–(f)) and typically show a single-peak profile. Profiles in plage are very different from quiet-Sun and sunspot/pore profiles: they are brighter, wider, and typically either single-peak (yellow, Fig. 1(a),(d)), flat-topped (blue, Fig. 1(a),(d)) or with a very small central reversal (cyan, Fig. 1(a),(d)).
Figure 1(c) shows that Mg II 279.88 nm is indeed sensitive to the chromosphere with many morphological features similar to those seen in Mg II k3 (b). While some locations show this subordinate blend in emission (light blue contours in (c); black square/profile in (c)/(f)), they are typically in sunspots, explosive events such as bombs (Peter et al., 2014) or locations in the canopy that surround the plage. The subordinate blend almost never goes into emission in the plage regions. This appears to provide strong constraints on the chromospheric temperature profile (see § 4).
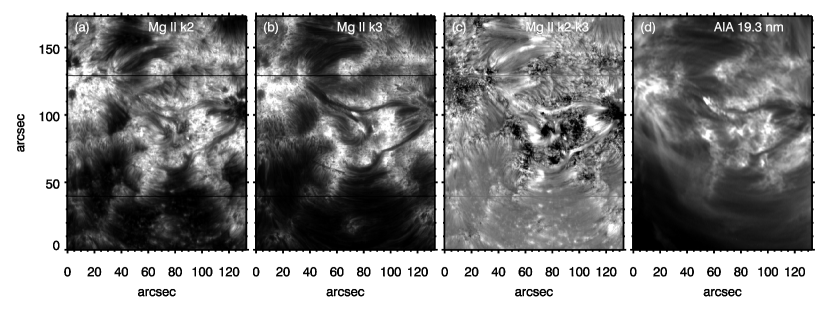
While plage profiles without a central reversal are common, not all plage regions show such profiles. On large, active-region-size, spatial scales, most plage regions are bright in k2(defined as average brightness in two fixed wavelength ranges to the blue/red of the line-center wavelength, as derived from the average profile; Fig 2(a)). On the same scales, the k3 map (brightness at the wavelength of line center of the average profile; Fig 2(b)) shows more variability with some bright k2 regions associated with fainter k3 intensity, and others showing very bright k3. This is illustrated by panel (c): for single-peak profiles k3 intensity is larger than k2, so regions with many single-peak profiles appear dark in panel (c). In summary, most plage regions are bright in k2, but only a subset show more single-peak profiles.
3.2. Correlations with the TR and corona on large scales
Comparison with the SDO/AIA 19.3 passband (dominated by Fe XII, ; Fig. 2(d)) shows that such single-peak regions have a spatial correlation, on large spatial scales, with regions of enhanced moss emission. This AIA passband contains both bright coronal loops, dark absorbing features, and bright, low-lying moss (e.g., (100″, 95″)). Moss regions are the upper TR footpoints of high pressure coronal loops that are so hot that their TR emission is formed at 1 MK, so that the SDO/AIA 19.3 nm emission originates from low-lying plasma that occurs at the same heights as chromospheric jets or dynamic fibrils (Berger et al., 1999; Fletcher & De Pontieu, 1999; De Pontieu et al., 1999) that absorb some of the EUV emission and give the mottled appearance typical for moss regions (see, e.g., bottom row of Fig. 2).
The brightness of moss is thought to be a good proxy for and linearly related to the pressure in the overlying hot coronal loops (Martens et al., 2000). We thus find that the brightest moss regions, i.e., locations with high coronal pressure, and thus TR at higher column mass, typically show more single-peak profiles.
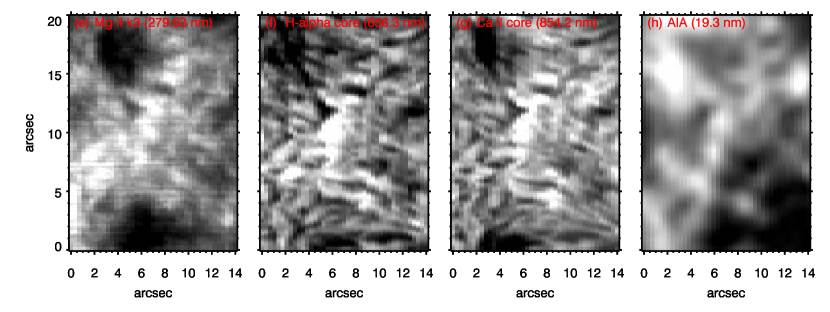
3.3. Correlations with chromosphere and TR on small scales
We also find correlations on the smallest observable spatial scales (bottom row of Fig. 2). We find that on sub-arcsecond scales the brightness in a small mossy plage region of Mg II k3, H line center, and Ca II 854.2 nm are well correlated. This correspondence is in part due to the small dark features visible in all three lines that are associated with dynamic fibrils (Hansteen et al., 2006; De Pontieu et al., 2007). This indicates that these diagnostics are all sensitive to upper chromospheric conditions, including velocity fields. The Ca II 854.2 nm brightness and H width have been proposed as a proxy for chromospheric temperatures in more quiescent conditions (Cauzzi et al., 2009). This relationship seems doubtful in plage: (1) the H width is not well correlated with Ca II 854.2 nm brightness (see the animation of Fig. 2); (2) Ca II 854.2 nm is well correlated with Mg II k3 brightness, which as shown below appears to be more sensitive to the TR rather than chromospheric conditions.
At small spatial scales, there is also a good, though not perfect, correspondence with AIA 19.3 nm moss emission, especially with dark moss features. This is perhaps not surprising as these features have been previously associated with bound-free absorption from dynamic fibrils (De Pontieu et al., 1999). On the other hand, many of the bright moss locations have an equivalent bright region in Mg II k3, H line center, and Ca II 854.2 nm line center. These findings expand on the previously found relationship between upper TR moss emission and H line center (De Pontieu et al., 2003) or Lyman- emission (Vourlidas et al., 2001).
3.4. Properties of Mg II k in Plage
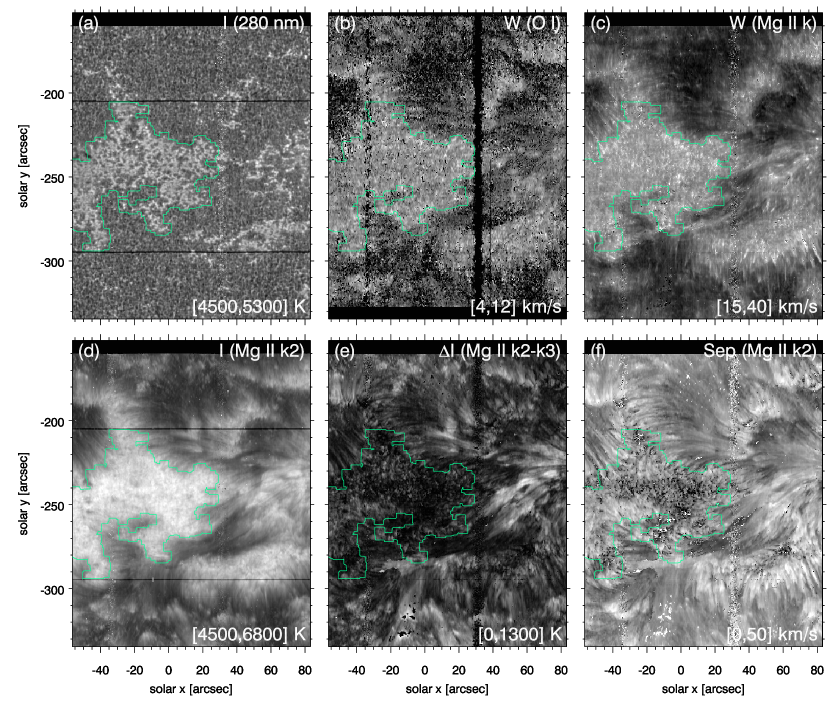
Figure 3 shows various observables of AR 12187. Panel (a) shows context by showing the intensity at 280 nm, a wavelength between the Mg II h&k lines where the intensity is formed in the upper photosphere. Magnetic areas are clearly seen as increased intensity, and there is a large plage area in the left part. We use this intensity to determine a mask for plage (green contours).
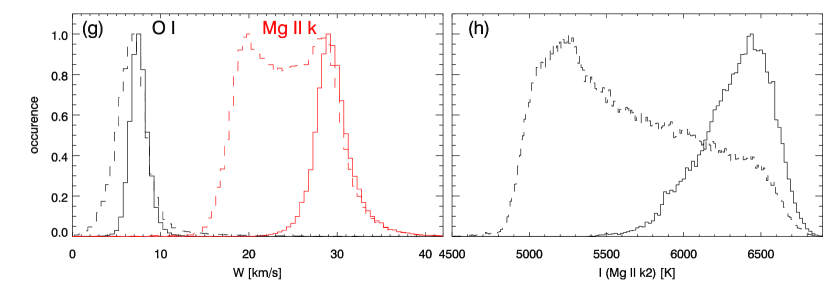
The width of the O I 135.6 nm line (panel (b)) in the plage area is remarkably constant, around 7.8 km s-1 with a small spread (panel (g)), and is larger than in internetwork areas. The O I 135.6 nm line is optically thin, and the width gives a direct measure of the width of the atomic absorption profile (Lin & Carlsson, 2015). At a temperature of 7 kK the thermal 1/e width of the O I 135.6 nm line is 2.7 km s-1 leading to a mean non-thermal width of 7.3 km s-1.
The wing width of the Mg II k line (panel (c)) is similarly larger in the plage area than in non-plage areas with a mean 1/e width of 30 km s-1 with a small spread (g). The large wing width of the Mg II k line comes from a large ”opacity broadening factor” (see Rathore & Carlsson (2015) for a discussion). The wings outside the k2 peaks sample the velocity field in a similar region as the O I 135.6 nm line. There is a clear correlation between the widths of the two lines but not one-to-one, showing that the Mg II k wing width is not only influenced by the velocity field in the chromosphere but also by a varying opacity broadening factor.
The radiation temperature of the Mg II k peak intensity is around 6400 K in plage with a smaller spread compared with the full field of view (panels (d),(h)). The plage area shows a mottled appearance with very little correlation with the intensity at 280 nm on small scales. There is some correlation with the Mg II k wing width (c).
Panel (e) shows how the central reversal of the Mg II k line is filled in by showing the difference in radiation temperature between the peak intensity and the k3 intensity. Single-peak profiles thus have a difference of zero. Most of the central part of the plage has a very weak central reversal or single-peak profiles. These locations also have larger maximum intensity (d) and larger Mg II k wing width (c). Stronger self-reversals occur in small patches outside the central part of the plage. These patches are correlated with asymmetric peaks, larger peak intensity, and larger k2 peak separation (panel (f)) but smaller Mg II k wing width (c).
The Mg II k2 peak separation (panel (f)) shows a lot more structure than the Mg II k wing width (c). The separation is large for the asymmetric profiles that have a rather deep central reversal (bright patches in the non-central part of the plage in panel (e)).
4. Modeling
The Mg II h&k line profiles from plage regions show some common features: their emission cores are wider than in other atmospheric regions, they are brighter, and their central depressions are shallower or absent.
By trial and error we constructed a model that matches the observed average Mg II k profile reasonably well by simultaneously solving the non-LTE problem for hydrogen, calcium, and magnesium, including charge conservation and enforcing hydrostatic equilibrium using the RH code (Uitenbroek, 2001). For hydrogen and calcium, we used the standard 5-level-plus-continuum H I and Ca II models that come with RH; for magnesium, we used the 10-level-plus-continuum Mg II atom from Leenaarts et al. (2013a). The Ly, Ly, Ca II H&K and Mg II h&k lines were computed including partial redistribution; all other lines were computed assuming complete redistribution.
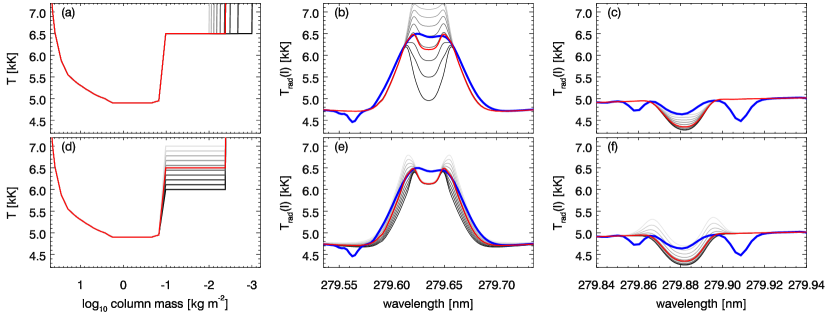
The model is constructed from the photosphere and TR of the one-dimensional static FALP model (Fontenla et al., 1991). Compared to FALP, our model has an extended temperature minimum, a steeper chromospheric temperature rise, a constant chromospheric temperature plateau, and the TR located at a larger column mass. In addition, we replaced the FALP non-constant microturbulence in the temperature plateau with a constant value. In Figure 4 and 5 we show the main parameters of our model and compare the synthetic Mg II k linecore and the subordinate blend at 279.88 nm with the average observed plage spectrum.
We do not propose this model as a realistic model of the atmospheric structure of plage; it is a numerical experiment exploring the constraints that the Mg II profiles set on the structure of plage chromospheres. We therefore explored the sensitivity of the Mg II lines to variations of our model by varying the column mass of the TR (panels (a)–(c) in Figure 4), the temperature of the chromospheric plateau (panels (d)–(f) in Figure 4), the microturbulence in the chromospheric plateau (panels (a)–(c) in Figure 5), and the column mass of the chromospheric temperature rise (panels (d)–(f) in Figure 5).
Varying the location in column mass of the TR has a large effect on k2 and k3: the emission peaks get higher, and the k3 minimum fills up as the TR is moved toward larger column mass, but even the best-fit model still has some central reversal. The subordinate blend gets shallower.
The temperature of the chromospheric plateau has a significant effect on the Mg II k core-width: larger temperatures mean larger widths. For temperatures above 6.5 kK the k2 intensity increases. The subordinate blend reacts strongly to changes in temperature. For temperatures below 6.5 kK, it is in absorption; for higher temperatures, it gets marked emission peaks.
Varying the microturbulence in the chromospheric temperature plateau changes the width of the Mg II k emission core, and the width of the absorption line caused by the UV subordinate transitions.
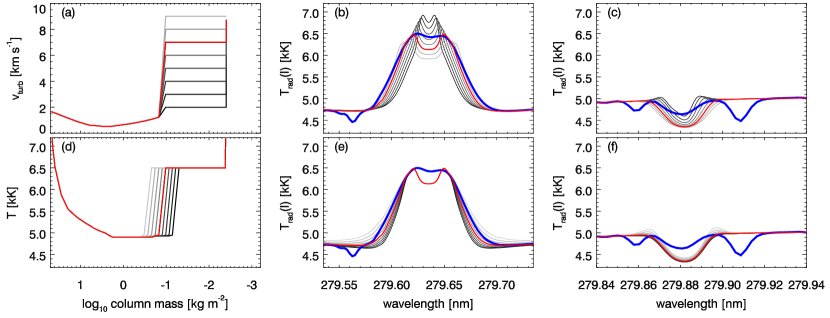
Changing the location of the chromospheric temperature rise has two effects. First, the deeper in the atmosphere it is located, the wider is the Mg II k emission core. Second, deeply located temperature rises lead to emission in the wings of the subordinate blend.
5. Discussion and conclusions
Our results on the peculiar Mg II k profiles found in plage provide an intriguing picture of heating in the plage chromosphere and hotter layers above. Our numerical experiments suggest that single-peaked or flat-topped profiles found in plage arise naturally if the chromosphere is hot and dense, thus ensuring coupling of the source function to the temperature, and if the column mass of the TR is high so that k2 and k3 form at the base of the TR. The latter occurs naturally at the footpoints of hot, dense coronal loops in which a strong thermal conductive flux pushes the TR to high column mass. This scenario is supported by the observed large-scale correlation between moss brightness (a proxy for coronal pressure) and filled-in profiles with very little or absent self-reversal. The correlation is not perfect since it depends on both chromospheric and coronal conditions. For example, cooler ( MK) but dense coronal loops can also have high coronal pressures (and thus TR at high column mass), yet they would lack signatures of AIA 19.3 nm “moss”. In addition, locations with TR at high column mass may occur even for a chromosphere that is lower density or cooler (leading to centrally reversed profiles). Despite these caveats, we often do find a reasonable correlation on small, arcsecond spatial scales between k3 brightness and upper TR moss emission. At these small scales, the H width does not correlate with k3 brightness, but the Ca II 854.2 nm brightness does. This is unlike the quiet-Sun.
We find that, contrary to quiet Sun profiles (Leenaarts et al., 2013a, b), the k3 and k2 properties in plage are sensitive to conditions higher up, at the very top of the chromosphere. The Mg II k sensitivity to (mid-)chromospheric conditions can be found in the width of the Mg II k wing, the (lack of) emission of the subordinate blend at 279.88 nm and the k2 peak separation. Compared to quiet Sun, the Mg II k wing width is significantly higher (but remarkably constant around km s-1) in plage regions. Comparison with non-thermal line broadening of the O I 135.6 nm line shows that it is smaller than 10 km s-1 and that there is a general correspondence on large spatial scales, but not on small spatial scales. This suggests that both increased microturbulence as well as so-called opacity broadening must play a role in the large wing widths of Mg II k. The opacity broadening comes about because Mg II k is an optically thick line, with the peak separation of k2 strongly influenced by the chromospheric column mass. There is a significant sensitivity of the wing width to chromospheric temperatures (as well as microturbulence).
The combination of these diagnostics with our numerical experiments indicates that the chromospheric temperatures in plage are remarkably constant and likely of the order of 6,000-6,500 K. This is compatible with the observed radiation temperatures of k2, and further confirmed by the fact that the subordinate blend at 279.88 nm is rarely found to be in emission, something that would be expected for higher temperatures.
The nature of the significant microturbulence in plage remains unknown, but clearly the presence of strong shocks (driving dynamic fibrils and affecting line broadening; De Pontieu et al., 2015), torsional motions (De Pontieu et al., 2014a) in and around plage, and Alfvén wave turbulence (van Ballegooijen et al., 2011) are candidates.
Currently ongoing numerical experiments suggest that the observed Mg II k profiles in plage can only be explained by the combination of a TR at high column mass (i.e., hot, dense corona above) as well as strong chromospheric heating. Without the latter, densities at elevated chromospheric temperatures would be lower, thus leading to narrower profiles and a lack of filled-in Mg II k profiles.
More work is required to better understand the coupling between chromospheric and coronal conditions in plage, as well as the apparent difficulty of reconciling the plage atmosphere considered here with observations in Ca II 854.2 nm and H, which may necessitate models with multiple atmospheric components, perhaps similar to those found from modeling of Ca II H&K (Solanki et al., 1991) and Ca II 854.2 nm (de la Cruz Rodríguez et al., 2013).
References
- Berger et al. (1999) Berger, T. E., De Pontieu, B., Schrijver, C. J., & Title, A. M. 1999, ApJ, 519, L97
- Cauzzi et al. (2009) Cauzzi, G., Reardon, K., Rutten, R. J., Tritschler, A., & Uitenbroek, H. 2009, A&A, 503, 577
- de la Cruz Rodríguez et al. (2013) de la Cruz Rodríguez, J., De Pontieu, B., Carlsson, M., & Rouppe van der Voort, L. H. M. 2013, ApJ, 764, L11
- De Pontieu et al. (1999) De Pontieu, B., Berger, T. E., Schrijver, C. J., & Title, A. M. 1999, Sol. Phys., 190, 419
- De Pontieu et al. (2007) De Pontieu, B., Hansteen, V. H., Rouppe van der Voort, L., van Noort, M., & Carlsson, M. 2007, ApJ, 655, 624
- De Pontieu et al. (2015) De Pontieu, B., McIntosh, S., Martinez-Sykora, J., Peter, H., & Pereira, T. M. D. 2015, ApJ, 799, L12
- De Pontieu et al. (2003) De Pontieu, B., Tarbell, T., & Erdélyi, R. 2003, ApJ, 590, 502
- De Pontieu et al. (2014a) De Pontieu, B., Rouppe van der Voort, L., McIntosh, S. W., et al. 2014a, Science, 346, D315
- De Pontieu et al. (2014b) De Pontieu, B., Title, A. M., Lemen, J. R., et al. 2014b, Sol. Phys., 289, 2733
- Fletcher & De Pontieu (1999) Fletcher, L., & De Pontieu, B. 1999, ApJ, 520, L135
- Fontenla et al. (1991) Fontenla, J. M., Avrett, E. H., & Loeser, R. 1991, ApJ, 377, 712
- Hansteen et al. (2006) Hansteen, V. H., De Pontieu, B., Rouppe van der Voort, L., van Noort, M., & Carlsson, M. 2006, ApJ, 647, L73
- Heath & Schlesinger (1986) Heath, D. F., & Schlesinger, B. M. 1986, J. Geophys. Res., 91, 8672
- Leenaarts et al. (2013a) Leenaarts, J., Pereira, T. M. D., Carlsson, M., Uitenbroek, H., & De Pontieu, B. 2013a, ApJ, 772, 89
- Leenaarts et al. (2013b) —. 2013b, ApJ, 772, 90
- Lemen et al. (2012) Lemen, J. R., Title, A. M., Akin, D. J., et al. 2012, Sol. Phys., 275, 17
- Lin & Carlsson (2015) Lin, H.-H., & Carlsson, M. 2015, ApJ, (submitted)
- Martens et al. (2000) Martens, P. C. H., Kankelborg, C. C., & Berger, T. E. 2000, ApJ, 537, 471
- Pereira et al. (2015) Pereira, T. M. D., Carlsson, M., De Pontieu, B., & Hansteen, V. 2015, ApJ, 806, 14
- Peter et al. (2014) Peter, H., Tian, H., Curdt, W., et al. 2014, Science, 346, C315
- Rathore & Carlsson (2015) Rathore, B., & Carlsson, M. 2015, ApJ, (in press)
- Scharmer (2006) Scharmer, G. B. 2006, A&A, 447, 1111
- Scharmer et al. (2003) Scharmer, G. B., Bjelksjo, K., Korhonen, T. K., Lindberg, B., & Petterson, B. 2003, in Society of Photo-Optical Instrumentation Engineers (SPIE) Conference Series, Vol. 4853, Society of Photo-Optical Instrumentation Engineers (SPIE) Conference Series, ed. S. L. Keil & S. V. Avakyan, 341–350
- Scharmer et al. (2008) Scharmer, G. B., Narayan, G., Hillberg, T., et al. 2008, ApJ, 689, L69
- Solanki et al. (1991) Solanki, S. K., Steiner, O., & Uitenbroeck, H. 1991, A&A, 250, 220
- Uitenbroek (2001) Uitenbroek, H. 2001, ApJ, 557, 389
- van Ballegooijen et al. (2011) van Ballegooijen, A. A., Asgari-Targhi, M., Cranmer, S. R., & DeLuca, E. E. 2011, ApJ, 736, 3
- Vourlidas et al. (2001) Vourlidas, A., Klimchuk, J. A., Korendyke, C. M., Tarbell, T. D., & Handy, B. N. 2001, ApJ, 563, 374