The Galactic chemical evolution of oxygen inferred from 3D non-LTE spectral line formation calculations
Abstract
We revisit the Galactic chemical evolution of oxygen, addressing the systematic errors inherent in classical determinations of the oxygen abundance that arise from the use of one dimensional hydrostatic (1D) model atmospheres and from the assumption of local thermodynamic equilibrium (LTE). We perform detailed 3D non-LTE radiative transfer calculations for atomic oxygen lines across a grid of 3D hydrodynamic stagger model atmospheres for dwarfs and subgiants. We apply our grid of predicted line strengths of the [OI] 630 nm and OI 777 nm lines using accurate stellar parameters from the literature. We infer a steep decay in [O/Fe] for , a plateau down to and an increasing trend for . Our 3D non-LTE calculations yield overall concordant results from the two oxygen abundance diagnostics.
keywords:
radiative transfer — line: formation — stars: atmospheres — stars: abundances — Galaxy: abundances — methods: numerical1 Introduction
Oxygen abundances and abundance ratios are crucial for understanding the evolution of stars and galaxies. It is therefore disconcerting that the [O/Fe]111The logarithmic abundance of an arbitrary element A is defined with respect to hydrogen: . The abundance ratio of elements A and B is given by: , where denotes the solar value. vs [Fe/H] relationship in the metal-poor halo is still in dispute, in spite of tremendous effort over a number of years (for an in-depth review, see for example Stasińska et al., 2012).
The situation is complicated by the availability of different oxygen abundance diagnostics, that often yield discordant results. Abundances inferred from the low-excitation forbidden [OI] 630 nm line tend to show a plateau at below (Nissen et al., 2002; Cayrel et al., 2004; García Pérez et al., 2006), as do those inferred from OH infrared (IR) vibration rotation lines (Balachandran et al., 2001; Meléndez & Barbuy, 2002). Analyses of the high-excitation permitted OI 777 nm lines (Carretta et al., 2000; Nissen et al., 2002; García Pérez et al., 2006) and of the OH ultraviolet (UV) excitation lines (Israelian et al., 1998; Israelian et al., 2001; Boesgaard et al., 1999; González Hernández et al., 2010) tend to predict increasing oxygen abundances toward lower metallicities, with at and at . Notably, however, García Pérez et al. (2006) inferred a plateau at from the OH UV lines in metal-poor subgiants between and . It has been suggested (e.g. Israelian et al., 2001) that these different trends could reflect in part different rates of circumstellar mixing in dwarfs, subgiants and giants, because at low metallicities the different diagnostics are typically used in different types of stars. Spite et al. (2005) compared abundances in giants which have and have not undergone internal mixing. They found no significant systematic difference in [O/Fe], indicating that the problem must in fact arise from elsewhere.
The discrepancies between the [OI] 630 nm line and the OI 777 nm lines likely have at least two points of origin. Firstly, classical abundance analyses are prone to systematic modelling errors. These errors arise from the use of one dimensional (1D) hydrostatic model atmospheres and from the assumption of local thermodynamic equilibrium (LTE). Although the [OI] 630 nm line forms in LTE (Kiselman & Nordlund, 1995), the effects of inhomogeneities and three-dimensional structures in late-type stellar atmospheres on the [OI] 630 nm line in the metal-poor regime are significant (Nissen et al., 2002; Collet et al., 2007). The OI 777 nm lines are a classic case study of non-LTE line formation (Sedlmayr, 1974; Kiselman, 1993; Takeda, 2003; Fabbian et al., 2009). However, full 3D non-LTE calculations have not been been carried out beyond the Sun (Kiselman & Nordlund, 1995; Asplund et al., 2004; Pereira et al., 2009; Prakapavičius et al., 2013; Steffen et al., 2015).
Secondly, systematic errors can be present in the adopted stellar parameters. In particular, offsets in the adopted effective temperature () would reveal themselves as offsets in the [O/Fe] vs [Fe/H] trend, as the [OI] 630 nm line and the OI 777 nm lines have opposite sensitivities to . If is underestimated for a given star, the [OI] 630 nm line will underestimate the atmospheric oxygen abundance, while the OI 777 nm lines will overestimate it. The accurate calibrations of the infrared flux method (IRFM) by Casagrande et al. (2010) have shown previous estimates dwarfs and subgiants with to typically be too low.
Offsets in of this magnitude are not sufficient to explain by themselves the [O/Fe] vs [Fe/H] problem at the lowest metallicities (Fulbright & Johnson, 2003). Likewise, extremely large 3D non-LTE abundance corrections would be required in the OI 777 nm lines to explain the problem, because the non-LTE abundance corrections in these lines (Fabbian et al., 2009; Dobrovolskas et al., 2014) go in the same direction as the 3D abundance corrections in the [OI] 630 nm line (Nissen et al., 2002; Collet et al., 2007). Thus, errors in the stellar parameters must be addressed simultaneously with 1D LTE errors to achieve reliable results from the oxygen abundance diagnostics.
In this letter we aim to pin down the true nature of the Galactic chemical evolution of oxygen. To that end, we have performed for the first time detailed 3D non-LTE radiative transfer calculations for atomic oxygen lines across a grid of 3D hydrodynamic stagger model atmospheres (Collet et al., 2011; Magic et al., 2013) (§2). We illustrate the results in the form of 3D non-LTE vs 1D LTE abundance corrections (§3). Using our 3D non-LTE grid, accurate stellar parameters from the literature, and a large collection of published equivalent widths of the [OI] 630 nm and OI 777 nm lines, we revisit the [O/Fe] vs [Fe/H] relationship (§4).
2 Calculations
2.1 Model atmospheres
3D hydrodynamic model atmospheres were taken from the stagger-grid (Collet et al., 2011; Magic et al., 2013). These were trimmed by removing the very optically thick layers of the original simulations and resampled: the meshsize was thus reduced from gridpoints down to , the last dimension representing the vertical. One-dimensional (1D) hydrostatic model atmospheres were computed using an equation of state and a treatment of opacities and radiative transfer fully consistent with the stagger models.
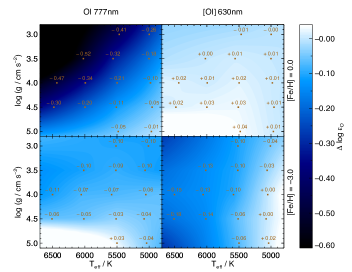
We illustrate the extent of the grid in effective temperature () and surface gravity () space in Fig. 1. Grid nodes are spaced in intervals of and . The grid spans , in equal intervals of .
2.2 Spectral line formation
Multi-level statistical equilibrium radiative transfer calculations were performed using the domain-decomposed MPI-parallelised code multi3d (Leenaarts & Carlsson, 2009). For a given oxygen abundance and 3D model, the average line profile was calculated from four temporal snapshots. The monochromatic average non-LTE to LTE ratio was then applied to the average line profile from at least 50 temporal snapshots calculated in LTE using scate (Hayek et al., 2011).
The 3D and the 1D spectral line formation calculations were carried out in the same way to avoid incurring systematic errors. In 1D an additional parameter, the microturbulence , is required to describe the line broadening by convective velocity fields. The 1D grid was calculated for several values of ; in this letter we adopt a typical value of to illustrate the abundance corrections (§3). We emphasise that in 3D no microturbulent velocities are necessary (Asplund et al., 2000).
2.3 Model atom
A 23-level model oxygen atom was used, based on the models used by Carlsson & Judge (1993), Kiselman (1993), and Fabbian et al. (2009). The model was updated with energies and oscillator strengths from NIST222http://www.nist.gov/pml/data/asd.cfm (Kramida et al., 2012), natural line broadening coefficients from VALD3333http://vald.astro.univie.ac.at/vald3/php/vald.php (Piskunov et al., 1995; Kupka et al., 2000), and collisional line broadening coefficients from Barklem et al. (1998).
The statistical equilibrium is sensitive to the adopted collisional rate coefficients. Results from R-matrix calculations were used for the rate of excitation via collisions with electrons (Barklem, 2007). Following Lambert (1993), a correction to the original formula of Drawin (1968, 1969) was adopted for the rate of excitation via collisions with neutral hydrogen. All levels were coupled in this manner, including including those with radiatively weak and forbidden transitions, in which case Drawin’s formula was used with an effective oscillator strength . An enhancement factor to the Drawin formula was calibrated by studying the centre-to-limb variation in the Sun, following Pereira et al. (2009) using observational data from the Swedish Solar Telescope. We have obtained and have inferred a solar oxygen abundance .
The dominant systematic errors in the non-LTE calculations likely arise from the errors in the rate of excitation via neutral hydrogen collisions. As discussed in Barklem et al. (2011), the approach of calibrating the Drawin formula using a single parameter cannot correct any errors in the relative rates, and can mask other deficiencies in the models. One can get a feeling for the sensitivity of the results on the neutral hydrogen collisions by comparing the results with those obtained when is reduced to nought, thereby neglecting them altogether. When doing so, the derived non-LTE abundance corrections for the OI 777 nm can become up to 0.05 dex more negative.
2.4 Background opacities
While background continuum opacities were calculated internally by the two spectral line formation codes, background line opacities had to be included separately. These were pre-calculated assuming LTE and the chemical composition of the atmosphere being modelled (Collet et al., 2005; Bergemann et al., 2012).
It can be tempting to simplify the non-LTE analysis by neglecting the background lines that do not overlap with the lines being studied in detail. This is dangerous; oxygen proves to be a case in point. We have found the Lyman- line to play a critical role in controlling the statistical equilibrium of oxygen in the photosphere. Without the Lyman- line, extremely large abundance corrections would erroneously be inferred from the OI 777 nm lines in metal-poor stars. We discuss this briefly in §3, and in more detail in a forthcoming paper.
3 Abundance corrections
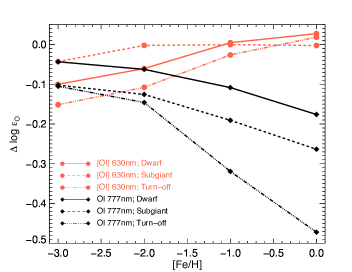
Abundance corrections were calculated by demanding that the equivalent width of the line flux obtained in LTE from the 1D model with a given oxygen abundance matches that inferred in non-LTE from the 3D model with some oxygen abundance . Equivalent widths were determined by direct integration across the line profile. We illustrate corrections for the two oxygen abundance diagnostics across different models in Fig. 1 and Fig. 2.
The 3D corrections for the [OI] 630 nm line are close to zero in the solar metallicity case, but become increasingly more negative at lower [Fe/H], in line with previous findings (Nissen et al., 2002; Collet et al., 2007). Differences in the predicted mean temperature stratification between the hydrodynamical 3D models and the hydrostatic 1D models are more severe in this regime; 1D models typically overestimate the atmospheric temperature in the upper layers where this line forms (Asplund et al., 1999).
In contrast, the 3D non-LTE vs 1D LTE abundance corrections for the OI 777 nm lines are most severe in the solar metallicity case, reaching up to (Fig. 1 and Fig. 2). Photon losses in the line itself drive the non-LTE effects (Asplund et al., 2004); inhomogeneities in the 3D model atmospheres exacerbate these effects.
Fabbian et al. (2009) obtained extremely large non-LTE effects at low [Fe/H] in their 1D non-LTE study of the OI 777 nm lines. These authors found that, toward lower metallicities, photon pumping (Asplund, 2005) in the OI 130 nm lines would drive very large overpopulations with respect to LTE in the upper level of these lines. Then, collisional coupling would propagate this overpopulation onto the lower level of the OI 777 nm lines. This would increase the OI 777 nm line opacity, strengthening the lines and causing large negative abundance corrections, reaching in metal-poor turn-off stars (assuming ). However, the analysis of Fabbian et al. (2009) did not include background opacity from the Lyman- line, which is significant because the line is very strong and the OI 130 nm lines sit on its red wing. We have found that the Lyman- line provides an efficient alternative destruction route for UV photons at low [Fe/H] that completely stifles the photon pumping effect in the OI 130 nm lines. Thus, in the absence of an alternative non-LTE mechanism, we are left with small departures from LTE in the OI 777 nm lines at low [Fe/H].
4 The Galactic chemical evolution of oxygen
The equivalent widths of the [OI] 630 nm and OI 777 nm lines were taken from a number of studies of dwarfs and subgiants based on high signal-to-noise observations (Carretta et al., 2000; Fulbright & Johnson, 2003; Bensby et al., 2004; Akerman et al., 2004; García Pérez et al., 2006; Fabbian et al., 2009; Nissen et al., 2002, 2014; Bertran de Lis et al., 2015). Where more than one value was available for a given star and line, the unweighted mean was adopted. For consistency, equivalent widths across the theoretical 3D non-LTE grid were computed by fitting Gaussian functions to the line fluxes and integrating analytically. Stellar parameters were taken from several recent studies (Casagrande et al., 2010; Casagrande et al., 2011; Nissen et al., 2014). These estimates were either derived using or critically compared to the accurate IRFM calibrations of Casagrande et al. (2010); where more than one set of stellar parameters was available for a given star, the newest set was adopted.
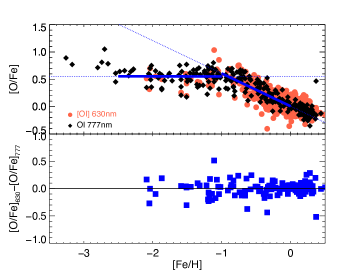
Hitherto, studies have typically found discrepant results from the two abundance diagnostics at low [Fe/H] (§1). In Fig. 3 we compare the [O/Fe] ratios inferred from our analyses. We have found the [OI] 630 nm line and the OI 777 nm lines to give similar [O/Fe] vs [Fe/H] trends down to , the lowest metallicity in which the [OI] 630 nm line is detectable in halo subgiants and turn-off stars. Furthermore, the abundances inferred from these diagnostics in the atmospheres of the same stars are consistent to within a standard deviation of 0.14 dex.
It bears repeating that there are two factors in our analysis that are absent in most previous studies, that conspire to give concordant results between the two abundance diagnostics. First, we have accounted for 3D non-LTE effects in the OI 777 nm lines: these are of decreasing importance towards lower [Fe/H] , but even then remain significant. Second, we have used new and accurate stellar parameters: the more reliable IRFM calibrations give estimates that are significantly larger than those typically used in the past.
The [O/Fe] vs [Fe/H] relationship in Fig. 3 reflects the evolution with time of oxygen and iron yields. Oxygen is synthesised almost entirely in massive stars (), its most abundant isotope being the endpoint of Helium burning (Woosley et al., 2002; Clayton, 2003; Meyer et al., 2008). Since iron is synthesised in type II supernovae explosions (Woosley et al., 2002), the plateau at between indicates that massive stars at this epoch eject an approximately constant ratio of oxygen and iron upon their deaths, in agreement with Galactic chemical evolution models (François et al., 2004; Kobayashi et al., 2006). The steep linear decay seen above is usually interpreted as a sign of the long-lived type Ia supernovae becoming significant, increasing the rate of enrichment of iron into the cosmos (Tinsley, 1979; McWilliam, 1997).
At there is a slight upturn in [O/Fe], but it is less pronounced than found from the 1D LTE analyses of OH UV lines by Israelian et al. (1998); Israelian et al. (2001) and Boesgaard et al. (1999). The upturn could indicate a shift in the mass distribution of stars at earlier epochs; stars that are more massive and more metal-poor are expected to yield larger oxygen-to-iron ratios (Kobayashi et al., 2006). We caution however that inferences in this region are less reliable because they are based on a very small sample of stars and on analyses of the OI 777 nm lines alone. A larger sample of halo turn-off stars with accurate stellar parameters and very high signal-to-noise spectra will be needed to confirm this result.
Acknowledgements
AMA and MA are supported by the Australian Research Council (ARC) grant FL110100012. RC acknowledges support from the ARC through DECRA grant DE120102940. This research has made use of the SIMBAD database, operated at CDS, Strasbourg, France. This research was undertaken with the assistance of resources from the National Computational Infrastructure (NCI), which is supported by the Australian Government.
References
- Akerman et al. (2004) Akerman C. J., Carigi L., Nissen P. E., Pettini M., Asplund M., 2004, A&A, 414, 931
- Allende Prieto et al. (2001) Allende Prieto C., Lambert D. L., Asplund M., 2001, ApJ, 556, L63
- Asplund (2005) Asplund M., 2005, ARA&A, 43, 481
- Asplund et al. (2004) Asplund M., Grevesse N., Sauval A. J., Allende Prieto C., Kiselman D., 2004, A&A, 417, 751
- Asplund et al. (2000) Asplund M., Nordlund Å., Trampedach R., Allende Prieto C., Stein R. F., 2000, A&A, 359, 729
- Asplund et al. (1999) Asplund M., Nordlund Å., Trampedach R., Stein R. F., 1999, A&A, 346, L17
- Balachandran et al. (2001) Balachandran S. C., Carr J. S., Carney B. W., 2001, New Astronomy Review, 45, 529
- Barklem (2007) Barklem P. S., 2007, A&A, 462, 781
- Barklem et al. (1998) Barklem P. S., Anstee S. D., O’Mara B. J., 1998, Publications of the Astron. Soc. of Australia, 15, 336
- Barklem et al. (2011) Barklem P. S., Belyaev A. K., Guitou M., Feautrier N., Gadéa F. X., Spielfiedel A., 2011, A&A, 530, A94
- Bensby et al. (2004) Bensby T., Feltzing S., Lundström I., 2004, A&A, 415, 155
- Bergemann et al. (2012) Bergemann M., Lind K., Collet R., Magic Z., Asplund M., 2012, MNRAS, 427, 27
- Bertran de Lis et al. (2015) Bertran de Lis S., Delgado Mena E., Adibekyan V. Z., Santos N. C., Sousa S. G., 2015, A&A, 576, A89
- Boesgaard et al. (1999) Boesgaard A. M., King J. R., Deliyannis C. P., Vogt S. S., 1999, AJ, 117, 492
- Carlsson & Judge (1993) Carlsson M., Judge P. G., 1993, ApJ, 402, 344
- Carretta et al. (2000) Carretta E., Gratton R. G., Sneden C., 2000, A&A, 356, 238
- Casagrande et al. (2010) Casagrande L., Ramírez I., Meléndez J., Bessell M., Asplund M., 2010, A&A, 512, A54
- Casagrande et al. (2011) Casagrande L., Schönrich R., Asplund M., Cassisi S., Ramírez I., Meléndez J., Bensby T., Feltzing S., 2011, A&A, 530, A138
- Cayrel et al. (2004) Cayrel R., Depagne E., Spite M., Hill V., Spite F., François P., Plez B., Beers T., Primas F., Andersen J., Barbuy B., Bonifacio P., Molaro P., Nordström B., 2004, A&A, 416, 1117
- Clayton (2003) Clayton D., 2003, Handbook of Isotopes in the Cosmos. Cambridge Univ. Press, Cambridge
- Collet et al. (2005) Collet R., Asplund M., Thévenin F., 2005, A&A, 442, 643
- Collet et al. (2007) Collet R., Asplund M., Trampedach R., 2007, A&A, 469, 687
- Collet et al. (2011) Collet R., Magic Z., Asplund M., 2011, Journal of Physics Conference Series, 328, 012003
- Dobrovolskas et al. (2014) Dobrovolskas V., Kučinskas A., Bonifacio P., Korotin S. A., Steffen M., Sbordone L., Caffau E., Ludwig H.-G., Royer F., Prakapavičius D., 2014, A&A, 565, A121
- Drawin (1968) Drawin H.-W., 1968, Zeitschrift fur Physik, 211, 404
- Drawin (1969) Drawin H. W., 1969, Zeitschrift fur Physik, 225, 483
- Fabbian et al. (2009) Fabbian D., Asplund M., Barklem P. S., Carlsson M., Kiselman D., 2009, A&A, 500, 1221
- Fabbian et al. (2009) Fabbian D., Nissen P. E., Asplund M., Pettini M., Akerman C., 2009, A&A, 500, 1143
- François et al. (2004) François P., Matteucci F., Cayrel R., Spite M., Spite F., Chiappini C., 2004, A&A, 421, 613
- Fulbright & Johnson (2003) Fulbright J. P., Johnson J. A., 2003, ApJ, 595, 1154
- García Pérez et al. (2006) García Pérez A. E., Asplund M., Primas F., Nissen P. E., Gustafsson B., 2006, A&A, 451, 621
- González Hernández et al. (2010) González Hernández J. I., Bonifacio P., Ludwig H.-G., Caffau E., Behara N. T., Freytag B., 2010, A&A, 519, A46
- Hayek et al. (2011) Hayek W., Asplund M., Collet R., Nordlund Å., 2011, A&A, 529, A158
- Israelian et al. (1998) Israelian G., García López R. J., Rebolo R., 1998, ApJ, 507, 805
- Israelian et al. (2001) Israelian G., Rebolo R., García López R. J., Bonifacio P., Molaro P., Basri G., Shchukina N., 2001, ApJ, 551, 833
- Kiselman (1993) Kiselman D., 1993, A&A, 275, 269
- Kiselman & Nordlund (1995) Kiselman D., Nordlund A., 1995, A&A, 302, 578
- Kobayashi et al. (2006) Kobayashi C., Umeda H., Nomoto K., Tominaga N., Ohkubo T., 2006, ApJ, 653, 1145
- Kramida et al. (2012) Kramida A., Ralchenko Y., Reader J., et al.,, 2012, NIST atomic spectra database (version 5)
- Kupka et al. (2000) Kupka F. G., Ryabchikova T. A., Piskunov N. E., Stempels H. C., Weiss W. W., 2000, Baltic Astronomy, 9, 590
- Lambert (1978) Lambert D. L., 1978, MNRAS, 182, 249
- Lambert (1993) Lambert D. L., 1993, Physica Scripta Volume T, 47, 186
- Leenaarts & Carlsson (2009) Leenaarts J., Carlsson M., 2009, in Lites B., Cheung M., Magara T., Mariska J., Reeves K., eds, The Second Hinode Science Meeting: Beyond Discovery-Toward Understanding Vol. 415 of Astronomical Society of the Pacific Conference Series, MULTI3D: A Domain-Decomposed 3D Radiative Transfer Code. p. 87
- Magic et al. (2013) Magic Z., Collet R., Asplund M., Trampedach R., Hayek W., Chiavassa A., Stein R. F., Nordlund Å., 2013, A&A, 557, A26
- McWilliam (1997) McWilliam A., 1997, ARA&A, 35, 503
- Meléndez & Barbuy (2002) Meléndez J., Barbuy B., 2002, ApJ, 575, 474
- Meyer et al. (2008) Meyer B. S., Nittler L. R., Nguyen A. N., Messenger S., 2008, Reviews in Mineralogy and Geochemistry, 68, 31
- Nissen et al. (2014) Nissen P. E., Chen Y. Q., Carigi L., Schuster W. J., Zhao G., 2014, A&A, 568, A25
- Nissen et al. (2002) Nissen P. E., Primas F., Asplund M., Lambert D. L., 2002, A&A, 390, 235
- Pereira et al. (2009) Pereira T. M. D., Asplund M., Kiselman D., 2009, A&A, 508, 1403
- Piskunov et al. (1995) Piskunov N. E., Kupka F., Ryabchikova T. A., Weiss W. W., Jeffery C. S., 1995, A&AS, 112, 525
- Prakapavičius et al. (2013) Prakapavičius D., Steffen M., Kučinskas A., Ludwig H.-G., Freytag B., Caffau E., Cayrel R., 2013, Memorie della Societa Astronomica Italiana Supplementi, 24, 111
- Scott et al. (2015) Scott P., Asplund M., Grevesse N., Bergemann M., Sauval A. J., 2015, A&A, 573, A26
- Sedlmayr (1974) Sedlmayr E., 1974, A&A, 31, 23
- Spite et al. (2005) Spite M., Cayrel R., Plez B., Hill V., Spite F., Depagne E., François P., Bonifacio P., Barbuy B., Beers T., Andersen J., Molaro P., Nordström B., Primas F., 2005, A&A, 430, 655
- Stasińska et al. (2012) Stasińska G. et al., ed. 2012, Oxygen in the Universe Vol. 54 of EAS Publications Series
- Steffen et al. (2015) Steffen M., Prakapavičius D., Caffau E., Ludwig H.-G., Bonifacio P., Cayrel R., Kučinskas A., Livingston W. C., 2015, ArXiv e-prints
- Takeda (2003) Takeda Y., 2003, A&A, 402, 343
- Tinsley (1979) Tinsley B. M., 1979, ApJ, 229, 1046
- Woosley et al. (2002) Woosley S. E., Heger A., Weaver T. A., 2002, Reviews of Modern Physics, 74, 1015