Measurement of Dijet Production in Diffractive Deep-Inelastic Scattering at HERA
Abstract:
The production of dijets is measured in diffractive deep-inelastic scattering at HERA. The data were recorded with the H1 detector at DESY in the years 2003-2007. Diffractive events are selected by requiring a gap in the rapidity distribution of the hadronic systen, where no particles are produced. Two jets are selected with transverse momenta in the hadronic-centre-of-mass system larger than and , respectively. Cross sections are measured single- and double-differentially in various kinematic quantities. The data are found to be in good agreement with NLO QCD calculations based on diffractive parton densities determined from inclusive diffractive cross section measurements.
1 Introduction
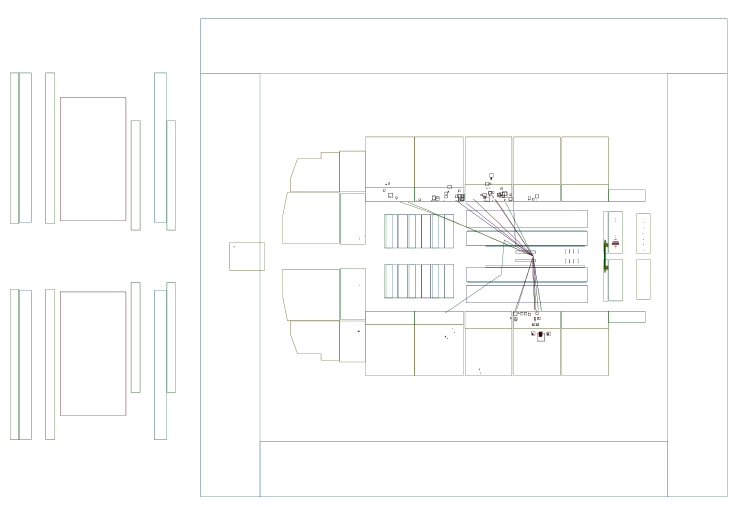
At HERA, reactions of electrons or positrons and protons, , are probed at centre-of-mass energies of . At sufficiently large negative momentum transfer squared from the ingoing to the outgoing electron111Throughout this paper, the term electron or the variable is used to denote both electrons and positrons, unless otherwise stated., , the process is referred to as deep-inelastic scattering (DIS), and defines a hard scale for perturbative QCD calculations. In the analysis presented here [1], dijet production in diffractive DIS is studied. The reaction may be written as , where the system contains at least two hard jets and the system is a proton or a low-mass excitation, carrying a large momentum fraction of the incoming proton. A typical event display is shown in figure 1. The low-mass system escapes detection to the left (forward direction). The electron is detected in the right-most part of the detector. The system consists of tracks and energy deposits in the calorimeter, forming two hard jets. There is a large gap in pseudorapidity222The axis is pointing along the proton flight direction. Polar angles are measured with respect to the axis. The pseudorapidity is defined as . between the acceptance limit of the detector in the forward direction and the most forward calorimeter deposit above noise level.
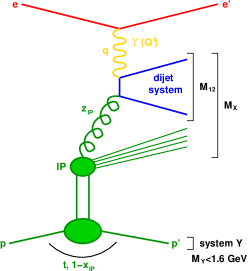
QCD calculations for this process are based on diffractive parton densities (DPDFs). The DPDFs describe the probability to find a parton with longitudinal momentum fraction in the proton, given that there is a diffractive signature, characterised by a longitudinally momentum fraction , momentum transfer of the outgoing proton and a hard scale . They are folded with hard matrix elements to describe jet production at next-to-leading order in the strong coupling. Experimentally, the DPDFs are determined from inclusive diffractive measurements, where no requirements on the hadronic system are made. As suggested by the scheme shown in figure 2, the DPDFs are determined with the ad-hoc assumption that they factorise into a probability to find a colourless object in the proton and parton density functions, ascribed to the structure of . The probability or “flux factor” is taken to depend on and only, whereas the parton density functions of only depend on the variable and the hard scale . For the present analysis, the H1 2006 DPDF fit B [2] is used to predict cross sections. Several measurements at HERA have confirmed the validity of the NLO calculations in diffractive DIS [3, 4, 5, 6, 7, 8]. The present analysis is exploiting the high statistics HERA II sample, in order to obtain more precise results and enable double-differential cross section measurements.
2 Data analysis
The analysis [1] is based on events recorded with the H1 detector [9] in the years 2005-2007, corresponding to an integrated luminosity of . DIS events are identified with an electron in the H1 rear calorimeter (SpaCal) [10]. This limits the accessible kinematic range in momentum transfer to . The hadronic final state is reconstructed from the detected tracks and calorimeter deposits, using an energy flow algorithm. The momentum transfer and the inelasticity are reconstructed with the method [11], which uses properties of both the electron and the hadronic final state. The inelasticity is restricted to .
Diffractive events are further selected with the condition of a Large Rapidity Gap (LRG) separating the hadronic systems and . The LRG condition requires that the most forward energy deposit above noise level in the H1 calorimeter has a pseudorapidity and that there are no signals in the H1 forward muon system or in the forward tagging system. The latter devices extend the reach for vetoing particles up to . The momentum fraction is restricted to the range . Here, is the invariant mass of the hadronic system , reconstructed from all detected particles after excluding the electron. The system is not detected; however from energy-momentum conservation one can deduce that its mass is limited by the diffractive selection to and the momentum transfer at the proton vertex is limited to .
The selection criteria are summarised in table 1.
| Extended Analysis Phase Space | Measurement Cross Section Phase Space | |
|---|---|---|
| DIS | ||
| Diffraction | ||
| LRG requirements | ||
| Dijets | ||
The final state is boosted to the restframe and jets are reconstructed using the inclusive jet algorithm [12] with recombination scheme and distance parameter . Dijet events are accepted if there are at least two jets with transverse momenta of the leading (subleading) jet fulfilling the conditions (). The jet pseudorapidity is restricted in the laboratory frame to , in order to ensure that the jets are well contained.

The events are selected in an extended analysis phase space, in order to ensure that migrations near the phase space boundaries can be well controlled. After correcting for detector effects, the phase space is restricted to the boundaries described in the text. For unfolding from detector objects to the particle level, a regularised unfolding technique is applied. Typically, the distributions are measured in twice as many bins as are unfolded later. Choosing more bins reconstructed than measured later, improves the unfolding results and reduces the correlations between data points. The resulting correlation coefficients are typically close to zero and do not exceed the range . In fact, only for a few cases, where the detector resolution is limited, correlations coefficients close to are observed. In addition to the fine resolution on detector level, there are extra bins ascribed to control regions outside the measurement phase space. The extra bins are also unfolded such that the normalisation of the prediction outside measurement phase space is taken from data. This procedure enhances the stability of the analysis to systematic effects related to the RAPGAP prediction and its reweighting.
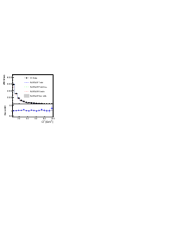
Control distributions of reconstructed variables at detector level are shown in figure 3. These are the momentum transfer , the leading jet transverse momentum, and the diffractive momentum fractions and , where and is the invariant mass of the dijet system. The variables are all well described by the prediction, which is used to describe migration effects between particle level and detector objects for the unfolding procedure. The prediction is evaluated using the RAPGAP event generator and a GEANT-based simulation of the H1 detector. It has been reweighted in three variables to improve the description; figure 3 shows the variables after reweighting.
3 Single-differential cross sections
Single-differential cross sections for diffractive dijet production in DIS are measured in the phase-space defined in table 1. The dominant systematic uncertainties are: the hadronic energy scale uncertainty of , model uncertainties of the RAPGAP prediction and normalisation uncertainties related to the LRG selection. The normalisation uncertainties amount to about , the model uncertainties have a size of typically and the hadronic energy scale causes uncertainties on the cross section of typically .

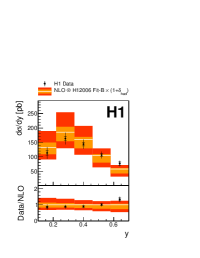
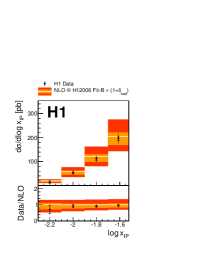
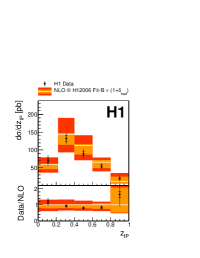

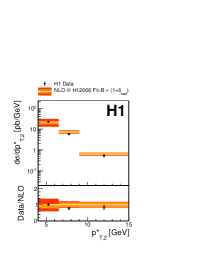
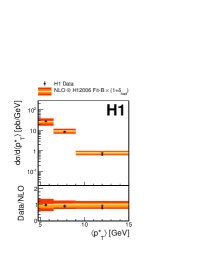
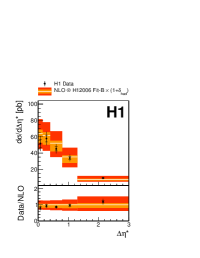
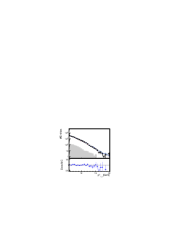
Single differential cross sections are measured as a function of the variables , , , , , , the average transverse jet momentum and the difference in pseudorapidity . The results are shown in figure 4 and 5. The data points are shown with their statistical and total uncertainties. The precision of the cross section measurements is limited by systematic effects in most cases. They are compared to NLO QCD predictions, obtained using the NLOJET++ program [13, 14] The predictions are shown with their DPDF uncertainties and their total uncertainties, then also including scale uncertainties. In general, the data precision is better than the precision of the prediction. In most cases the data precision is such that it is superior to the DPDF uncertainties, so the data have the potential to improve the DPDF fits. This is most evident for the distribution. It is worth to note that no data with has been included in the determination of the DPDF fit at the time. However, because the NLO predictions suffer from sizable scale uncertainties, it is difficult to draw further conclusions or to pursue a DPDF fit, unless NNLO calculations for jet production in DIS become available.
4 Double-differential cross sections and extraction of the strong coupling
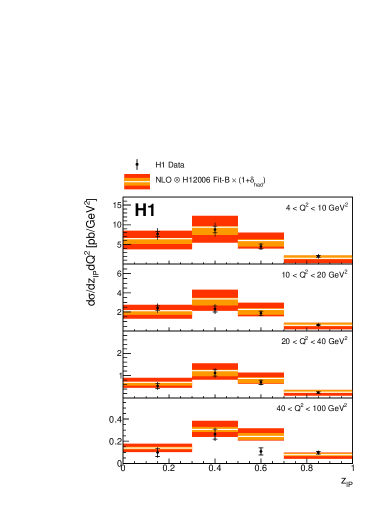
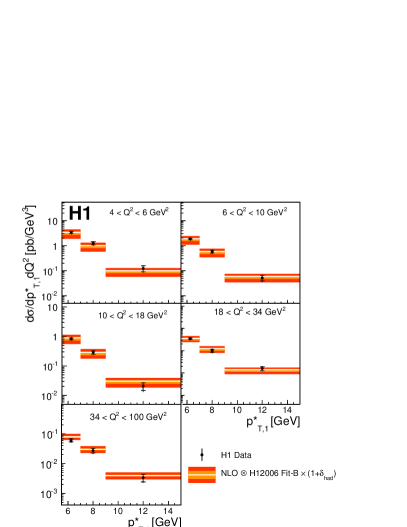
Double-differential cross sections are measured as a function of the variables and and as a function of the variables and . The results are shown in figure 6. Similar to the case of single-differential cross sections, the data precision is not limited by the statistical errors in most cases. The data are well described by the NLO QCD predictions, with the exception of one point in the () distribution. At high the data are more precise than the prediction for any choice of . In order to evaluate the sensitivity of the data to parameters of the QCD prediction, a fit of the strong coupling constant is performed, using the cross sections measured double-differentially in and . The fit yields . This first determination of in hard diffraction at HERA is carried out to as a consistency check and to evaluate the level of experimental as compared to theoretical uncertainties. The experimental precision of is better than the uncertainties stemming from the knowledge of DPDFs . The largest uncertainties are related to limitations of the NLO calculation, and from the variation of the renormalisation and factorisation scales, respectively.
5 Summary
Diffractive dijet production in DIS is measured at HERA, using data recorded with the H1 detector. As compared to previous measurements on smaller data samples, the precision has been improved significantly, and is now limited by systematic effects. Single- and double-differential cross sections are determined for a selection of variables. The data are consistent with NLO QCD calculations based on DPDF fits from inclusive diffractive data. This confirms that factorisation holds in diffractive deep-inelastic scattering. Using the NLO calculations, the strong coupling is extracted for the first time in hard diffraction at HERA, and found to be consistent with other measurements. The NLO QCD predictions, however, suffer from large scale uncertainties. Further interpretation of the data will benefit from NNLO calculations of jet production in deep-inelastic scattering.
References
- [1] V. Andreev et al. [H1 Collaboration], JHEP 1503 (2015) 092 [arXiv:1412.0928 [hep-ex]].
- [2] A. Aktas et al. [H1 Collaboration], Eur. Phys. J. C 48 (2006) 715 [hep-ex/0606004].
- [3] S. Chekanov et al. [ZEUS Collaboration], Phys.Lett. B545 (2002) 244–260, [hep-ex/0206020].
- [4] A. Aktas et al. [H1 Collaboration], Eur.Phys.J. C50 (2007) 1–20, [hep-ex/0610076].
- [5] A. Aktas et al. [H1 Collaboration], JHEP 10 (2007) 042, [arXiv:0708.3217].
- [6] S. Chekanov et al. [ZEUS Collaboration], Eur.Phys.J. C52 (2007) 813–832, [arXiv:0708.1415].
- [7] F. Aaron et al. [H1 Collaboration], Eur.Phys.J. C72 (2012) 1970, [arXiv:1111.0584].
- [8] V. Andreev et al. [H1 Collaboration], JHEP 1505 (2015) 056 [arXiv:1502.01683 [hep-ex]].
- [9] I. Abt et al. [H1 Collaboration], Nucl. Instrum. Meth. A 386 (1997) 310.
- [10] R. D. Appuhn et al. [H1 SPACAL Group Collaboration], Nucl. Instrum. Meth. A 386 (1997) 397.
- [11] C. Adloff et al. [H1 Collaboration], Z. Phys. C 76 (1997) 613 [hep-ex/9708016].
- [12] S. Catani, Y. L. Dokshitzer and B. R. Webber, Phys. Lett. B 285 (1992) 291.
- [13] Z. Nagy and Z. Trocsanyi, Phys. Rev. D 59 (1999) 014020 [hep-ph/9806317], Erratum-ibid. 62 (2000) 099902.
- [14] Z. Nagy and Z. Trocsanyi, Phys. Rev. Lett. 87 (2001) 082001 [hep-ph/0104315].