The scaling relations of early-type dwarf galaxies across a range of environments
Abstract
We present the results of a Keck-esi study of dwarf galaxies across a range of environment: the Perseus Cluster, the Virgo Cluster, the NGC 1407 group, and the NGC 1023 group. Eighteen dEs are targeted for spectroscopy, three for the first time. We confirm cluster membership for one Virgo dE, and group membership for one dE in the NGC 1023 group, and one dE in the NGC 1407 group for the first time. Regardless of environment, the dEs follow the same size-magnitude and -luminosity relation. Two of the Virgo dwarfs, VCC 1199 and VCC 1627, have among the highest central velocity dispersions ( km s-1 and km s-1) measured for dwarfs of their luminosity (). Given their small sizes ( pc) and large central velocity dispersions, we classify these two dwarfs as compact ellipticals rather than dEs. Group dEs typically have higher mean dynamical-to-stellar mass ratios than the cluster dEs, with for the group dwarfs, vs. for the cluster sample, which includes two cEs. We also search for trends in vs. distance from M87 for the Virgo Cluster population, and find no preference for dwarfs with high values of to reside in the cluster outskirts vs. centre.
keywords:
galaxies: dwarf – galaxies:evolution – galaxies: kinematics and dynamics1 Introduction
The total mass of a galaxy and its local environment are fundamental parameters that determine its average properties and evolutionary history. For a dwarf galaxy, its total mass is generally dominated by its dark matter, with the mass in stars making a smaller overall contribution. In order to measure the total mass of a dwarf galaxy, and probe its fraction of dark and stellar matter, a study of its dynamics is required. Outside of the Local Group where dwarfs can be resolved into their individual stars, such studies typically measure the motion of stars within a projected radius containing half of the total galaxy light (called the half-light or effective radius Re). Past studies of the dynamics of galaxies that are pressure-supported by random internal stellar motions (which are also typically old and cold gas-free systems) have ranged from the most massive elliptical galaxies to the lowest-luminosity dwarfs (e.g. Dabringhausen et al., 2008; Forbes et al., 2008; Wolf et al., 2010; Tollerud et al., 2011; Forbes et al., 2011; Misgeld & Hilker, 2011; Forbes et al., 2014).
When examining galaxy kinematics, the stellar mass regime of M⊙ is particularly interesting as it represents a transition from the most massive dwarf spheroidal (dSph) to the lowest-mass dwarf elliptical (dE) galaxies. Spanning this entire mass range are the less extended compact ellipticals (cEs) and ultra-compact dwarfs (UCDs). For a given stellar mass, dEs, cEs and UCDs overlap in terms of their dynamical mass, though cEs and UCDs are more compact and have larger velocity dispersions than dEs/dSphs, so they appear as a distinct population in size-luminosity and -luminosity diagrams. Indeed, the compact cEs/UCDs are also referred to as “true” dwarf ellipticals in Kormendy & Bender (2012), given they extend the scaling relations of elliptical galaxies to fainter magnitudes. Their location in these diagrams is consistent with the idea that UCDs are the remnant nuclei or cores of stripped dE galaxies, and cEs are the remnants of more massive stripped objects such as spirals and low mass ellipticals (e.g. Norris et al., 2014).
Velocity dispersions and dynamical masses have been measured for a number of relatively high-mass dEs (e.g. Geha et al., 2002, 2003; Chilingarian, 2009; Toloba et al., 2012, 2015), but such measurements for dEs with dynamical masses M⊙ are relatively rare outside of the Local Group (e.g. Forbes et al., 2011). Obtaining kinematics for such low-mass dE galaxies becomes difficult due to the combination of their low surface brightness and small velocity dispersions ( km s-1), necessitating high-resolution spectroscopy acquired with a fast telescope and spectrograph.
The high-mass dEs studied to date tend to be located in the Virgo Cluster, given its proximity and large population of such galaxies. A few studies have targeted dwarfs in other clusters including Fornax (e.g. De Rijcke et al., 2003), and recently Perseus (Penny et al., 2014b). Little is known however about the kinematics of dEs in group environments (with the exception of 3 dEs in the Local Group, see McConnachie 2012 for a compilation of Local Group galaxy kinematics).
Investigating the dynamics and scaling relations of dEs in various environments may help to shed light on the dominance of different processes that effect their evolution. In groups, the dominant process is likely to be tidal interactions between galaxies or with the group potential itself (Moore et al., 1996; Mastropietro et al., 2005; D’Onghia et al., 2009). In the simulations of Mayer et al. (2006), late-type galaxies in a Milky Way-like halo underwent strong tidal stripping, interactions, and ram pressure stripping, resulting in early-type dwarfs that are dark matter dominated in their central regions. Studies of galaxy dynamics are essential to identify these objects and measure the ratio of dark to luminous matter in their centres.
Tidal interactions and the stripping of low-mass galaxies can also lead to the formation of compact elliptical (cE) galaxies and ultra-compact dwarfs (UCDs). Compact ellipticals with masses comparable to dEs ( M⊙) overlap in luminosity and velocity dispersion with dEs, though their sizes are much smaller ( pc). Continuing this trend to lower masses and sizes are UCDs, which overlap in stellar mass and luminosity with dSphs. In the simulations of tidal stripping by Pfeffer & Baumgardt (2013), UCDs with stellar masses 106 M⊙ and effective radii 10-50 pc are expected to form from low-mass dE progenitors. Such objects have been identified to be relatively common around M87 (Brodie et al., 2011). Thus by examining the kinematics of galaxies in the overlap between cEs and dEs, we can better understand the role of tidal interactions on low-mass galaxy evolution.
Here we investigate the internal kinematics for a sample of 18 dwarf galaxies: 15 dEs and 3 possible cEs. The galaxies we examine have relatively low stellar masses of 108 M⊙ to 109 M⊙ and probe three different environments: the spiral dominated NGC 1023 group, the fossil group-like NGC 1407 group, and the Virgo Cluster. The targeted dEs span a range of size (), covering the complete size range examined in the literature. They are among the lowest stellar mass dEs examined outside of the Local Group to date, with the lowest-mass dEs in our sample having stellar mass M⊙, comparable to the stellar mass of NGC 205, the brightest dE in the Local Group. As well as central velocity dispersions, we present their sizes and luminosities. From these we calculate dynamical and stellar masses, and thus explore where such dE galaxies lie on key scaling relations including the sigma-luminosity and size-magnitude relations.
This paper is organised as follows. We describe our sample selection in Section 2. Our observations are described in Section 3.1, with the reduction of the spectroscopy covered in Section 3.2. Velocity measurements are presented in Section 3.3, along with photometry in Section 3.4. Our calculations of stellar and dynamical mass are presented in Section 4. We discuss our results in Section 5, and conclude in Section 6.
2 Sample Selection
Galaxies in the NGC 1023 group were selected from the catalogue of Trentham & Tully (2009). The three target galaxies have dE or intermediate-type morphology, and are brighter than , corresponding to at the distance of the NGC 1023 group ( Mpc, Brodie et al. 2011). NGC 1023_11 and NGC 1023_14 had their group membership confirmed in Trentham & Tully (2009), and we targeted NGC 1023_18 for spectroscopy for the first time.
We selected dwarfs in the NGC 1407 group ( Mpc) from the catalogue of Trentham et al. (2006). All targeted dwarfs are brighter than (), have dE morphologies, and have not previously had their central velocity dispersions measured. Three of the NGC 1407 dwarfs (NGC 1407_13, NGC 1407_47, and NGC 1407_48) have their group membership confirmed in Trentham et al. (2006). NGC 1407_36 and NGC 1407_37 had their group membership confirmed in Firth et al. (2006). We targeted NGC 1407_43 for spectroscopy for the first time.
Dwarf elliptical targets in the Virgo Cluster were selected from the ACS Virgo Cluster Survey (Côté et al., 2004), and the wide field imaging survey of Lisker et al. (2008). The dwarfs were selected to have a surface brightness high enough to obtain a spectrum with a signal-to-noise ratio S/N in less than 2 hr total integration time with the Echelle Spectrograph and Imager spectrograph (esi, Sheinis et al., 2002) on the Keck ii telescope. The majority of Virgo Cluster dwarfs targeted here had their cluster membership previously confirmed by the Sloan Digital Sky Survey (York et al., 2000), but they do not have measured velocity dispersions in the literature. VCC 1151 is targeted for spectroscopy for the first time. The targets have a range of (projected) cluster-centric distance, from 0.28 Mpc to 1.35 Mpc from M87, the central galaxy in the Virgo Cluster. Five of the Virgo targets were classified as E0 or E2 in the Virgo Cluster Catalogue (Binggeli et al., 1985). Despite these classifications, these galaxies are targeted due to their low stellar mass ( M⊙), placing them well within the dwarf galaxy regime. Their sizes are furthermore intermediate between those of cEs and dEs ( pc), making them interesting targets for the study of kinematics.
The basic properties of the observed dwarfs are given in Table 1. For simplicity, we adopt the names of Trentham & Tully (2009) and Trentham et al. (2006) for galaxies in the NGC 1023 and NGC 1407 groups. We take the names of the Virgo Cluster targets from the Virgo Cluster catalogue (Binggeli et al., 1985). Assuming the targeted dwarfs follow the -luminosity relation, they are expected to have central velocity dispersions comparable to, or exceeding, the esi instrumental resolution (see Section 3.1).
These data are supplemented with three dwarfs in the Perseus Cluster: CGW38, CGW39, and SA0426-002, first presented in Penny et al. (2014b). Perseus is a richer cluster than Virgo, providing a more extreme environment in which to study galaxy evolution. These dwarfs were observed with an identical set-up to the Virgo targets in this work, using esi and arcsec slit. The reduction of these data are described in Penny et al. (2014b).
| Galaxy | Other name | Type | Dist. | R | Re | Re | |
|---|---|---|---|---|---|---|---|
| (Mpc) | (mag) | () | (kpc) | ||||
| NGC 1023_11 | UGC 2165 | dE | 11.1 | 13.70 | 17.6 | 0.95 | 1.0 |
| NGC 1023_14 | UGC 1807 | Im | 11.1 | 14.38 | 22.8 | 1.23 | 1.4 |
| NGC 1023_18 | … | dE/I | 11.1 | 14.92 | 19.4 | 1.04 | 1.6 |
| NGC 1407_13 | ESO 548-G79 | dE | 26.8 | 13.03 | 14.9 | 1.93 | 1.9 |
| NGC 1407_36 | LEDA074838 | dE | 26.8 | 15.33 | 8.5 | 1.11 | 1.4 |
| NGC 1407_37 | LSBG F548-012 | dE | 26.8 | 15.52 | 11.6 | 1.50 | 1.1 |
| NGC 1407_43 | LSBG F549-023 | dE | 26.8 | 16.40 | 8.4 | 1.10 | 0.9 |
| NGC 1407_47 | LSBG F549-038 | dE | 26.8 | 16.70 | 6.3 | 0.83 | 1.3 |
| NGC 1407_48 | LSBG F548-026 | dE | 26.8 | 16.67 | 6.7 | 0.87 | 0.9 |
| VCC 50 | … | dE2 | 16.7 | 14.89 | 12.5 | 0.99 | 0.9 |
| VCC 158 | UGC 07269 | dE3 | 16.7 | 14.61 | 20.9 | 1.66 | 1.2 |
| VCC 538 | NGC 4309A | E0 | 14.90 | 4.8 | 0.54 | 2.3 | |
| VCC 1151 | NGC 4472 DW02 | dE0 | 16.7 | 15.29 | 17.5 | 1.39 | 1.2 |
| VCC 1199 | … | E2 | 14.91 | 3.4 | 0.27 | 2.9 | |
| VCC 1440 | IC 0798 | E0 | 13.55 | 6.9 | 0.54 | 4.8 | |
| VCC 1627 | … | E0 | 13.92 | 3.7 | 0.28 | 2.0 | |
| VCC 1896 | … | dSB0 | 16.7 | 13.82 | 14.6 | 1.16 | 1.2 |
| VCC 1993 | … | E0 | 14.28 | 10.7 | 0.86 | 4.6 |
3 Data
3.1 Observations
The dwarf elliptical galaxies were observed using the Echelle Spectrograph and Imager on the Keck ii 10 m telescope on the nights of 2013 September 25, 26, 2013 March 3, 4, and 2012 November 5, 6, 7. Each galaxy was observed in high resolution echelle mode giving a useful wavelength range of 4000 to 10,000 Å. The pixel scale varies from 0.12 arcsec pixel-1 in the blue to 0.17 arcsec pixel-1 in the red across the 10 echelle orders. The slit width was either 0.5 arcsec or 0.75 arcsec (see Table 2), with a slit length of 20 arcsec. This provided a resolving power of or , and instrumental resolutions of 15.8 km s-1 and 23.7 km s-1, for the arcsec and arcsec slits respectively. Generally the slit was aligned to parallactic angle, otherwise for dwarfs that deviated strongly from circular isophotes, we aligned the slit with the dwarf’s major axis.
Three or more single exposures were taken of each galaxy with the total exposure times listed in Table 2. The individual exposures were combined with an average sigma clipping algorithm in IRAF. We obtained spectra for several standard stars on each observing run using the same instrument settings as for the science data. These spectra were used as templates to determine velocity information for the dwarf galaxies (see below for details).
| Galaxy | Seeing | Exp. time | Slit width |
| (arcsec) | (min) | (arcsec) | |
| NGC 1023_11 | 0.9 | 30 | 0.75 |
| NGC 1023_14 | 0.7 | 120 | 0.75 |
| NGC 1023_18 | 0.7 | 80 | 0.75 |
| NGC 1407_13 | 0.7 | 15 | 0.75 |
| NGC 1407_36 | 0.7 | 60 | 0.75 |
| NGC 1407_37 | 0.7 | 80 | 0.75 |
| NGC 1407_43 | 0.5 | 100 | 0.75 |
| NGC 1407_47 | 0.5 | 100 | 0.75 |
| NGC 1407_48 | 0.7 | 80 | 0.75 |
| VCC 50 | 0.95 | 120 | 0.50 |
| VCC 158 | 0.95 | 100 | 0.50 |
| VCC 538 | 1.2 | 100 | 0.50 |
| VCC 1151 | 0.95 | 80 | 0.50 |
| VCC 1199 | 1.2 | 30 | 0.50 |
| VCC 1440 | 1.2 | 80 | 0.50 |
| VCC 1627 | 1.2 | 100 | 0.50 |
| VCC 1896 | 0.95 | 30 | 0.50 |
| VCC 1993 | 1.2 | 80 | 0.50 |
3.2 Spectroscopic Data Reduction
Basic data reduction for the esi spectroscopy was carried out using tasks within IRAF. Individual calibration frames such as bias, arcs and internal flat fields were combined to create master frames. The science frames, each of the same exposure time, were average combined in 2D. The individual science frames did not require shifting as the spatial alignment of the spectra was within 1 pixel from frame to frame. An average sigma clipping was used to reject cosmic rays.
Tracing and rectifying the spectra, wavelength calibration, extraction of 1D spectra in various apertures and sky subtraction were all performed using the MAKEE program written by T. Barlow. The trace was carried out using a bright standard star, which gave residuals of pixel for the orders of interest. The sky was measured from the edges of the slit, furthest from the galaxy centre. Although some faint galaxy light may be contained in the sky apertures, there was no indication of the CaT absorption lines in the sky spectra, so that this appears to be a very small effect.
For five Virgo galaxies, VCC 538, VCC 1199, VCC 1440, VCC 1627 and VCC 1993, the spectra extend further than the seeing profile. For these we extracted additional independent apertures either side of the galaxy centre, in addition to a central aperture of 4 pixels ( arcsec width). The midpoint of the apertures correspond to 1.4, 2.6, and 4.4 arcsec from the galaxy centre. The size of the off-centre extraction apertures was designed to achieve a similar S/N in each extraction independent of radius.
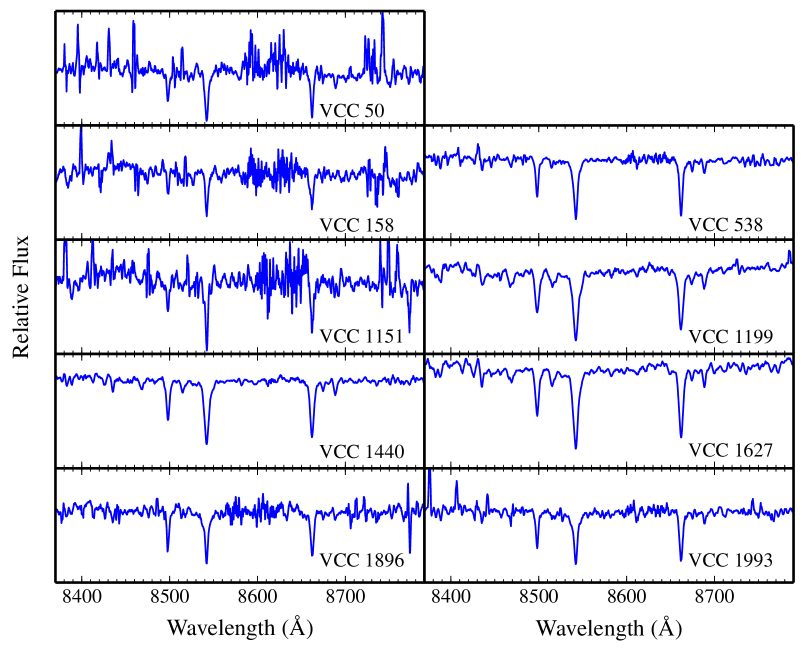
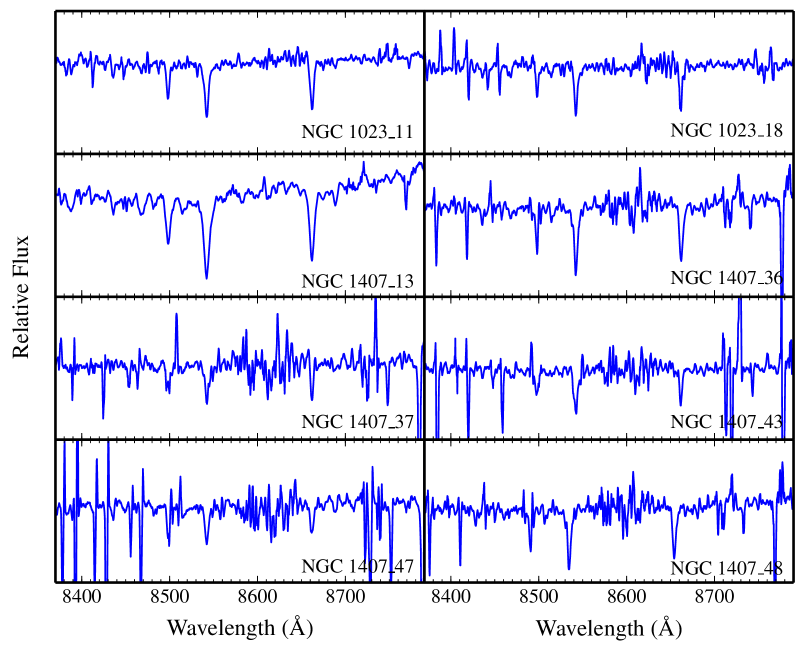
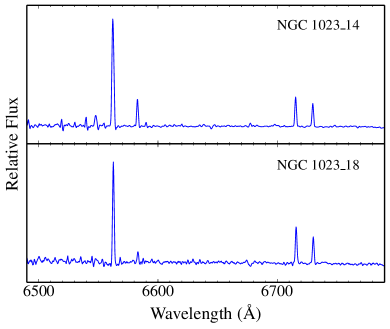
We plot central spectra for all dwarfs examined in this study to highlight the quality of our data. Spectra of the Virgo dwarfs are shown in Figure 1, and spectra for the NGC 1407 and NGC 1023 dwarfs in Figure 2. The CaT feature is plotted for all objects, excluding NGC 1023_18, where the S/N was insufficient for the CaT feature to be discernible against the sky lines. Due to the radial velocities of the dwarfs examined here, individual CaT lines are frequently shifted into regions of the spectra strongly affected by sky lines. We therefore smoothed the spectra for plotting purposes. For the science analysis, all spectra were unsmoothed/unbinned. To highlight that two of the NGC 1023 dwarfs are star forming, we display their spectra in the H region in Figure 3. For both NGC 1023_14 and NGC 1023_18, the H, [Nii] and [Sii] lines are clearly seen in emission, indicating ongoing star formation.
3.3 Velocity Measurements
Kinematics were measured for each extracted aperture using the Penalized Pixel-Fitting method (pPXF, Cappellari & Emsellem, 2004). The code broadens the spectra of the standard stars until they match the observed galaxy. We fitted the kinematics for several regions of each galaxy spectrum: the calcium triplet feature (CaT; 8498, 8542, 8662 Å), the H (6563 Å) line, the H line (4861 Å), the Na line (5893 Å), and the Fe and Mg features (5100-5400 Å). Where necessary, individual CaT lines that are blended with sky lines were excluded from the pPXF fit. The resulting heliocentric velocities () and velocity dispersions () are listed in Table 3.
NGC 1023_14 and NGC 1023_18 have H in emission, and we were unable to use this line for the determination of the velocity dispersions (our template stars only have absorption features). We furthermore excluded the H line for these objects, as this feature is in emission for NGC 1023_18, and partially infilled for NGC 1023_14. Instead, the dwarfs’ central velocity dispersions are calculated using the CaT, Na, and Fe/Mg features only. For NGC 1023_14, the CaT and Mg/Fe features do not have high enough S/N for the measurement of its velocity dispersion, so we are only able to provide a redshift for this object.
For consistency with the literature, we corrected our aperture values to central values within (e.g. Jorgensen et al., 1995), following Cappellari et al. (2006):
| (1) |
where is the central velocity dispersion, is the velocity dispersion in the central aperture, is the radius of the extraction aperture, and is the effective radius of the dwarf. The extraction apertures have radii 0.45 arcsec and 0.55 arcsec for the 0.5 and 0.75 arcsec slits respectively, calculated using the formula from Jorgensen et al. (1995). These central values are provided in Table 5.
The majority of the comparison samples we utilise in this work correct their values of to , though Toloba et al. (2014) and Ryś et al. (2014) correct their values to 1 . These values of will differ from by a few km s-1, within typical error bars, so we do not correct these comparison samples to .
| Galaxy Name | Galaxy | Recession Velocity |
|---|---|---|
| (km s-1) | (km s-1) | |
| NGC 1023_11 | ||
| NGC 1023_14 | … | |
| NGC 1023_18 | ||
| NGC 1407_13 | ||
| NGC 1407_36 | ||
| NGC 1407_37 | ||
| NGC 1407_43 | … | |
| NGC 1407_47 | ||
| NGC 1407_48 | ||
| VCC 50 | ||
| VCC 158 | ||
| VCC 538 | ||
| VCC 1151 | … | |
| VCC 1199 | ||
| VCC 1440 | ||
| VCC 1627 | ||
| VCC 1896 | ||
| VCC 1993 |
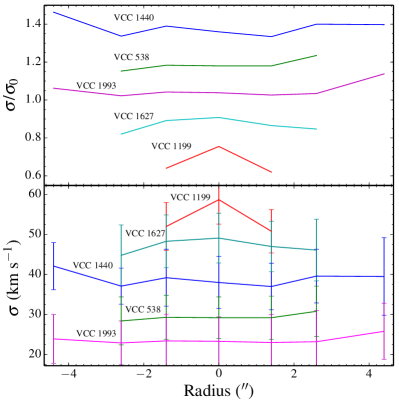
For the five Virgo dwarfs resolved beyond the seeing profile, we derive the velocity dispersion in several radial bins out to radii of arcsec, 300 pc at the distance of the Virgo Cluster. The velocity dispersions in each of the radial bins are provided in Table 4. We plot the velocity dispersion profiles for these five dEs in Figure 4. Within a radius of pc, the velocity dispersions profiles of these objects are nearly flat, with no evidence for central peaks or dips, similar to the results of Geha et al. (2003); Forbes et al. (2011); Toloba et al. (2011) for dEs, and those for the Local Group dSphs. To the same radius of arcsec, we do not find any rotation to within 10 km s-1 of the central value. Therefore, we classify these five dwarfs as slow rotators. More extended spectroscopy beyond their effective radii may uncover rotation in the outer regions of these objects. Nevertheless, the kinematics of these five dwarfs are dominated by random motions rather than rotation.
| Galaxy | Velocity dispersion in radial bin | ||||||
|---|---|---|---|---|---|---|---|
| (km s-1) | (km s-1) | (km s-1) | (km s-1) | (km s-1) | (km s-1) | (km s-1) | |
| VCC 538 | |||||||
| VCC 1199 | |||||||
| VCC 1440 | |||||||
| VCC 1627 | |||||||
| VCC 1993 | |||||||
3.3.1 Signal-to-noise effects
Several of our spectra have velocity dispersions approaching the instrumental resolution of Keck-esi. Velocity dispersion measurements are less accurate for low S/N spectra than for those with high S/N, such that for noisy galaxy spectra, the measured velocity dispersion typically approaches the instrumental resolution when the true is low. Furthermore, the reliability of the measured decreases. For example, Toloba et al. (2014) measure velocity dispersion differences km s-1 between their spectra with minimum S/N of 10, and those with previous measurements in the literature.
Six of our galaxies have velocity dispersions approaching the instrumental resolution. VCC 50 and VCC 158 have km s-1, the instrumental resolution of esi using the slit. For observations taken with the slit, NGC 1023_18, NGC 1407_36, NGC 1407_47, and NGC 1407_48 have km s-1, again comparable with the instrumental resolution. NGC 1407_36 has S/N in the CaT region, sufficiently high that its velocity dispersion can be reliably measured. For NGC 1407_48, while the CaT region is contaminated by sky lines, the S/N in the region of the H line esi spectra is high (S/N11). Thus we expect the value of km s-1 we determine for this galaxy to be robust.
The remaining galaxies with velocity dispersions comparable to the instrumental resolution have , and our values should therefore be considered as upper limits on the true velocity dispersions of these objects. NGC 1407_47 has S/N in the CaT region, and km s-1, comparable to the instrumental resolution using the slit. VCC 50, and VCC 158 having S/N and 8 respectively, and values similar to the esi resolution of 15.8 km s-1 using the slit. Given that the true values for VCC 50, VCC 158 and NGC 1407_47 are comparable to the instrumental resolution, they are likely over-estimated. We therefore consider their dynamical masses to be slightly over-estimated.
3.4 Size measurements and photometry
We measured the sizes of the dwarf galaxies in the NGC 1023 and NGC 1407 groups on archival CFHT images (Trentham et al., 2006; Trentham & Tully, 2009). The images were first sky subtracted, and masks for fore- and background objects created. Subsequently, we extracted the light profiles using the ellipse task in iraf (Jedrzejewski, 1987), with the ellipticity and position angle as free fitting parameters and logarithmic steps in semi-major axis. Sérsic functions were fitted to the light profiles using a Levenberg-Marquardt algorithm, taking into account the errors given by the ellipse task, and excluding the inner 2.5 arcsec from the fit in order to avoid being affected by the seeing and possible nuclei. The half-light semi-major axes () were obtained as one of the parameters of the fitting function. Finally, the effective radii were determined as the geometric mean of the semi-major and minor axes, i.e. , with the axis ratio averaged around the half-light semi-major axis.
For the Virgo galaxies we use the measurements of Janz & Lisker (2008). These were obtained in a non-parametric, but homogeneous manner. VCC 1199 is not included in the analysis of Janz & Lisker (2008), and we therefore adopt its size from Ferrarese et al. (2006). The Sérsic indices presented in Table 1 were also obtained from these two works.
The -band magnitudes for the galaxies in the NGC 1023 and NGC 1407 groups were taken from Trentham & Tully (2009) and Trentham et al. (2006), respectively. No errors were provided for the photometry of galaxies in both groups in the literature, though uncertainties in their distances will dominate the error budgets of their absolute magnitudes, which are used in future calculations of galaxy luminosity in Section 4. We assume errors of 5 per cent on their photometry in later calculations of stellar mass. For the Virgo galaxies we converted the -band values of Janz & Lisker (2008) to the -band using the conversion of Smith et al. (2002), and the colours of the galaxies (Janz & Lisker, 2009). The colour was selected as it uses the highest S/N bands of SDSS imaging, and have typical errors mag. For VCC 1199, we convert the -band value of Chen et al. (2010) to using its colour.
We investigate the robustness of our calculated -band magnitudes by comparing them to the literature. The adopted colours of our dwarfs agree very well with those of Chen et al. (2010), who compared their -band photometry to that of Janz & Lisker (2008). They found a scatter mag around a 1:1 relation between their measurements and those of Janz & Lisker (2008). We confirm this agreement by calculating band magnitudes for our dwarfs from the -band photometry and colours of Chen et al. (2010) for the 4 Virgo dwarfs present in their photometry catalogue. The recalculated -band magnitudes agree to within 0.1 mag of our values for all 4 galaxies.
We also compare our calculated values of to Kim et al. (2014), converting their -band values to . Eight of the Virgo dEs in our sample are also found in their catalogue. The -band values agree to within 0.3 mag for VCC 50, VCC 538, VCC1199, VCC 1440, VCC 1627, and VCC 1896, though are typically fainter than our calculated values. For VCC 158 and VCC 1993, the values we calculate from the photometry of Kim et al. (2014) are all fainter by mag than the values we present from the photometry of Janz & Lisker (2008) and Janz & Lisker (2009). Our photometry for these two galaxies agrees more closely with that presented by Chen et al. (2010). We find for VCC 158 and VCC 1993, the effective radii presented in Kim et al. (2014) are smaller than those of Janz & Lisker (2008) by per cent, resulting in the offset to fainter magnitudes when compared to our values of . The combined effect of using these fainter magnitudes and smaller sizes could reduce their dynamical-to-stellar mass ratios by per cent.
Absolute magnitudes and physical sizes for the dwarfs in the NGC 1023 and NGC 1407 groups are calculated using the distances to their central galaxies. Where available, distances from surface brightness fluctuations from Blakeslee et al. (2009) and Blakeslee et al. (2010) are used in the calculation of the absolute magnitudes and physical sizes of the Virgo dEs, otherwise the distance to M87 (16.7 Mpc) is used. The adopted R-band photometry for all galaxies is given in Table 1.
4 Mass estimates
| Galaxy | (10 Gyr) | (5 Gyr) | (3 Gyr) | ||||||
|---|---|---|---|---|---|---|---|---|---|
| (mag) | (km s-1 ) | ( M⊙) | ( M⊙) | ( M⊙) | ( M⊙) | (10 Gyr) | (5 Gyr) | (3 Gyr) | |
| NGC 1023_11 | 34.6 | ||||||||
| NGC 1023_14 | … | … | … | … | … | ||||
| NGC 1023_18 | 23.8 | ||||||||
| NGC 1407_13 | 65.9 | ||||||||
| NGC 1407_36 | 26.1 | ||||||||
| NGC 1407_37 | 29.9 | ||||||||
| NGC 1407_43 | … | … | … | … | … | ||||
| NGC 1407_47 | |||||||||
| NGC 1407_48 | 25.2 | ||||||||
| VCC 50 | |||||||||
| VCC 158 | |||||||||
| VCC 538 | 33.7 | ||||||||
| VCC 1151 | … | … | … | … | … | ||||
| VCC 1199 | 58.4 | ||||||||
| VCC 1440 | 39.6 | ||||||||
| VCC 1627 | 49.2 | ||||||||
| VCC 1896 | 24.6 | ||||||||
| VCC 1993 | 25.1 | ||||||||
| CGW 38 | 36.4 | ||||||||
| CGW 39 | 25.7 | ||||||||
| SA426_002 | 33.4 |
4.1 Stellar masses
Stellar masses are derived for the dEs from their -band magnitudes. As these systems are largely devoid of gas, the stellar mass is assumed to be equivalent to the baryonic mass. The absolute -band magnitude of each dwarf was converted to a luminosity, and then multiplied by an -band stellar mass-to-light () ratio. We assume that the uncertainty in the distance to the galaxy dominates the error in its luminosity. The stellar mass-to-light ratio exhibits variation depending on the simple stellar population (SSP) model and initial mass function (IMF) used, and these variations are explored in (Dabringhausen et al., 2008). In this work, we chose to take our stellar mass-to-light ratios from the SSP models of Maraston (2005), assuming a Kroupa IMF and a blue horizontal branch. However, without an analysis of their stellar populations, age, and metallicity, determining the correct stellar mass-to-light ratio for these galaxies requires additional assumptions.
Dwarf ellipticals exhibit a range of metallicity, and this metallicity can strongly affect their stellar mass-to-light ratios at optical wavelengths. For example, dEs in Virgo have metallicity ranging from [Fe/H] dex through to [Fe/H] dex (Chilingarian, 2009). For a given stellar population of age 10 Gyr, this would result in -band stellar mass-to-light ratios from 2.1 for the lowest metallicity objects, through to 3.3 for the most metal rich dwarfs. For the purpose of this work, we assume a constant metallicity when calculating the stellar mass-to-light ratios of these dEs, similar to Toloba et al. (2014). We also assume the majority of the dwarfs are metal poor, with , giving an -band stellar mass-to-light ratio .
The stellar mass-to-light ratio increases as the stellar population ages, as low-mass stars contribute less light per unit mass than high-mass stars. For example, some dEs in Virgo reveal evidence for intermediate-age stars (e.g. Toloba et al., 2012, 2014), with the mean age of their stellar population Gyr. If the mean age of the stars were 3 Gyr then the ratio would be systematically lower by a factor of about 2.5 than that of a stellar population with a mean age of 10 Gyr. In Toloba et al. (2014), their figure 16 shows that the majority of discy dEs have derived ages Gyr. Furthermore, those exhibiting stellar discs (consistent with an infall and morphological transformation origin) having younger ages than those without discs. Likewise, dEs in the group environments may have on average younger stellar population ages than those in a galaxy cluster. We therefore calculate stellar mass-to-light ratios for three different ages ranging from 3 to 10 Gyr. This corresponds to a change of the mass-to-light ratio from 0.9 to 2.4 for our assumed metallicity of .
Assuming old stellar populations with age 10 Gyr, the Virgo dwarfs in our sample have half-light stellar masses M⊙ i.e. stellar masses within 1 (or half of the total stellar mass). The majority of group dwarfs have M⊙, with the exception of NGC 1407_13, which has M⊙.
As an additional check, we compared our stellar masses to those obtained from -band photometry. The -band has the advantage that it is a good proxy for stellar mass, with the M/L ratio being less sensitive to metallicity variations than optical bands. Seven of our galaxies (NGC 1407_13, VCC 538, VCC 1199, VCC 1440, VCC 1627, VCC 1896, and VCC 1993) are present in the 2MASS extended source catalogue. For five of the dwarfs (NGC 1407_13, VCC 538, VCC 1199, VCC 1440 and VCC 1627), their -band stellar masses generally agree to within 50% of their values derived from -band photometry assuming the same stellar population of age 10 Gyr. The two exceptions are VCC 1993 and VCC 1826, which have -band stellar masses more than 50 per cent higher than their -band stellar masses within 1 . However, these two dwarfs are diffuse, and flux in their outer regions may therefore be missed in their -band photometry.
4.2 Dynamical masses
To calculate dynamical masses for our dwarfs, we used the method of Wolf et al. (2010) who presented a simple formula to calculate dynamical mass that is largely independent of orbital anisotropy for non-rotating, pressure-supported systems out to one half-light radius :
| (2) |
where is a measure of the system’s velocity dispersion.
For the size of each system we use the half-light radii listed in Table 1. In principle, the observed can be corrected to a uniform standard (such as the total, luminosity-weighted, infinite-aperture velocity dispersion) via the variable term (for further details see discussion by Forbes et al. 2011). Here we use the central value of (see Table 5) calculated at . Using Re and , is well approximated by 6.5 for Sérsic , typical for the dEs examined here.
Luminous dE galaxies may reveal some rotation (Geha et al., 2003; Toloba et al., 2011), for which the dynamical masses would need correcting. However, as noted above, we find no evidence for rotation in our five low-luminosity Virgo dEs with extended kinematics. Therefore we did not correct our values of for the effects of rotation prior to calculating the dynamical masses of the dEs.
To compare the dynamical mass (within the de-projected half-light radius) with the stellar mass, we follow Forbes et al. (2011) and use half of the total stellar mass to calculate the dynamical-to-stellar mass ratio. Half-light values for both stellar mass and dynamical mass are presented in Table 5 for all objects examined in this study, including the three Perseus dEs from Penny et al. (2014b). For VCC 50, VCC 158, and NGC 1407_47, the velocity dispersions are likely over-estimated (see Section 3.3.1), and therefore their dynamical masses presented in Table 5 are marked as upper limits.
5 Discussion
5.1 Scaling relations

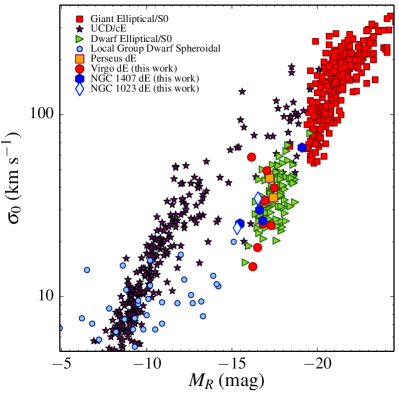
We examine the size-magnitude and -luminosity relations for our sample in Figure 5. For comparison to our galaxies, we utilise the sample of Norris et al. (2014) and Forbes et al. (2014), which provides absolute magnitudes, sizes, velocity dispersions, stellar masses and dynamical masses for compact objects with spectroscopically confirmed distances for objects identified from Hubble Space Telescope imaging. The sample also includes data for globular clusters, UCDs, dSphs, dEs, cEs, and Es. Furthermore, we compliment the comparison sample by data from Misgeld & Hilker (2011), Brodie et al. (2011) and Forbes et al. (2013), with objects spanning M⊙ to M⊙ in stellar mass (globular clusters through to giant ellipticals), and additional dEs in the Virgo Cluster from Toloba et al. (2014).
5.1.1 The size-magnitude relation
We present the size-magnitude relation for dwarfs in a range of environments in the left-hand panel of Figure 5. The majority of dwarfs targeted in this work have magnitudes fainter than , the region of the size-magnitude relation where the sizes of dEs/dSphs begin to diverge from those of giant and compact ellipticals. Regardless of environment, the dEs we examine here follow the same size-magnitude relation in Figure 5, and the majority overlap in size with dEs taken from the comparison sample of Norris et al. (2014). The fainter objects with mag begin to fill in the size-magnitude gap between dSphs and dEs. The dEs in the NGC 1023 and NGC 1407 groups have typical sizes for their luminosity, comparable to the brightest dwarfs in the Local Group and the faintest dEs we target in the Virgo Cluster. All the group dwarfs we examine here are more extended than cEs of comparable luminosity by pc, while the Virgo Cluster and Perseus Cluster objects exhibit a far wider range of size.
Two of the Virgo Cluster targets, VCC 1199 and VCC 1627, have sizes pc and pc respectively, placing them well below the size-luminosity relation traced by the majority of dEs at comparable magnitudes (). Instead, in the left-hand panel of Figure 5 they occupy the region of the size-magnitude relation traced by cE galaxies, with sizes comparable to M32 ( mag, pc). These M32-like objects may be the result of tidal stripping, and we will therefore examine their location on the -luminosity relation in Section 5.1.2 to see whether their dynamics are unusual for the luminosity.
5.1.2 The -luminosity relation
Prior to this work, Forbes et al. (2011) examined the velocity dispersions of dEs down to , and here we extend the study of dE kinematics down to for dEs in groups. As can be seen in the right-hand panel of Figure 5, all dEs in this study follow the same -luminosity relation as objects taken from the literature. Furthermore, three of the group dEs, NGC 1023_18, NGC 1407_47, and NGC 1407_48, are among the faintest dEs examined to date outside of the Local Group, bridging the luminosity gap between cluster dEs and Local Group dSphs. They have comparable values of to other faint dEs and the Local Group member NGC 205, and have lower values of than cEs at the same luminosity.
The -luminosity relation is a useful diagnostic for identifying galaxies with elevated velocity dispersions that may indicate a tidal stripping event. When a galaxy is tidally stripped, its luminosity and size will decrease, but its central velocity dispersion will remain relatively unchanged (Bender et al., 1992), decreasing by only a few per cent (e.g. Chilingarian et al., 2009).
Two Virgo dEs in our sample, VCC 1199 and VCC 1627, have velocity dispersions km s-1 and km s-1 respectively, among the highest measured for dEs of their luminosity. The high velocity dispersion of VCC 1199 lies on the region of the -luminosity relation occupied by cEs, while the value for VCC 1627 is too low to place it on the -luminosity relation seen for cEs of comparable luminosity (). As discussed in Section 5.1.1, these two galaxies are compact for their luminosity, with sizes pc, similar to cEs. With further tidal stripping, VCC 1627 will reduce in luminosity, and move onto the -luminosity relation for cEs. To place it onto the relation, VCC 1627 will need to dim by mag, losing M☉, losing 75 per cent of its current stellar mass.
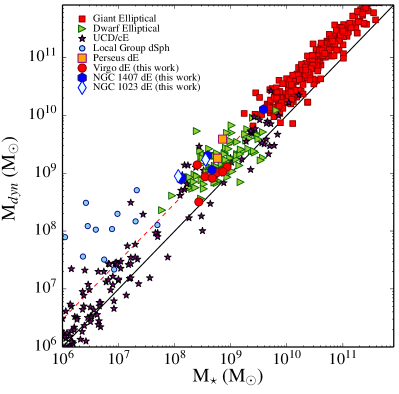
5.1.3 Dynamical vs. Stellar mass
While the Local Group dSphs are known to have high dynamical-to-stellar mass ratios, this is unknown for cluster dwarfs due to the difficulty in obtaining deep spectroscopy of faint dwarfs with sufficient resolution to obtain their central velocity dispersions. Using stability arguments, Penny et al. (2009) predict that dEs in the Perseus Cluster with stellar masses M⊙ are dark matter dominated throughout their structures in order to prevent their disruption by the cluster tidal potential. This would result in high mass-to-light ratios in their central regions, and we investigate whether this is the case for the dEs examined in this study by examining how the dynamical masses of the dEs compare to their stellar masses.
A large dynamical-to-stellar mass ratio may also indicate that a dE formed via tidal stripping. Dynamical-to-stellar masses much greater than unity are indicative of either a dark matter dominated object, else a kinematically disturbed or tidally stripped object that is no longer in dynamical equilibrium.
The dynamical vs. stellar mass diagram for all targeted dwarfs is shown in Figure 6, along with a comparison sample of objects from Norris et al. (2014), with additional dEs in Virgo provided by Toloba et al. (2014). For our sample, the stellar masses within assume an old stellar population with a mean age 10 Gyr and as described in Section 4. For the comparison sample, we restrict the mass range to objects with masses M⊙ to M⊙. This restriction in mass was applied to remove globular clusters from the comparison sample, but include UCD-like objects with masses similar to Omega Centauri ( M⊙), hypothesised to be the tidally stripped nucleus of a dE.
We find that Virgo dEs typically have Mdyn/M. These dwarfs are not dark matter dominated in their central regions, nor do they show evidence for being tidal remnants i.e. having compact sizes for a given luminosity.
However, a number of objects in our sample show elevated dynamical-to-stellar mass ratios, regardless of the assumed age of their stellar population. Within the Virgo Cluster, VCC 1199 exhibits the most elevated dynamical-to-stellar mass ratios, with assuming a mean stellar population age of 10 Gyr. In Perseus, SA 0426_002 has the most elevated dynamical-to-stellar mass ratio, with . This dwarf is likely tidally interacting with NGC 1275, the central galaxy of the Perseus Cluster (Penny et al., 2014b), and may not be in dynamical equilibrium as a result of this interaction, resulting in a high value of for its luminosity.
The group dEs typically exhibit higher values of than those in the Virgo and Perseus clusters, and six of the seven group dEs with measured velocity dispersions have . Assuming stellar populations of age 10 Gyr, the cluster dEs (Perseus and Virgo) have a mean value , vs for the group dEs. Lowering the mean stellar age of these objects will increase , as will decreasing their metallicities. However, the group targets extend to lower luminosities than the cluster targets, and it can be seen in Fig. 6 that lower luminosity galaxies exhibit higher values of . Our sample size, particularly for fainter galaxies, it not large enough to examine luminosity trends in with respect to environment.
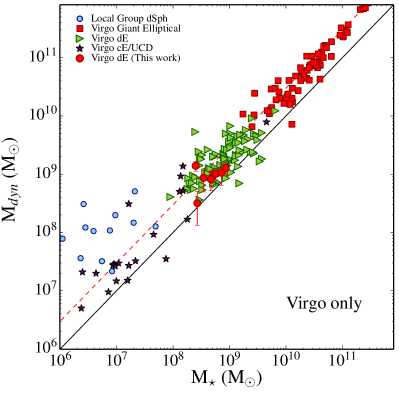
5.2 The Virgo Cluster
Due to its close distance of 16.7 Mpc (Blakeslee et al., 2009), large population of dEs with confirmed cluster membership, and deep imaging from which to obtain sizes, Virgo is the most common cluster in which to study dE kinematics. These dEs share a common environment and similar distance, removing some of the uncertainty in their size determination. We therefore re-plot Figure 6 for Virgo Cluster members only in Figure 7. The Local Group dSphs are included for comparison, as no internal kinematics have been determined for early-type dwarfs less massive than M☉ in the Virgo Cluster (or indeed, any environment outside the Local Group).
We compare our galaxies to the Virgo Cluster dE samples of Geha et al. (2003), Forbes et al. (2011), Rys et al. (2013), and Toloba et al. (2014). Virgo Cluster dEs present in the catalogue of Norris et al. (2014) are also included in Figure 7. Three of the compact Virgo dwarfs in our sample VCC 1199, VCC 1440, and VCC 1627 have also had their dynamical masses determined by Guérou et al. (2015) using velocity dispersions obtained from Gemini-GMOS IFU spectroscopy. Within the error bars, our dynamical masses agree with those obtained in their study, though we do not include these galaxies in Figure 7 for simplicity. The majority of our Virgo dE targets follow the vs. relation traced by Virgo giant ellipticals, though while the majority of giant Es trace a 3:1 relation, the dEs scatter more between a 3:1 and 1:1 relation. None of the Virgo dEs/cEs we examine exhibit elevated values of for their stellar mass.
5.2.1 Mass-to-light ratio vs. cluster-centric distance
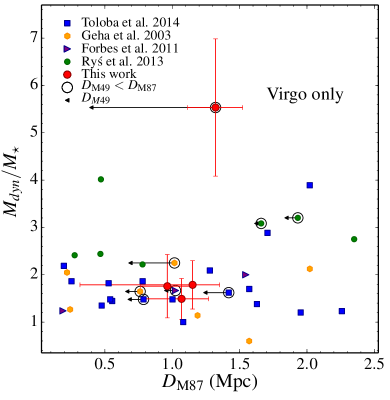
Ryś et al. (2014) tentatively identified a trend such that the dynamical-to-stellar mass ratio increases as a function of distance from the centre of the Virgo Cluster. The dEs with highest values of are at distances Mpc from M87, which is similar to the virial radius Mpc (Pointecouteau et al., 2005) of the Virgo A subcluster. This relation was found when “de-projecting” the distances of their Virgo dE sample using redshift independent distances in combination with angular separations from M87, removing some of the uncertainty in the distances of the objects from the cluster-centric galaxy M87.
We investigate whether a similar relation is seen when enlarging the sample with our Virgo dEs, de-projecting their distances from M87 with redshift independent distances from the literature. Distances from surface brightness fluctuations are found for 5 dEs in our sample (VCC 1199, Blakeslee et al. 2010; VCC 523, VCC 1440, VCC 1627, and VCC 1993, Blakeslee et al. 2009). We combine these distances with the angular separations of the dEs to M87 to provide a de-projected distance to M87.
We plot vs. de-projected cluster-centric distance in Figure 8 for the Virgo Cluster members. Four of the dEs have distances Mpc from the cluster centre. However, VCC 538 is located at a distance of Mpc, 6.3 Mpc more distant than M87 at Mpc. Virgo has complex substructure, and this distance places VCC 538 outside the Virgo A cluster (around M87).Its angular separation and radial velocity place it in the Virgo B subcluster, at a projected separation of 1 Mpc from M49, though it is at de-projected distance of 6.3 Mpc from M49, which again places it behind the cluster. VCC 538 is therefore not included in Figure 8. Additionally we include data from Geha et al. (2003), Forbes et al. (2011), Ryś et al. (2013) and Toloba et al. (2014) for which surface brightness fluctuation distances are available. The majority of the surface brightness fluctuation distances for both samples are taken from Blakeslee et al. (2009), with the distance to three dEs from Toloba et al. (2014) provided by Jerjen et al. (2004). This adds 7 dEs from Ryś et al. (2013) and 19 dEs from Toloba et al. (2014) to the plot.
It can be seen from Figure 8 that there is no clear trend for dEs at larger cluster-centric distance to exhibit higher values of than those at small cluster-centric distance. Some dEs in our sample lie closer in distance to M49, the brightest galaxy in the Virgo Cluster, and we highlight such galaxies with small separation from M49 by circling them in Figure 8. Despite highlighting galaxies that are at a smaller separation from M49 than M87, no trend is found in with cluster-centric distance with the remaining satellites of M87.
While the dEs with higher values of at first glance seem to favour large separations from M87, the samples contain dwarfs over 3 orders of magnitude in brightness. In our Virgo sample, along with both the Geha et al. (2003) and Toloba et al. (2014) comparison samples, the fainter dwarfs exhibit higher values of . Thus more kinematics of Virgo dEs at low luminosity are required to separate trends of with respect to both galaxy luminosity and cluster-centric distance.
5.2.2 VCC 538, VCC 1199 and VCC 1627- compact ellipticals?
Compact ellipticals typically have radii pc pc, and they are hypothesised to be the central remnants of intermediate-mass galaxies (e.g. Faber, 1973). Such galaxies have similar scaling parameters to M32, the prototype compact elliptical (cE) galaxy, having small effective radii for their respective magnitudes, similar to M32 with pc and . As such, they are interesting objects in which to study scaling relations and galaxy dynamics, as their central velocity dispersions can be used to help identify the nature of their progenitor (e.g Penny et al., 2014a). During the formation of such objects, tidal interactions are an effective way to slow down or even stop rotation, transforming a rotationally supported galaxy into a pressure supported one (e.g. Mayer et al., 2001a; Mayer et al., 2001b).
Five of our target dwarfs are classified as E0/E2 galaxies in NED, and two of them, VCC 1199, and VCC 1627, have effective radii pc. As such, their sizes and luminosities place them in the region of the size-magnitude relation occupied by cE galaxies (Figure 5), and these two galaxies may be the central bulges of tidally stripped disc of elliptical galaxies.
The remaining three galaxies classified as ellipticals have larger than pc, with pc VCC 538, pc for VCC 1440, and pc for VCC 1993, comparable in size to dEs at similar luminosity. Furthermore, all five of the dwarfs classified as Es have kinematics resolved beyond their centres, allowing us to determine if they are dominated by rotational or pressure support. None of the five exhibit rotation out to pc, suggesting they have undergone sufficient tidal interactions to remove evidence of rotation in their kinematics. We also note that there is ambiguity in the true size of VCC 538, as its radial velocity places it at a similar distance as M87 ( Mpc), where it would have pc, placing it on the cE sequence in the size-magnitude relation. Compact ellipticals are rare objects, and VCC 538, VCC 1199 and VCC 1627 have been claimed to belong to this class of galaxy (Binggeli et al., 1985). We therefore discuss the nature of VCC 538, VCC 1199, and VCC 1627 as cEs vs. dEs below.
VCC 538 lies 7 Mpc from the Virgo Cluster central galaxy M87, with surface brightness fluctuations placing VCC 538 at Mpc. Though it is closer in projection to the Virgo brightest cluster galaxy M49 than to M87, its surface brightness fluctuation distance places it more distant than M49 by Mpc. At Mpc, its effective radius corresponds to pc, and it would have . While on the low side, its size pc is not low enough to qualify VCC 538 as a compact elliptical. Instead, we classify it as a dE. Its value of is similar to dEs of comparable magnitude in our sample.
VCC 1199 has the most elevated value of velocity dispersion ( km s-1), smallest size ( pc), and highest value of dynamical-to-stellar mass ratio () of our Virgo dwarf targets. It is furthermore extremely red in colour for a dE of its magnitude, with (Ferrarese et al., 2006). It is offset from the red sequence of Virgo dEs by mag, with a colour comparable to a typical red sequence galaxy with mag. This red colour is typical for cEs of comparable magnitude (e.g. Smith Castelli et al., 2013), and is indicative of a tidal stripping event. As in previous studies, we hypothesise that this object is currently undergoing tidal stripping, having undergone enough tidal interactions to remove evidence of rotation in its radial velocity profile. It is at a de-projected distance 0.4 Mpc from M49, and therefore resides in one of the densest parts of the Virgo Cluster where harassment by other cluster members is likely. Peng et al. (2008) stated that VCC 1199 does not have a detectable globular cluster system, again consistent with it being a tidally stripped system.
In addition, Ferrarese et al. (2006) commented that the galaxy exhibits a spiral pattern, is tidally truncated by M49, and is a prime candidate for galaxy harassment. VCC 1199 is therefore likely a dynamically young object, with the spiral structure of its progenitor not yet erased by tidal interactions, else the spiral arms could be tidally induced. It exhibits a cuspy profile with an excess of light at its centre when fit with a single profile Sérsic fit (Kormendy et al., 2009), and this excess light may have been produced in a past tidal interaction. The object is offset from -luminosity locus for cEs by less than 0.5 mag and km s-1. However, the error on its velocity dispersion is km s-1, enough to move it onto the cE locus, and we therefore consider it to be a cE galaxy.
VCC 1627 is the second most compact object in our sample ( pc), with a high central velocity dispersion ( km s-1). Despite its extreme size and velocity dispersion, assuming an old stellar population, VCC 1627 has a low value of , i.e. it does not have an unusual dynamical mass for its luminosity. Based on its size alone, VCC 1627 would be considered a cE as it lies on the cE locus of the size-magnitude relation in Figure 5. However, its velocity dispersion places it off the -luminosity locus for cEs by km s-1, though similar sized galaxies are classified as cEs in Figure 5. We therefore tentatively classify VCC 1627 as a cE.
In their recent study of the dynamical-to-stellar mass ratio of UCDs and cEs, Forbes et al. (2014) found half a dozen objects to have extremely high mass ratios. One of those objects was VCC 1627 with a mass ratio of almost 7. The key parameters for VCC 1627 came from the compilation of Norris et al. (2014). In this case, their velocity dispersion of 47.3 km s-1 is from the Sloan Digital Sky Survey (SDSS, York et al., 2000), and is in good agreement with our central aperture value of km s-1. Their half-light radius of 274.2 pc compares well with our value pc. The main difference between this work and Norris et al. (2014) is in the value used for the stellar mass. Using a -band magnitude of and a Kroupa IMF, Norris et al. (2014) calculated a total stellar mass of 108 M⊙.
Here we used an -band magnitude of assuming the dE is at a distance of 15.6 Mpc, which provided a half-light luminosity of L⊙. In Table 5 we list the stellar mass converted from this luminosity corresponding to mean stellar ages of 10, 5 and 3 Gyr for a Kroupa IMF and metallicity of dex. The weak Balmer lines in the esi spectrum of VCC 1627 suggest a very old age and hence a half-light stellar mass of about M⊙ assuming a mean stellar age of 10 Gyr. This is in close agreement with our stellar mass calculated using the metallicity-insensitive -band, which provides a half-light stellar mass M⊙. Regardless of the age of the stellar population, the three stellar masses we calculated are all greater than that of Norris et al. (2014). However, if we take distance of VCC 1627 to be 7.7 Mpc, based on its velocity of 236 km s-1 as provided by the NASA Extragalactic Database (NED), then we re-calculate a stellar mass of 108 M⊙, identical to that used in Forbes et al. (2014) and Norris et al. (2014). The distance to VCC 1627 provided by NED would place the dwarf well outside the Virgo Cluster, thus we use its distance from surface brightness fluctuations. We therefore obtain a dynamical-to-stellar mass ratio of assuming a mean stellar age of 10 Gyr and a distance of 15.6 Mpc. Our value of is no longer an extreme mass ratio, and is only slightly elevated above unity.
5.2.3 Flat velocity dispersion and radial velocity profiles
The majority of the Virgo dEs in our sample with extended kinematic measurements have nearly flat velocity dispersion profiles, with only VCC 1199 exhibiting a clear central peak. Flat velocity dispersion profiles in dEs are also found by Forbes et al. (2011), Toloba et al. (2011), and Ryś et al. (2013). A comparable result is observed for the Local Group dSphs, which exhibit flat velocity dispersion profiles out to kpc from their centres (e.g. Walker et al. 2007). Assuming these galaxies are in virial equilibrium, this is taken as evidence that the Local Group dSphs possess extended dark matter haloes that dominate their total mass. However, the dEs typically have values of within 1 , implying their central kinematics are not dark matter dominated, comparable to the results of Toloba et al. (2011). The lack of central peaks in the velocity dispersion profiles of the dwarfs also show that their central kinematics are not dominated by intermediate-mass black holes.
Furthermore, we do not detect any rotation in the same five Virgo dwarfs to within km s-1 of their central values, with typical errors on their measured radial velocities km s-1. All five dwarfs have cluster-centric distance that place them within one virial radius of the Virgo A / M87 subcluster, though VCC 538 has a distance from surface brightness fluctuations that places it outside the main cluster. VCC 1199 is furthermore likely in the Virgo B / M49 subcluster, again subject to a high local galaxy density favourable to numerous galaxy-galaxy interactions. With no evidence of rotation in their kinematics, the five dEs in our sample with extended kinematics are slow rotators. Given their central location and lack of rotation, these objects have undergone sufficient tidal interactions that all evidence for rotation has been erased from their kinematics (see the simulations of e.g. Mastropietro et al., 2005).
Toloba et al. (2014) find a similar correlation for dEs in Virgo, such that 10 of the 11 slow rotators in their sample are found within 1 Mpc of the Virgo Cluster central galaxy M87. After several passes through the cluster centre, the progenitor is heated, and transformed into a pressure supported system, and objects at smaller cluster-centric radii will be transformed more quickly. Therefore, if the dEs and cEs in our sample have undergone enough interactions, they will not exhibit rotation in their kinematics, and are pressure supported systems.
5.3 Group dEs
We present velocity dispersions for seven dEs in the NGC 1023 and NGC 1407 groups. The two groups are very different: NGC 1023 is an un-evolved group, consisting of a few spiral galaxies, whereas NGC 1407 is often taken to be a nearby analogue of a fossil group, dominated by its central elliptical. Despite their very different environments to the Virgo and Perseus clusters, the group dEs follow the same size-magnitude and -luminosity relations as objects in higher density environments. For both groups, the group dEs with lie on the branch in the size-magnitude relation traced by local group dSphs and the brighter dE galaxies.
The NGC 1023 group is remarkably lacking in bright, passive dEs, with a dE fraction 45 percent of all dwarfs, vs. a dE fraction of 80 percent of all dwarfs in the NGC 1407 group (Trentham & Tully, 2009). Indeed, two of the dwarfs we investigate, NGC 1023_14 and NGC 1023_18, have ongoing star formation. NGC 1023_18 has a large separation Mpc from NGC 1023, and is thus unlikely to have been quenched by its group environment. However, NGC 1023_18 is located at a projected distance kpc from NGC 1023, where it might be expected to be tidally stripped by its host galaxy, and may therefore be tidally perturbed, increasing its velocity dispersion. If bright dEs are the remnants of tidally stripped disc galaxies, sparse groups such as the Local Group and the NGC 1023 group are likely inefficient at transforming infalling discs into objects with little or no star formation.
Six of the seven group dEs examined here have elevated values of , with the fainter dEs with exhibiting the highest values. The group dEs fall into the luminosity gap where few dEs outside of the Local Group have measured kinematics. From the left-hand panel of Figure 6, these dEs in the NGC 1023 and NGC 1407 groups exhibit values of , comparable to those of the brightest dSphs in the Local Group. These elevated values of suggest that like the Local Group dSphs, the faintest dEs in our sample are dominated by dark matter within 1 . Our calculated values of for the faint dEs also agree with those predicted in Penny et al. (2009) for dEs of comparable luminosity in the Perseus Cluster. However, we caution that the faintest dEs in this study have velocity dispersions comparable to the resolution of Keck-esi, and their true velocity dispersions, and hence dynamical masses, may be lower than those measured here.
Dwarf ellipticals in low density environments typically have younger mean stellar ages than those in cluster cores. For example, within the Coma Cluster, dEs at a cluster-centric distance of 2.5 Mpc have mean stellar ages half that of dEs in the centre of Coma (Smith et al., 2012). Thus we may be over-estimating the -band stellar mass-to-light ratios for the group dEs by assuming they have the same mean stellar ages as those in the Virgo Cluster. This effect is clearly seen in Table 5, where the stellar masses calculated using -band luminosities are lower for a younger stellar population. Ideally, we would determine the stellar masses for all the dEs in our sample using -band photometry, for which the stellar mass-to-light ratios are fairly insensitive to stellar age for galaxies with mean stellar ages Gyr. Unfortunately, well-measured -band magnitudes are not available for the majority of our group dEs, as they are too low surface brightness to be detected in the 2MASS survey. Therefore the calculated values assuming a mean stellar age of 10 Gyr are upper limits on their stellar mass, and the true values of for these objects are likely higher.
6 Conclusions
In this work, we have measured velocity dispersions for dE galaxies in three environments: the Virgo Cluster, the E/S0 dominated NGC 1407 group, and the spiral dominated NGC 1023 group. We supplemented these data with three dEs in the Perseus Cluster first presented in Penny et al. (2014b). While the majority of studies to date have focussed on dEs in the cluster environment, we have extended the study of these objects to less dense group regions. Central velocity dispersions were measured for 15 dwarf using the Keck-esi spectrograph, with velocity dispersion profiles measured for five compact dEs/cEs in the Virgo Cluster.
We found that the five compact dEs in the Virgo Cluster with sizes pc have flat velocity dispersion profiles out to 300 pc from the centres ( for the three most compact objects in our sample), with no evidence for central peaks as found for more massive galaxies such as giant ellipticals. We furthermore found no evidence for rotation in these 5 compact Virgo dwarfs to the same radius, and they are instead pressure supported slow rotators. Two of the Virgo galaxies, VCC 1199 and VCC 1627 have sizes pc, and velocity dispersions km s-1, and we therefore classify these objects as compact ellipticals.
Despite the range of environments examined here, from the spiral dominated NGC 1023 group, the E/S0 dominated NGC 1407 group, through to the Virgo and Perseus clusters, the dEs and cEs we examined here follow the same -luminosity and size-magnitude relations. There is a slight preference for dEs in groups to exhibit higher values of , with a mean value of for group dEs, vs. for cluster dEs. We note that this difference may be due to the group dwarfs having lower luminosity than our Virgo Cluster targets, else they could host different stellar populations. We also search for trends in vs. distance from M87 for dEs in the Virgo Cluster, by “de-projecting” their distances from M87 using surface brightness fluctuation distances. We supplemented our dE sample of five Virgo dwarfs with redshift independent distances with data taken from the literature. No trend is found between and distance from M87, with no preference for dEs with high values of to reside in the outskirts or centre of the Virgo Cluster.
Acknowledgements
SJP acknowledges the support of an Australian Research Council Super Science Postdoctoral Fellowship grant FS110200047 and postdoctoral funding from the University of Portsmouth. JJ and DAF thank the ARC for financial support via DP130100388. We thank Caroline Foster, Nicola Pastorello, and Vincenzo Pota for their assistance with our observations. We thank the referee whose comments helped improve this paper. This project made use of the NASA Extragalactic Database (NED) and data products from the Two Micron All Sky Survey, which is a joint project of the University of Massachusetts and the Infrared Processing and Analysis Center/California Institute of Technology, funded by the National Aeronautics and Space Administration and the National Science Foundation. We thank the staff of the W. M. Keck Observatory for their support. Some the data presented herein were obtained at the W.M. Keck Observatory, which is operated as a scientific partnership among the California Institute of Technology, the University of California and the National Aeronautics and Space Administration. This work was supported in part by National Science Foundation Grant No. PHYS-1066293 and the hospitality of the Aspen Center for Physics. The authors wish to recognise and acknowledge the very significant cultural role and reverence that the summit of Mauna Kea has always had within the indigenous Hawaiian community. We are most fortunate to have the opportunity to conduct observations from this mountain.
References
- Bender et al. (1992) Bender R., Burstein D., Faber S. M., 1992, ApJ, 399, 462
- Binggeli et al. (1985) Binggeli B., Sandage A., Tammann G. A., 1985, AJ, 90, 1681
- Blakeslee et al. (2009) Blakeslee J. P., et al., 2009, ApJ, 694, 556
- Blakeslee et al. (2010) Blakeslee J. P., et al., 2010, ApJ, 724, 657
- Brodie et al. (2011) Brodie J. P., Romanowsky A. J., Strader J., Forbes D. A., 2011, AJ, 142, 199
- Cappellari et al. (2006) Cappellari M., et al., 2006, MNRAS, 366, 1126
- Chen et al. (2010) Chen C.-W., Côté P., West A. A., Peng E. W., Ferrarese L., 2010, ApJS, 191, 1
- Chilingarian (2009) Chilingarian I. V., 2009, MNRAS, 394, 1229
- Chilingarian et al. (2009) Chilingarian I., Cayatte V., Revaz Y., Dodonov S., Durand D., Durret F., Micol A., Slezak E., 2009, Science, 326, 1379
- Côté et al. (2004) Côté P., et al., 2004, ApJS, 153, 223
- D’Onghia et al. (2009) D’Onghia E., Besla G., Cox T. J., Hernquist L., 2009, Nature, 460, 605
- Dabringhausen et al. (2008) Dabringhausen J., Hilker M., Kroupa P., 2008, MNRAS, 386, 864
- De Rijcke et al. (2003) De Rijcke S., Dejonghe H., Zeilinger W. W., Hau G. K. T., 2003, A&A, 400, 119
- Faber (1973) Faber S. M., 1973, ApJ, 179, 423
- Ferrarese et al. (2006) Ferrarese L., et al., 2006, ApJS, 164, 334
- Firth et al. (2006) Firth P., Evstigneeva E. A., Jones J. B., Drinkwater M. J., Phillipps S., Gregg M. D., 2006, MNRAS, 372, 1856
- Forbes et al. (2008) Forbes D. A., Lasky P., Graham A. W., Spitler L., 2008, MNRAS, 389, 1924
- Forbes et al. (2011) Forbes D. A., Spitler L. R., Graham A. W., Foster C., Hau G. K. T., Benson A., 2011, MNRAS, 413, 2665
- Forbes et al. (2013) Forbes D. A., Pota V., Usher C., Strader J., Romanowsky A. J., Brodie J. P., Arnold J. A., Spitler L. R., 2013, MNRAS, 435, L6
- Forbes et al. (2014) Forbes D. A., Norris M. A., Strader J., Romanowsky A. J., Pota V., Kannappan S. J., Brodie J. P., Huxor A., 2014, MNRAS, 444, 2993
- Geha et al. (2002) Geha M., Guhathakurta P., van der Marel R. P., 2002, AJ, 124, 3073
- Geha et al. (2003) Geha M., Guhathakurta P., van der Marel R. P., 2003, AJ, 126, 1794
- Guérou et al. (2015) Guérou A., et al., 2015, ApJ, 804, 70
- Janz & Lisker (2008) Janz J., Lisker T., 2008, ApJ, 689, L25
- Janz & Lisker (2009) Janz J., Lisker T., 2009, ApJ, 696, L102
- Jedrzejewski (1987) Jedrzejewski R. I., 1987, MNRAS, 226, 747
- Jerjen et al. (2004) Jerjen H., Binggeli B., Barazza F. D., 2004, AJ, 127, 771
- Jorgensen et al. (1995) Jorgensen I., Franx M., Kjaergaard P., 1995, MNRAS, 276, 1341
- Kim et al. (2014) Kim S., et al., 2014, ApJS, 215, 22
- Kormendy & Bender (2012) Kormendy J., Bender R., 2012, ApJS, 198, 2
- Kormendy et al. (2009) Kormendy J., Fisher D. B., Cornell M. E., Bender R., 2009, ApJS, 182, 216
- Lisker et al. (2008) Lisker T., Grebel E. K., Binggeli B., 2008, AJ, 135, 380
- Maraston (2005) Maraston C., 2005, MNRAS, 362, 799
- Mastropietro et al. (2005) Mastropietro C., Moore B., Mayer L., Debattista V. P., Piffaretti R., Stadel J., 2005, MNRAS, 364, 607
- Mayer et al. (2001a) Mayer L., Governato F., Colpi M., Moore B., Quinn T. R., Baugh C. M., 2001a, Ap&SS, 276, 375
- Mayer et al. (2001b) Mayer L., Governato F., Colpi M., Moore B., Quinn T., Wadsley J., Stadel J., Lake G., 2001b, ApJ, 547, L123
- Mayer et al. (2006) Mayer L., Mastropietro C., Wadsley J., Stadel J., Moore B., 2006, MNRAS, 369, 1021
- McConnachie (2012) McConnachie A. W., 2012, AJ, 144, 4
- Misgeld & Hilker (2011) Misgeld I., Hilker M., 2011, MNRAS, 414, 3699
- Moore et al. (1996) Moore B., Katz N., Lake G., Dressler A., Oemler A., 1996, Nature, 379, 613
- Norris et al. (2014) Norris M. A., et al., 2014, MNRAS, 443, 1151
- Peng et al. (2008) Peng E. W., et al., 2008, ApJ, 681, 197
- Penny et al. (2009) Penny S. J., Conselice C. J., de Rijcke S., Held E. V., 2009, MNRAS, 393, 1054
- Penny et al. (2014a) Penny S. J., Forbes D. A., Strader J., Usher C., Brodie J. P., Romanowsky A. J., 2014a, MNRAS, 439, 3808
- Penny et al. (2014b) Penny S. J., Forbes D. A., Pimbblet K. A., Floyd D. J. E., 2014b, MNRAS, 443, 3381
- Pfeffer & Baumgardt (2013) Pfeffer J., Baumgardt H., 2013, MNRAS, 433, 1997
- Pointecouteau et al. (2005) Pointecouteau E., Arnaud M., Pratt G. W., 2005, A&A, 435, 1
- Ryś et al. (2013) Ryś A., Falcón-Barroso J., van de Ven G., 2013, MNRAS, 428, 2980
- Ryś et al. (2014) Ryś A., van de Ven G., Falcón-Barroso J., 2014, MNRAS, 439, 284
- Sheinis et al. (2002) Sheinis A. I., Bolte M., Epps H. W., Kibrick R. I., Miller J. S., Radovan M. V., Bigelow B. C., Sutin B. M., 2002, PASP, 114, 851
- Smith Castelli et al. (2013) Smith Castelli A. V., González N. M., Faifer F. R., Forte J. C., 2013, ApJ, 772, 68
- Smith et al. (2002) Smith J. A., et al., 2002, AJ, 123, 2121
- Smith et al. (2012) Smith R. J., Lucey J. R., Price J., Hudson M. J., Phillipps S., 2012, MNRAS, 419, 3167
- Tollerud et al. (2011) Tollerud E. J., Bullock J. S., Graves G. J., Wolf J., 2011, ApJ, 726, 108
- Toloba et al. (2011) Toloba E., Boselli A., Cenarro A. J., Peletier R. F., Gorgas J., Gil de Paz A., Muñoz-Mateos J. C., 2011, A&A, 526, A114
- Toloba et al. (2012) Toloba E., Boselli A., Peletier R. F., Falcón-Barroso J., van de Ven G., Gorgas J., 2012, A&A, 548, A78
- Toloba et al. (2014) Toloba E., et al., 2014, ApJS, 215, 17
- Toloba et al. (2015) Toloba E., et al., 2015, ApJ, 799, 172
- Trentham & Tully (2009) Trentham N., Tully R. B., 2009, MNRAS, 398, 722
- Trentham et al. (2006) Trentham N., Tully R. B., Mahdavi A., 2006, MNRAS, 369, 1375
- Wolf et al. (2010) Wolf J., Martinez G. D., Bullock J. S., Kaplinghat M., Geha M., Muñoz R. R., Simon J. D., Avedo F. F., 2010, MNRAS, 406, 1220
- York et al. (2000) York D. G., et al., 2000, AJ, 120, 1579