Magneto-Infrared Study of Topological Insulator Bi2Se3
Abstract
We present a magneto-infrared spectroscopic study of thin single crystal flakes. Magneto-infrared transmittance and reflectance measurements are performed in the Faraday geometry at K in a magnetic field up to T. Thin flakes (much less than m thick are stabilized on the Scotch tape, and the reduced thickness enables us to obtain appreciable far-infrared transmission through the highly reflective single crystals. A pronounced electron-phonon coupling is manifested as a Fano resonance at the optical phonon mode in Bi2Se3, resulting from the quantum interference between the optical phonon mode and the continuum of the electronic states. However, the Fano resonance exhibits no systematic line broadening, in contrast to the earlier observation of a similar Fano resonance in using magneto-infrared reflectance spectroscopy.
pacs:
76.40.+b, 78.30.-jyear number number identifier LABEL:FirstPage101 LABEL:LastPage#1102
Bismuth selenide (Bi2Se3) is well known for its large Seebeck coefficient and thermal figure of merit since the 50sIof57 ; Bla57 , and recently it has been shown as a physical realizationZha09 ; Xia09 of the 3D topological insulators (TIs).Has09 ; Moo10 ; Has10 ; Rev Along with Bi2Te3, Sb2Te3 and some other II2V3 binary alloys, 3D topological insulators are establishing a new forefront for the next-generation nanoelectronic, spintronic, thermoelectric and quantum computational devices.Has09 ; Moo10 ; Has10 ; Rev ; Plu02 ; Fu08 The bulk of a TI is expected to be an insulator, because the conduction band and the valence band are separated by a sizable bandgap. The insulating bulk is enclosed by a robust conducting surface state, containing a single gapless Dirac cone (for the Bi2Se3 case). The robust surface state is protected by the time-reversal symmetry, and the large spin-orbit coupling leads to several interesting spin-relavent phenomena. Such a unique band structure has been predicted by the first principles band structure calculation and confirmed by angle resolved photoemission spectroscopy.Rev Bi2Se3 is usually regarded as a canonical TI, because it has a one-valley conduction-band minimum and a one-valley valence-band maximum occurring at the centre of the Brillouin zone separated by a sizable direct bandgap eV.Mis97 Between the band edges, it spans a single gapless Dirac cone with the Dirac point located around eV below the bottom edge of the conduction band.Zha09
The unique topology of a TI leads to many interesting new coherent quantum phenomenaQi10 , and one of them is an intrinsic magnetoelectric couplingTse10 that allows an applied magnetic (electric) field to induce an effective electric (magnetic) field in the same direction. An unusual magnetic-field dependent phonon softening observed via the Fano resonanceFan61 at the phonon mode (cm-1) in Bi2Se3 has been regarded as evidence in support of the magnetoelectric coupling in non-trivial TIs.Laf10 An applied magnetic field along the trigonal -axis induces a local electric field acting on the Bi ions via the magnetoelectric effect, and the local electric field causes a change in the lattice dynamics and a softening (linewidth broadening) of the phonon mode.Laf10 However, a similar concurrent infrared reflectance studyBut10 and an early studyRic77 on do not exhibit such a unique asymmetric Fano lineshape at the phonon mode. More recently, a similar Fano resonance at the phonon mode has been observed in Bi2Se2Te and lightly Ca-doped , and it is temperature dependent with more pronounced Fano lineshape at the lower temperatures.Pie12 In this Letter, we present a magneto-infrared transmittance and reflectance spectroscopic study on Bi2Se3 ultrathin single crystal flakes at the liquid helium temperature, in which a Fano resonance is indeed observed at the phonon mode, but the linewidth is insensitive to the increasing magnetic field. We interpret our data, as well as that reported in previous worksLaf10 ; But10 ; Ric77 ; Pie12 , using the charged phonon theory.Ric92 ; Cap12
Bi2Se3 is a layered compound with quintuple layers, each with five atomic layers, stacked along the trigonal axis.Bla57 The synthesis of single crystal is described in Ref. Qi10a and it crystallizes in a rhombohedral structure (point group ) with the lattice parameters Å and Å.Book Neighboring quintuple layers are bounded by weak van der Waals forces, allowing one to exfoliate Bi2Se3 thin layers from a larger crystal. Bi2Se3 single crystals of nominal thickness are highly reflective and impermeable to infrared light. For the magneto-infrared transmittance measurements, the ultrathin semi-transparent Bi2Se3 flakes are prepared by repeatedly exfoliating layers from a thin Bi2Se3 crystal laid on Scotch tape, until it becomes permeable to infrared radiation. This process results in a sample consisting of thousands of ultrathin flakes, and most of them exhibit a cross-sectional area of around m2.
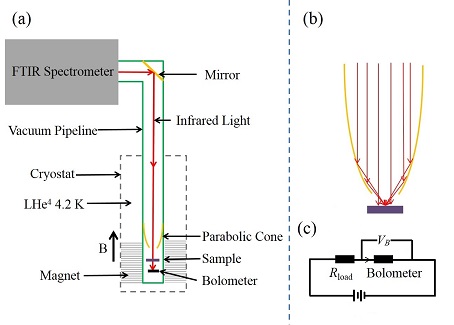
The Bi2Se3 flakes on Scotch tape are then placed in a liquid helium cryostat held at K and subject to an applied magnetic field parallel to the -axis up to T, i.e. in the Faraday geometry. Magneto-infrared transmittance spectra are measured by a Fourier transform infrared (FTIR) spectrometer using light pipe optics in the experimental setup shown in Fig. 1 (a). Here, the light from a broadband infrared light source (a Mercury lamp) is modulated by a Michelson interferometer to produce a light beam with its intensity modulated according to the difference in the lengths of the two optical arms (a FT-modulated beam).BookG Next, as shown in Fig. 1 (a), the FT-modulated beam is steered by mirrors and sent to a sample via a highly polished metallic pipe (a light pipe). At the end of the light pipe, a parabolic cone is used to focus the light onto a spot of several in diameter on the sample as shown in Fig. 1 (b). The intensity of the light transmitted through the sample is measured by a Si chip inside a cavity (a bolometer). The light intensity is measured by the minute change in the chip’s temperature caused by absorbing the energy of the FT-modulated beam. The minute temperature change results in a change of the chip’s resistance and thus the voltage drop across the two contacts on the Si chip as shown in Fig. 1 (c). The change of the voltage drop, which is proportional to the light intensity received at the bolometer, is then amplified and sent back to the FTIR spectrometer to be Fourier transformed in order to obtain the transmittance spectrum. Reflectance spectra are obtained using a similar configuration, though the light reflected from the sample is collected and measured by the bolometer.
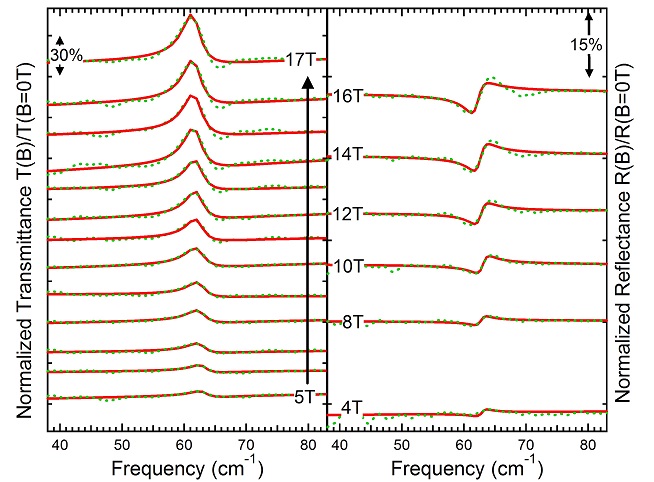
To extract the effect that is induced by an applied magnetic field, the measured spectra are normalized by the reference spectra measured at zero magnetic field. A set of normalized magneto-transmittance spectra is plotted in Fig. 2 (a). As one can clearly see, the applied magnetic field induces a noted change in the transmittance spectrum which invokes the lineshape of Fano resonance at around cm-1 (cmmeV). This frequency coincides with the phonon mode in Bi2Se3 and a weak absorption dip due to the infrared-active phonon mode can be seen in the transmittance spectrum at zero magnetic field. Figure 2 (a) shows the magneto-infrared transmittance spectra, normalized to zero field. As one can see, the presence of magnetic field induces a transfer of the optical oscillator strength from the phonon mode to the higher frequency side of the phonon mode, thus resulting in a rise of the normalized transmittance at the phonon frequency followed by a broad dip on the higher frequency side. The transfer of the optical oscillator strength increases with increasing magnetic field and the normalized magneto-reflectance spectra collaboratively confirms the same phenomenon as shown in Fig. 2 (b) with a dip at the phonon frequency (decrease in oscillator strength) followed by a rise on the higher frequency side (increase in oscillator strength) in the normalized reflectance spectra.
Generally speaking, a Fano resonance results from the quantum interference between two coupled transition pathways: one via a discrete excited state and the other via a continuum of states.Fan61 It is ubiquitous across several branches of physics and it results in an asymmetric scattering cross section due to the quantum interference between the wavefunctions of the two transition pathways. In this study, the discrete mode is the optical phonon mode in Book ; Ric77 , while the continuum of states is the transitions from the lower conduction band to the empty states in the upper conduction band. The two optical pathways are coupled via a strong electron-phonon coupling. It was also known that the optical phonon modes in Bi2Se3 and Bi2Te3 are stronger than expected in polar materialsRic77 , which can be a result of rather strong electron-phonon coupling.
The observed magnetic-field induced modification of the Fano effect is unusual for a non-magnetic system without undergoing through a phase transition.Laf10 The Fano resonance in Bi2Se3 is modified by the applied magnetic field via tuning the electronic transitions. Specifically, the strong electron-phonon coupling has been attributed to the magnetostriction in a system with large spin-orbit coupling and the topological magnetoelectric effect in TIs.Laf10 An applied magnetic field modifies the local electric field acting on Bi ions via the magnetoelectric effectQi08 ; Ess09 and thus changes the local lattice dynamics and the optical phonon mode.
The Fano resonance induced change in optical conductivity can then be written as , where .Fan61 ; Laf10 The square of the plasma frequency is proportional to the optical strength of the Fano mode, is the phonon energy, is the linewidth, and is the dimensionless Fano parameter which characterizes the resonance lineshape. When , the Fano effect results in an anti-resonance (enhanced transmittance), and it becomes a resonance (absorption) when . The sign of the Fano parameter describes the direction (toward the higher or the lower frequency side) of the optical strength transfer and its magnitude reflects the degree of the coupling between the discrete state and the continuum of the electronic states. The effect on the normalized transmittance/reflectance spectra can be described quantitatively as the following,
| (1) |
where stands for the amplitude of the Fano resonance in terms of the absorption rate normalized by the zero-field reference spectrum. The (red) solid lines in Fig. 2 show the best fits to the data using Eq. (1). Here, each pair of the normalized transmittance and reflectance spectra are fitted by the same set of parameters.
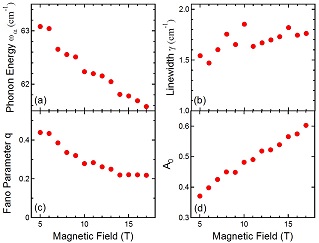
Figure 3 summarizes the fitting parameters obtained using Eq. (1) as a function of the magnetic field. First, as one can see, the phonon energy slightly decreases with increasing magnetic field. The phenomenon is different from that reported in Ref. Laf10 where the phonon energy is practically a constant. In addition, in Fig. 3(b), the linewidth stays roughly a constant with increasing magnetic field, whereas the earlier study in Ref. Laf10 reported a substantial broadening of the linewidth (two-fold increase from zero field to 8T). In both studies, the optical strength are transferred away from the optical phonon mode with increasing magnetic field. It is transferred to the higher frequency side with positive values in Fig. 3 (c), whereas the values are negative in Ref. Laf10 . The amplitude of the Fano resonance increases with increasing magnetic field, as shown in Fig. 3 (d).
To explain the lineshape discrepancies reported in TI systemsLaf10 ; But10 ; Ric77 ; Pie12 , we examine the possible origins of the observed Fano resonance. We note that the magnetic-field tunable Fano resonance around the optical phonon mode has been observed in several graphitic systems and it can be explained by the ”charged-phonon theory”.Ric92 ; Cap12 Specifically, depending on the relative energies of the optical phonon mode and the continuum of the electronic states, the optical phonon mode can ”borrow” the optical strength (charges) from the electronic states and vice versa. The Fano resonance observed in this work can be qualitatively explained if the continuum of the electronic transition is assigned to the transitions from the Fermi level in the lower conduction band to the empty states in the upper conduction band (see Ref. Kul99 for the band structure of Bi2Se3). When the Fermi level moves to lower energy, the energy of the continuous transitions shifts to higher energy. When the bottom of the continuum is much higher than the phonon energy, the lineshape remains Lorentzian (i.e. ) with enhanced optical strength borrowed from the electronic transitions, which explains why the Fano lineshape was not observed in low density (Fermi energy) samples.Ric77 ; But10 When the Fermi energy is sufficiently high, the continuum of transitions shifts to lower energy and the asymmetric Fano lineshape is observed.Laf10 ; Pie12 With increasing magnetic field, the diamagnetic shift of the Fermi level modifies the continuum of transitions toward lower energy, which enhances the optical strength transfer from the optical phonon mode to the electronic transitions, accompanied by smaller values. The linewidth and the direction of the transfer will depend on the density of states of the continuum, the imperfection of the lattice, and the type of the interaction (i.e., attractive or repulsive) between the optical phonon mode and the continuum. Positive values may indicate that the density of states is larger on the higher frequency side, and the negative values indicate the opposite. The linewidth is relatively large and insensitive to the applied magnetic field in this study, indicating that it is dominated by the lattice imperfection of the flakes; whereas the linewidth increases with increasing magnetic field in the earlier studyLaf10 , because it was carried out on a large single crystal.
Finally, we note that most of the recent magneto-optical studies on TIs focus on the dynamics of the charge carriers via either conductivity analysis and/or the cyclotron resonance spectroscopy.Laf10 ; But10 ; Pie12 ; Ste07 ; Sch12 ; Cha14 ; Orl15 Curiously, we did not observe any absorptions that can be attributed to the cyclotron resonance below cm-1 and the recently reported interband Landau level transitions reside in the frequency range of several thousands cm-1.Orl15
In summary, we studied the magnetic-field tunable Fano resonance occurred at the phonon mode of Bi2Se3 via magneto-infrared transmittance and reflectance spectroscopy. The observed Fano resonance can be attributed to the electron-phonon coupling between the optical phonon mode and the continuum of the electronic transitions from the Fermi level in the lower conduction band to the empty states in the upper conduction band. The behavior of this Fano resonance, as well as the discrepancies in previous studies, can be understood within the framework of the charged phonon theory. The origin of the strong electron-phonon coupling may be a result of the topological magnetoelectric effect, though further proofs are required.
Acknowledgements.
This work is supported by the ND-EPSCoR (EPS-0814442), by the University of North Dakota, and by the state of North Dakota. TI crystal synthesis at Purdue University is supported by the DARPA MESO program (Grant N66001-11-1-4107). The IR measurement is supported by the DOE (DE-FG02-07ER46451) and carried outw at the National High Magnetic Field Laboratory, which is supported by NSF Cooperative Agreement No. DMR-0654118, by the State of Florida, and by the DOE.References
- (1) A.F. Ioffe, Semiconductor Thermoelements and Thermoelectric Cooling (London: Infosearch 1957)
- (2) J. Black, E. M. Conwell, L. Seigle and C. W. Spencer, Journal of Physics and Chemistry of Solids 2 (3), 240-251 (1957).
- (3) H. Zhang, C.-X. Liu, X.-L. Qi, Xi Dai, Z. Fang and S.-C. Zhang, Nat. Phys. 5, 438 (2009)
- (4) Y. Xia, D. Qian, D. Hsieh, L. Wray, A. Pal, H. Lin, A. Bansil, D. Grauer, Y. S. Hor, R. J. Cava and M. Z. Hasan, Nat. Phys. 5, 398 (2009)
- (5) M. Z. Hasan, H. Lin and A. Bansil, Physics 2, 108 (2009)
- (6) J. E. Moore, “The Birth of Topological Insulators”, Nature 464, 194 (2010)
- (7) M.Z. Hasan and C. L. Kane, Rev. Mod. Phys. 82, 3045 (2010)
- (8) For recent reviews, see for example, M. Hasan and C. L. Kane, Rev. Mod. Phys. 82, 3045 (2010) and X. L. Qi and S. C. Zhang, Rev. Mod. Phys. 83, 1057 (2011).
- (9) K. J. Pluciski, W. Gruhn, I. V. Kityk, W. Imioek, H. Kaddouri and S. Benet, Optics Communications 204 (1-6), 355-361 (2002).
- (10) L. Fu and C. L. Kane, Physical Review Letters 100 (9), 096407 (2008).
- (11) S.K. Mishra, S. Satpathy, and O. Jepsen, J. Phys.: Condens. Matter 9, 461 (1997)
- (12) Xiao-Liang Qi, Taylor L. Hughes, and Shou-Cheng Zhang, Phys. Rev. B 78, 195424 (2008)
- (13) W-K. Tse and A. H. MacDonald, Phys. Rev. B 82, 161104 (2010)
- (14) U. Fano, Phys. Rev. 124, 1866 (1961)
- (15) A.D. LaForge, A. Frenzel, B. C. Pursley, T. Lin, X. Liu, J. Shi and D.N. Basov, Phys. Rev. B 81, 125120 (2010)
- (16) N.P. Butch, K. Kirshenbaum, P. Syers, A.B. Sushkov, G. S. Jenkins, H.D. Drew, and J. Paglione, Phys. Rev. B 81, 241301(R) (2010)
- (17) C. R. Richter, W. Kohler, and H. Becker, Phys. stat. sol. b 84, 619 (1977)
- (18) P.Di Pietro, F.M. Vitucci, D. Nicoletti, L. Baldassarre, P. Calvani, R. Cava, Y.S. Hor, U. Schade, and S. Lupi, Phys. Rev. B 86, 045439 (2012)
- (19) M.J. Rice and H.-Y Choi, Phys. Rev. B 45, 10173 (1992)
- (20) E. Cappelluti, L. Benfatto, M. Manzardo and A.B. Kuzemenko, Phys. Rev. B 86, 115439 (2012)
- (21) J. Qi, X. Chen, W. Yu, P. Cadden-Zimansky, D. Smirnov, N.H. Tolk, I. Miotkowski, H. Cao, Y.P. Chen, Y. Wu, S. Qiao, Z. Jiang, Appl. Phys. Lett. 97, 182102 (2010)
- (22) ”Bismuth telluride (Bi2Te3) effective masses”, Non-Terrahedrally Bonded Elements and Binary Compounds I” of the series Landolt-Bornstein-Group III Condendensed Matter Volume 41C by Springer Berlin Heidelberg (1998)
- (23) Peter R. Griffiths and James a. de Haseth, ”Fourier Transform Infrared spectrometry” published by Johnley Wiley& Son, Inc. (1986)
- (24) Xiao-Liang Qi, T.L. Hughes, and Shou-Cheng Zhang, Phys. Rev. B 78, 195424 (2008)
- (25) A.M. Essin, J.E. Moore, and D. Vanderbilt, Phys. Rev. Lett. 102, 146805 (2009)
- (26) V.A. Kulbachinskii, N. Miura, H. Arimoto, T. Ikaida, P. Lostak, and C. Drasar, J. Phys. Jpn. 68, 3328 (1999)
- (27) N.P. Stepanov, S.A. Nemov, M.K. Zhitinskaya, and T.E. Svechinikova, Semiconductor 41, 786 (2007)
- (28) A.A. Schafgans, K.W. Post, A.A. Taskin, Y. Ando, X.-L. Qi, B.C. Chapler, and D.N. Basov, Phys. Rev. B 85, 195440 (2012)
- (29) B.C. Chapler, K.W. Post, A. R. Richardella, J.S. Lee, J. Tao, N. Samarth, and D.N. Basov, arXiv:1405.4916v1 [cond-mat.mtrl-sci] (2014)
- (30) M. Orlita, B.A. Piot, G. Martinez, N.K. Sampath Kumar, C. Faugeras, M. Potemski, C. michael, E. M. Hankiewicz, T. Brauner, C. Drasar, S. Schreyeck, S. Grauer, K. Brunner, C. Gould, C. Brune, and L. W. Molenkamp, Phys. Rev. Lett. 114, 186401 (2015)