Measurement of ISR-FSR interference in the processes and
J. P. Lees
V. Poireau
V. Tisserand
Laboratoire d’Annecy-le-Vieux de Physique des Particules (LAPP), Université de Savoie, CNRS/IN2P3, F-74941 Annecy-Le-Vieux, France
E. Grauges
Universitat de Barcelona, Facultat de Fisica, Departament ECM, E-08028 Barcelona, Spain
A. PalanoabINFN Sezione di Baria; Dipartimento di Fisica, Università di Barib, I-70126 Bari, Italy
G. Eigen
B. Stugu
University of Bergen, Institute of Physics, N-5007 Bergen, Norway
D. N. Brown
L. T. Kerth
Yu. G. Kolomensky
M. J. Lee
G. Lynch
Lawrence Berkeley National Laboratory and University of California, Berkeley, California 94720, USA
H. Koch
T. Schroeder
Ruhr Universität Bochum, Institut für Experimentalphysik 1, D-44780 Bochum, Germany
C. Hearty
T. S. Mattison
J. A. McKenna
R. Y. So
University of British Columbia, Vancouver, British Columbia, Canada V6T 1Z1
A. Khan
Brunel University, Uxbridge, Middlesex UB8 3PH, United Kingdom
V. E. BlinovabcA. R. BuzykaevaV. P. DruzhininabV. B. GolubevabE. A. KravchenkoabA. P. OnuchinabcS. I. SerednyakovabYu. I. SkovpenabE. P. SolodovabK. Yu. TodyshevabBudker Institute of Nuclear Physics SB RAS, Novosibirsk 630090a, Novosibirsk State University, Novosibirsk 630090b, Novosibirsk State Technical University, Novosibirsk 630092c, Russia
A. J. Lankford
University of California at Irvine, Irvine, California 92697, USA
B. Dey
J. W. Gary
O. Long
University of California at Riverside, Riverside, California 92521, USA
M. Franco Sevilla
T. M. Hong
D. Kovalskyi
J. D. Richman
C. A. West
University of California at Santa Barbara, Santa Barbara, California 93106, USA
A. M. Eisner
W. S. Lockman
W. Panduro Vazquez
B. A. Schumm
A. Seiden
University of California at Santa Cruz, Institute for Particle Physics, Santa Cruz, California 95064, USA
D. S. Chao
C. H. Cheng
B. Echenard
K. T. Flood
D. G. Hitlin
J. Kim
T. S. Miyashita
P. Ongmongkolkul
F. C. Porter
M. Röhrken
California Institute of Technology, Pasadena, California 91125, USA
R. Andreassen
Z. Huard
B. T. Meadows
B. G. Pushpawela
M. D. Sokoloff
L. Sun
University of Cincinnati, Cincinnati, Ohio 45221, USA
W. T. Ford
J. G. Smith
S. R. Wagner
University of Colorado, Boulder, Colorado 80309, USA
R. Ayad
Now at: University of Tabuk, Tabuk 71491, Saudi Arabia
W. H. Toki
Colorado State University, Fort Collins, Colorado 80523, USA
B. Spaan
Technische Universität Dortmund, Fakultät Physik, D-44221 Dortmund, Germany
D. Bernard
M. Verderi
Laboratoire Leprince-Ringuet, Ecole Polytechnique, CNRS/IN2P3, F-91128 Palaiseau, France
S. Playfer
University of Edinburgh, Edinburgh EH9 3JZ, United Kingdom
D. BettoniaC. BozziaR. CalabreseabG. CibinettoabE. FioravantiabI. GarziaabE. LuppiabL. PiemonteseaV. SantoroaINFN Sezione di Ferraraa; Dipartimento di Fisica e Scienze della Terra, Università di Ferrarab, I-44122 Ferrara, Italy
A. Calcaterra
R. de Sangro
G. Finocchiaro
S. Martellotti
P. Patteri
I. M. Peruzzi
M. Piccolo
A. Zallo
INFN Laboratori Nazionali di Frascati, I-00044 Frascati, Italy
R. ContriabM. R. MongeabS. PassaggioaC. PatrignaniabINFN Sezione di Genovaa; Dipartimento di Fisica, Università di Genovab, I-16146 Genova, Italy
B. Bhuyan
V. Prasad
Indian Institute of Technology Guwahati, Guwahati, Assam, 781 039, India
A. Adametz
U. Uwer
Universität Heidelberg, Physikalisches Institut, D-69120 Heidelberg, Germany
H. M. Lacker
Humboldt-Universität zu Berlin, Institut für Physik, D-12489 Berlin, Germany
U. Mallik
University of Iowa, Iowa City, Iowa 52242, USA
C. Chen
J. Cochran
S. Prell
Iowa State University, Ames, Iowa 50011-3160, USA
H. Ahmed
Physics Department, Jazan University, Jazan 22822, Kingdom of Saudi Arabia
A. V. Gritsan
Johns Hopkins University, Baltimore, Maryland 21218, USA
N. Arnaud
M. Davier
D. Derkach
G. Grosdidier
F. Le Diberder
A. M. Lutz
B. Malaescu
Now at: Laboratoire de Physique Nucléaire et de Hautes Energies, IN2P3/CNRS, F-75252 Paris, France
P. Roudeau
A. Stocchi
L. L. Wang
Now at: Institute of High Energy Physics, Beijing 100039, China
G. Wormser
Laboratoire de l’Accélérateur Linéaire, IN2P3/CNRS et Université Paris-Sud 11, Centre Scientifique d’Orsay, F-91898 Orsay Cedex, France
D. J. Lange
D. M. Wright
Lawrence Livermore National Laboratory, Livermore, California 94550, USA
J. P. Coleman
J. R. Fry
E. Gabathuler
D. E. Hutchcroft
D. J. Payne
C. Touramanis
University of Liverpool, Liverpool L69 7ZE, United Kingdom
A. J. Bevan
F. Di Lodovico
R. Sacco
Queen Mary, University of London, London, E1 4NS, United Kingdom
G. Cowan
University of London, Royal Holloway and Bedford New College, Egham, Surrey TW20 0EX, United Kingdom
D. N. Brown
C. L. Davis
University of Louisville, Louisville, Kentucky 40292, USA
A. G. Denig
M. Fritsch
W. Gradl
K. Griessinger
A. Hafner
K. R. Schubert
Johannes Gutenberg-Universität Mainz, Institut für Kernphysik, D-55099 Mainz, Germany
R. J. Barlow
Now at: University of Huddersfield, Huddersfield HD1 3DH, UK
G. D. Lafferty
University of Manchester, Manchester M13 9PL, United Kingdom
R. Cenci
B. Hamilton
A. Jawahery
D. A. Roberts
University of Maryland, College Park, Maryland 20742, USA
R. Cowan
Massachusetts Institute of Technology, Laboratory for Nuclear Science, Cambridge, Massachusetts 02139, USA
R. Cheaib
P. M. Patel
S. H. Robertson
McGill University, Montréal, Québec, Canada H3A 2T8
N. NeriaF. PalomboabINFN Sezione di Milanoa; Dipartimento di Fisica, Università di Milanob, I-20133 Milano, Italy
L. Cremaldi
R. Godang
Now at: University of South Alabama, Mobile, Alabama 36688, USA
D. J. Summers
University of Mississippi, University, Mississippi 38677, USA
M. Simard
P. Taras
Université de Montréal, Physique des Particules, Montréal, Québec, Canada H3C 3J7
G. De NardoabG. OnoratoabC. SciaccaabINFN Sezione di Napolia; Dipartimento di Scienze Fisiche, Università di Napoli Federico IIb, I-80126 Napoli, Italy
G. Raven
NIKHEF, National Institute for Nuclear Physics and High Energy Physics, NL-1009 DB Amsterdam, The Netherlands
C. P. Jessop
J. M. LoSecco
University of Notre Dame, Notre Dame, Indiana 46556, USA
K. Honscheid
R. Kass
Ohio State University, Columbus, Ohio 43210, USA
M. MargoniabM. MorandinaM. PosoccoaM. RotondoaG. SimiabF. SimonettoabR. StroiliabINFN Sezione di Padovaa; Dipartimento di Fisica, Università di Padovab, I-35131 Padova, Italy
S. Akar
E. Ben-Haim
M. Bomben
G. R. Bonneaud
H. Briand
G. Calderini
J. Chauveau
Ph. Leruste
G. Marchiori
J. Ocariz
Laboratoire de Physique Nucléaire et de Hautes Energies, IN2P3/CNRS, Université Pierre et Marie Curie-Paris6, Université Denis Diderot-Paris7, F-75252 Paris, France
M. BiasiniabE. ManoniaA. RossiaINFN Sezione di Perugiaa; Dipartimento di Fisica, Università di Perugiab, I-06123 Perugia, Italy
C. AngeliniabG. BatignaniabS. BettariniabM. CarpinelliabAlso at: Università di Sassari, I-07100 Sassari, Italy
G. CasarosaabM. ChrzaszczaF. FortiabM. A. GiorgiabA. LusianiacB. OberhofabE. PaoloniabM. RamaaG. RizzoabJ. J. WalshaINFN Sezione di Pisaa; Dipartimento di Fisica, Università di Pisab; Scuola Normale Superiore di Pisac, I-56127 Pisa, Italy
D. Lopes Pegna
J. Olsen
A. J. S. Smith
Princeton University, Princeton, New Jersey 08544, USA
F. AnulliaR. FacciniabF. FerrarottoaF. FerroniabM. GasperoabA. PilloniabG. PireddaaINFN Sezione di Romaa; Dipartimento di Fisica, Università di Roma La Sapienzab, I-00185 Roma, Italy
C. Bünger
S. Dittrich
O. Grünberg
M. Hess
T. Leddig
C. Voß
R. Waldi
Universität Rostock, D-18051 Rostock, Germany
T. Adye
E. O. Olaiya
F. F. Wilson
Rutherford Appleton Laboratory, Chilton, Didcot, Oxon, OX11 0QX, United Kingdom
S. Emery
G. Vasseur
CEA, Irfu, SPP, Centre de Saclay, F-91191 Gif-sur-Yvette, France
D. Aston
D. J. Bard
C. Cartaro
M. R. Convery
J. Dorfan
G. P. Dubois-Felsmann
W. Dunwoodie
M. Ebert
R. C. Field
B. G. Fulsom
M. T. Graham
C. Hast
W. R. Innes
P. Kim
D. W. G. S. Leith
S. Luitz
V. Luth
D. B. MacFarlane
D. R. Muller
H. Neal
T. Pulliam
B. N. Ratcliff
A. Roodman
R. H. Schindler
A. Snyder
D. Su
M. K. Sullivan
J. Va’vra
W. J. Wisniewski
H. W. Wulsin
SLAC National Accelerator Laboratory, Stanford, California 94309 USA
M. V. Purohit
J. R. Wilson
University of South Carolina, Columbia, South Carolina 29208, USA
A. Randle-Conde
S. J. Sekula
Southern Methodist University, Dallas, Texas 75275, USA
M. Bellis
P. R. Burchat
E. M. T. Puccio
Stanford University, Stanford, California 94305-4060, USA
M. S. Alam
J. A. Ernst
State University of New York, Albany, New York 12222, USA
R. Gorodeisky
N. Guttman
D. R. Peimer
A. Soffer
Tel Aviv University, School of Physics and Astronomy, Tel Aviv, 69978, Israel
S. M. Spanier
University of Tennessee, Knoxville, Tennessee 37996, USA
J. L. Ritchie
R. F. Schwitters
University of Texas at Austin, Austin, Texas 78712, USA
J. M. Izen
X. C. Lou
University of Texas at Dallas, Richardson, Texas 75083, USA
F. BianchiabF. De MoriabA. FilippiaD. GambaabINFN Sezione di Torinoa; Dipartimento di Fisica, Università di Torinob, I-10125 Torino, Italy
L. LanceriabL. VitaleabINFN Sezione di Triestea; Dipartimento di Fisica, Università di Triesteb, I-34127 Trieste, Italy
F. Martinez-Vidal
A. Oyanguren
IFIC, Universitat de Valencia-CSIC, E-46071 Valencia, Spain
J. Albert
Sw. Banerjee
A. Beaulieu
F. U. Bernlochner
H. H. F. Choi
G. J. King
R. Kowalewski
M. J. Lewczuk
T. Lueck
I. M. Nugent
J. M. Roney
R. J. Sobie
N. Tasneem
University of Victoria, Victoria, British Columbia, Canada V8W 3P6
T. J. Gershon
P. F. Harrison
T. E. Latham
Department of Physics, University of Warwick, Coventry CV4 7AL, United Kingdom
H. R. Band
S. Dasu
Y. Pan
R. Prepost
S. L. Wu
University of Wisconsin, Madison, Wisconsin 53706, USA
Abstract
Charge asymmetry in processes and is
measured
using of data collected with the BABAR detector at
center-of-mass energies near . An observable is introduced
and shown to be very robust against detector asymmetries while keeping a
large sensitivity to the physical charge asymmetry that results from the interference
between initial and final state radiation. The asymmetry is determined as a
function of the invariant mass of the final-state tracks from production threshold to
a few . It is
compared to the expectation from QED for , and from theoretical
models for .
A clear interference pattern is observed in , particularly
in the vicinity of the resonance. The inferred
rate of lowest order FSR production is consistent with the QED expectation for
, and is negligibly small for .
pacs:
13.40Em, 13.60.Hb, 13.66.Bc, 13.66.Jn
I Introduction
The radiative processes
(1)
have been extensively studied by several
experiments and the cross sections for have been
measured using the initial state radiation (ISR)
method isr1 ; isr2 ; isr3 ; isr4 . At BABARbabarISR , the
cross sections have thus been determined in large energy ranges below the
total center-of-mass (c.m.) energy
available at the SLAC PEP-II collider. The state can be either
fully described by Quantum Electrodynamics (QED) such as , or any hadronic state
with .
In reaction (1) at lowest order (LO) the photon can be emitted
from either the incoming electron or positron, or from the final state
(final state radiation, or FSR). At BABAR, the kinematic conditions are such that the
process is dominated by ISR photons, which justifies the ISR
method. The LO FSR contribution to the hadronic radiative process is
neglected, as its theoretical estimates are well below the systematic
uncertainties of the cross section measurement. This is due to the fact that
the available c.m. energy is
far beyond the domain of the hadronic resonances that dominate the
cross-section, so that hadronic form factors considerably reduce the probability
that the photon is emitted from the final state. However, the theoretical
estimations are model-dependent, and it is thus important to have a direct
experimental proof of the smallness of the FSR contribution to the hadronic
cross sections when high precision is at stake, as for the determination of
the hadronic contribution to the value of the muon prd-pipi . Because of the
point-like nature of the muon, the FSR reduction does not occur for the
process. The LO FSR contribution to the cross section is expected
to vanish at threshold and to increase with the invariant mass of the muon pair
(). Still, the FSR fraction remains small for low di-muon mass
(less than 1% for ). For the cross section measurement, a
correction is applied for the LO FSR contribution as a function
of , which is so far determined by turning off FSR in the Monte Carlo (MC)
generation.
While it is not possible to distinguish ISR from FSR photons on an
event-by-event basis, as the corresponding amplitudes are both present and
interfere, a measurement of the interference provides a sensitive and
quantitative determination of their relative strength.
Measurement of the forward-backward asymmetry of the pions was first proposed
in Ref. isr3 , as a test of the underlying model for final state radiation.
In this paper, the
ISR-FSR interference for and is studied through
the charge asymmetry of the production of these events at various decay plane
angles. The comparison between the QED prediction and the measurement is done
for the charge asymmetry in .
Various FSR models are discussed
for , and the most realistic quark-FSR model is compared to the
measurement of the charge asymmetry in that channel.
This paper reports the first measurement of charge asymmetry in the
process. For , a preliminary measurement KLOE
of the forward-backward asymmetry has been reported
at low energies (). No previous result exists at high energies.
II ISR-FSR interference and charge asymmetry
II.1 Charge asymmetry
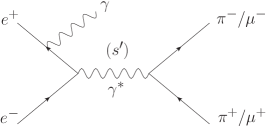
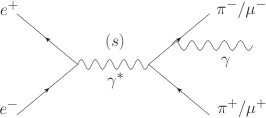
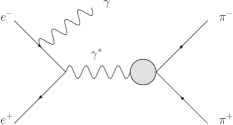
Figure 1: Feynman diagrams for (, ), where the photon is
from lowest order initial state radiation (LO ISR, left) or lowest order final
state radiation (LO FSR, right).
The Feynman diagrams for the LO ISR and LO FSR emission in the process
(where or ), are illustrated in
Fig. 1. The total LO amplitude is
the sum of the corresponding amplitudes and
, and the cross section for is
If the photon is emitted from the initial (final) state, the pair is
produced with charge parity , which implies that the interference term
changes sign if one interchanges and . While the contribution of
the interference term to the total cross section vanishes when one integrates
over the kinematic variables of the final state, that term induces a
significant observable charge asymmetry in the differential cross section.
Charge asymmetry is defined as
(3)
where means that and
are interchanged.
Although it is not possible to reconstruct or
from the charge asymmetry and the cross section, as the
relative phase between them remains unknown, information on the
ratio can be
derived within the framework of specific models.
II.2 Choice of kinematic variables
Aside from an overall azimuthal rotation about the beam axis, the kinematic
topology of the final state (where or ) is described by
four variables, which are the muon-pair (pion-pair) invariant mass (or
equivalently , the energy of the radiated photon in the
c.m.) and three angular variables. At a given mass, the
distribution of the three angular variables contains all the available information
on the ISR/FSR amplitudes.
At variance with the definition of forward-backward asymmetry used in Ref. czyz ,
which refers to the polar angle of with respect to the incoming electron
in the c.m. system (c.m.s.),
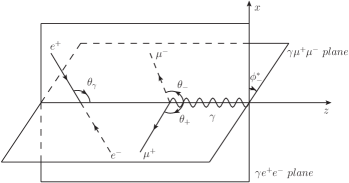
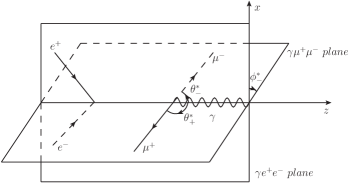
this analysis introduces the set of angular variables illustrated in
Fig. 2. These are found to be more sensitive
observables to measure the ISR-FSR interference:
•
— polar angle of the radiated photon in the
c.m.s. (with respect to the axis),
•
— polar angle of with respect to the photon axis in the
c.m.s.,
•
— azimuthal angle of with respect to the plane
in the c.m.s. (or the c.m.s.)
Figure 2: Definition of the angular variables describing the
kinematic topology of the final states of the process
at a given invariant mass: (left) in the
c.m.s., (right) in the c.m.s.
Since interchange means reversal of the direction to
its opposite in the c.m.s. system,
the charge asymmetry, for fixed and , is equal to
(4)
Figure 3: Charge asymmetry at generator level in simulation,
as a function of and for the
same interval () and various
ranges:
(left) ,
(middle) ,
(right)
For the process, the charge asymmetry as a function of
and , studied with the AfkQed generator (see Sec. IV.2), is shown in
Fig. 3.
The FSR amplitude is dominant at , when one of
the charged-particle tracks is very close to the radiated
photon. However, Fig. 3
shows that is a more sensitive variable to measure the
ISR/FSR content over the full phase space, with sign reversal of the
charge asymmetry. After
integration over and integration over
symmetrical intervals, the distribution of the
integrated charge asymmetry suggests a simple linear
dependence
(5)
From the expressions of the differential cross section detailed in the next section,
it results that the slope is an estimator of the ISR-FSR
interference, sensitive to the ratio in each
interval. Moreover, it will be shown in Sec. V
that the measurement of is barely affected by detector charge asymmetries.
III Theoretical predictions for the charge asymmetry
III.1 QED prediction for the process
In the massless limit GW , the differential cross section of the QED
process, written as a function of the four
kinematic variables defined above (Sec. II.2), implies that the differential
charge asymmetry is proportional to :
(6)
When the masses are taken into account, the effect from the
electron/positron mass is found to be negligible for radiated photons away from the
beams. The effect from the muon mass is sizeable, especially at large
when the radiated photon is close to one of the muons.
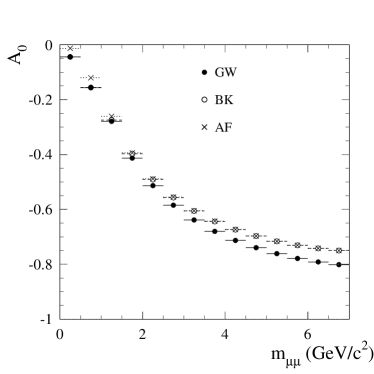
Predictions for the charge asymmetry in the massive case are obtained by
numerical integration of several variants of the QED differential cross section
GW ; BK ; AF . The phase space considered in those calculations is limited to
the experimental acceptance , and the results
are shown in Fig. 4 as a function of . Predictions
differ at the physical threshold (), where only the charge asymmetry
based on Ref. AF extrapolates to
zero as expected, suggesting that the validity of formulae in Ref. GW ; BK
does not extend to small . At large mass (), the
prediction from Ref. GW differs from the others by up to a few percent. The
formula of the differential LO cross section implemented in the AfkQed
generator, which is used in this analysis for simulation (see Sec. IV.2), is the one
by Arbuzov et al.AF , which has the most reliable behavior over
the full range.
Figure 4: (left) Charge asymmetry at , , as a function of
, obtained by numerical integration according to three
different theoretical predictions (see text), with the condition
applied. (right) The difference between the
prediction and the AfkQed LO value. Results labeled GW, BK, AF are obtained from
references GW ,BK ,AF , respectively.
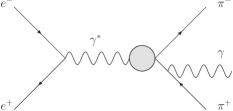
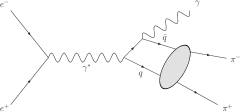
III.2 FSR models for the process
(a)Initial state radiation
(b)Final state radiation with pions treated as point-like particles
(FSR model 1)
(c)Final state radiation at quark level
(FSR model 2)
Figure 5: Feynman diagrams for .
As in the process, ISR and FSR contribute to
(Fig. 5). However, the charge
asymmetry is expected to be much smaller in the latter process because the
FSR contribution is strongly reduced by the pion form factor at large
. In addition, its estimate is model-dependent.
III.2.1 FSR from point-like pions (model 1)
In the FSR model shown in Fig. 5(b), the photon is emitted
from one of the final state pions, where the pion is treated as a point-like
particle. In this hypothesis, the FSR amplitude is
proportional to the pion form factor at the collision energy squared , namely
. The ISR amplitude shown in
Fig. 5(a) is proportional to the pion form factor
at a reduced energy squared .
According to this FSR model, the charge asymmetry to be measured at BABAR
reflects the relative magnitude of the pion form factor at
and at low energy. It is consequently negligibly small, since
, dominated by the resonance in the domain
accessible to the experiment, is three orders of magnitude larger than
, as estimated from an extrapolation of
existing data cleo-ff ; prd-pipi using a dependence.
This model is studied with the PHOKHARA 4.0 phok generator, in which
the FSR current has a point-like Lorentz structure, including a contact term,
globally multiplied by the pion form factor.
In this model, the distribution is
expected to increase quadratically with mass on the resonance,
with a change of sign at the mass
(7)
with values well below the sensitivity of this analysis because of the large
pion form factor suppression at .
III.2.2 FSR from quarks (model 2)
In the a priori more realistic FSR model for depicted in
Fig. 5(c),
the FSR photon is emitted from the quarks,
which subsequently hadronize into a pion pair piInt . The
dominant ISR and FSR contributions, and their interference, are written in terms
of the variables defined in Sec. II.2:
(8)
where and are the QED fine structure constant and the pion velocity
, respectively.
The FSR contribution is
(9)
and the interference term
(10)
where
(11)
and is the C-even part of the 2-pion generalized
distribution amplitudes (GDA). The pion time-like form factor
is taken from a fit to BABAR data prd-pipi with
a vector dominance model.
So far, there is no implementation of this model in an MC generator to describe the ISR-FSR
interference in the process. In order to predict the charge
asymmetry numerically, we take the following GDA model, which is a modified
version of the model found in Ref. piDGP :
(12)
where and are the magnitudes of the S-wave and D-wave contributions,
respectively. As the scalar
sector is known to involve wide resonances, the S-wave contribution is approximated
by a constant amplitude with a
mass-dependent phase taken from pion-pion phase-shift
analyses deltapipi in the region below . This model
incorporates the rapid phase variation across the resonance.
Using piDGP yields an value of about near the
resonance and nearly flat with mass.
For the D-wave tensor contribution, we use a Breit-Wigner
form (BW) for the resonance in order to take properly into account the mass
dependence of the amplitude, the phase variation being given by the
BW form in agreement with the measured
values deltapipi . The angular dependence in the
center-of-mass is given by the Legendre polynomial , which
assumes the dominance of helicity 0 for production.
III.3 Other sources of charge asymmetry
Next-to-leading order (NLO) corrections including additional photons (soft and
hard) and loops are expected to affect the lowest-order (LO) predictions for
the charge asymmetry. For the process these corrections
have been computed recently NLO-muons and implemented in the
PHOKHARA 9.0 generator phok-2013 . As discussed in
Sec. VI.3, the effects are found to be small, at the percent
level for the experimental conditions of the present analysis, and to be
well accounted for by the simpler structure function approach implemented
in AfkQed.
No exact NLO calculation is available for the process.
In this case, since the LO charge asymmetry is expected to be small because
the FSR amplitude is suppressed, NLO corrections could play a
relatively more important role. The soft and virtual photon
contributions to the Born process are
known brown-mikaelian ; arbuzov-pipi to generate an asymmetry of the
pion production, with asymmetry values at the percent level at a mass of .
However, it is unclear if the above result can be used in the conditions of the
present process , where one of the incoming
electrons is highly off-shell after emission of a hard ISR photon. Furthermore,
such an asymmetry would vanish because of the symmetrical integration in .
NLO corrections as implemented in AfkQed have indeed no effect on the charge asymmetry.
No correction on the measured charge asymmetry is therefore applied for
the process.
Another potential source of charge asymmetry comes from
exchange. This contribution is strongly suppressed by the
propagator, especially for the ISR diagrams where . Therefore one expects this effect to be negligible for
. The contribution is larger for the FSR
diagrams for since here the relevant
ratio is . The contribution of exchange is studied with the
KKMC generator kk2f . As reported in Sec. VI.3, the
effect is at the level of a few per mille.
IV Experimental analysis
IV.1 The BABAR detector and data samples
The analysis is based on of data babar-lumi collected with the BABAR
detector at the SLAC National Accelerator Laboratory at the PEP-II
asymmetric-energy collider operated at the resonance. About 10%
of the data was collected 40 below the resonance. The
BABAR detector is described in detail elsewhere detector .
Charged-particle tracks are measured with a five-layer double-sided silicon
vertex tracker (SVT) together with a 40-layer drift chamber (DCH), both inside a
1.5 T superconducting solenoid. Photons are assumed to originate from the
primary vertex defined by the charged-particle tracks of the event, and their energy and
position are measured in a CsI(Tl) electromagnetic calorimeter (EMC).
Charged-particle identification (PID) uses the ionization energy loss in
the SVT and DCH, the Cherenkov radiation detected in a ring-imaging device
(DIRC), the shower energy deposit () in the EMC, and the shower shape
in the instrumented flux return (IFR) of the magnet. The IFR system is made of
modules of resistive plate chambers (RPC) interspaced with iron slabs, arranged
in a layout with a barrel and two endcaps. Collision events are recorded and
reconstructed if they pass three levels of trigger (hardware, online
software, and offline filter), each using complementary information
from the sub-detectors.
IV.2 Monte Carlo generators and simulation
Signal and background processes are simulated with the
AfkQed event generator, which is based on QED for
and Ref. eva for hadronic production. LO ISR and FSR
emission is simulated for , while LO FSR is neglected for
hadronic processes. The main photon (hereafter called ‘ISR’ photon) is emitted within
the angular range in the
c.m. system, bracketing the photon detection range with a margin for resolution .
Additional ISR photons are generated with the structure function
method struct-fct , and additional FSR photons with the PHOTOSphotos program. Additional ISR photons are emitted along the
or beam particle direction. A minimum mass is imposed at generation, which puts an upper bound on the
additional ISR photon energy. Samples corresponding to 5 to 10 times the data
are generated for the signal and channels,
as well as large samples of backgrounds from the other two-prong and
multi-hadron ISR processes.
Background processes () are generated with the
JETSETjetset generator, and with the
KORALBkoralb program. The response of the BABAR detector is
simulated using the GEANT4 geant package.
IV.3 Event selection
Event selection follows the same procedure as the selection of
two-charged particle ISR events used for cross section
measurements prd-pipi . It requires a photon with energy
in the c.m. and laboratory polar angle with respect
to the beam in the range [0.35–2.4], and exactly two tracks of
opposite charge, each with momentum and within the angular range
[0.40–2.45]. If more than one photon is detected, the candidate with the
highest is taken
to be the ‘ISR’ photon. To ensure a rough momentum
balance at an early stage of the selection, the ‘ISR’ photon is required to lie
within of the missing momentum of the charged particles (or of the
tracks plus the other photons). The tracks are required to have at least 15
hits in the DCH, to originate within of the collision axis and within
from the beam spot along
the beam direction, and to extrapolate to the DIRC and IFR
active areas in order to exclude low-efficiency regions. Both tracks are
required to be identified either as muons or as pions. To suppress the
background to at threshold due to the process
followed by a photon conversion and misidentification of both electrons as
pions, it is further required that the distance in transverse plane
between the vertex of the two tracks and the beam collision point be less than
0.5 for . Electron background to is negligible
over the full mass range.
In order to suppress multi-hadron ISR events and reduce higher order radiative
processes, the selected two-prong candidates are subjected to a one-constraint
kinematic fit to the hypothesis (), in which only the
two good charged-particle tracks are taken as input and the corresponding missing mass is
constrained to the null photon mass. The value of the kinematic fit is
required to be less than 15.
IV.4 Charge asymmetry calculation
For a complete topology of the final states, the azimuth defined in
Sec. II.2 should cover the
range. However, the event sample with azimuth is
complementary to the sample with azimuth , since
in every event. This allows to
restrict to the range with no loss of phase space.
After integrating over
and , the total event sample in a fixed
interval subdivides into two subsamples: one with
(), the other with ().
We obtain separately the distributions in of the samples
in data, namely with and
with .
Distributions of background events are determined
separately for each subsample, as described below. Likewise, efficiencies are split
into
and computed using the full simulation of ()
events, with corrections for the differences between data and simulation (see
Sec. VI.3 and VII.3).
In a given () interval, the asymmetry at a given
is derived from the difference between the and yields,
corrected for efficiency, and is obtained from the following expression
(13)
where .
Note that distributions of
can be obtained in each cell of the phase space,
and the asymmetry defined by Eq. (13) can be
calculated. However, this one-dimensional quantity
is a valid definition of charge asymmetry only when the variable
is integrated within a symmetric range. This is a consequence of
the fact that the interchange means both
and ,
and therefore a non-null value of in an arbitrary
interval is not an intrinsic signature of ISR-FSR interference.
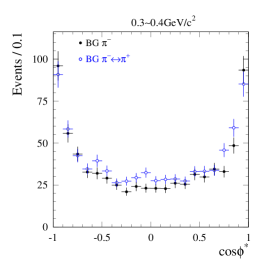
IV.5 Event samples and backgrounds after selection
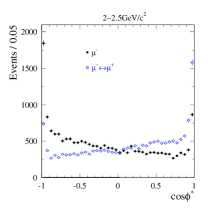
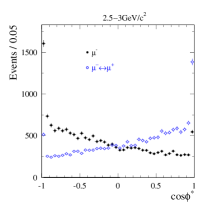
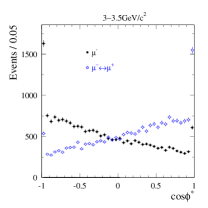
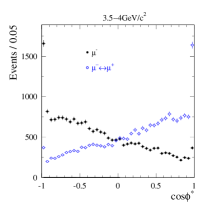
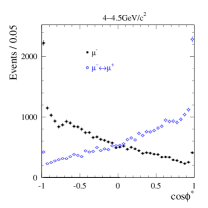
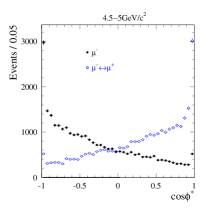
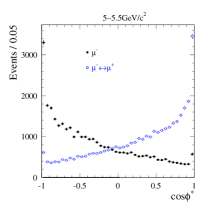
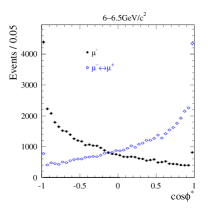
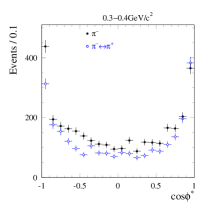
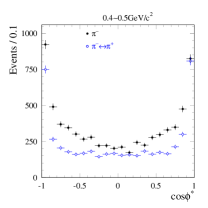
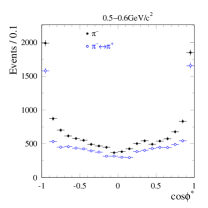
The distributions for
obtained in data after the overall event selection are shown in
Fig. 6, for mass intervals ranging from threshold
to . The event distributions obtained for
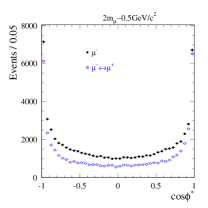
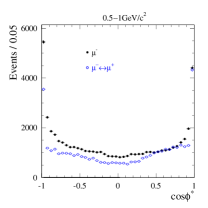
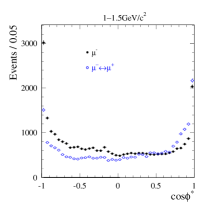
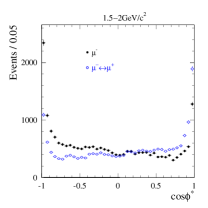
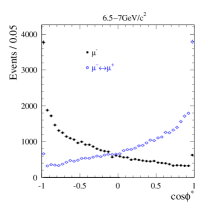
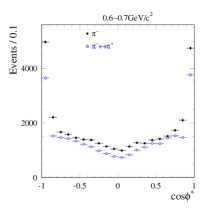
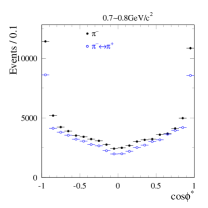
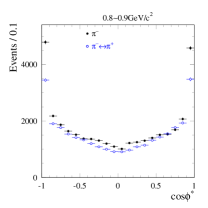
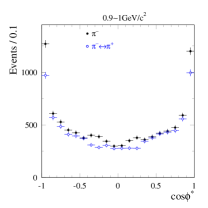
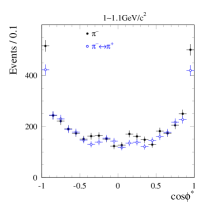
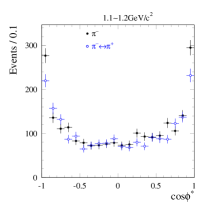
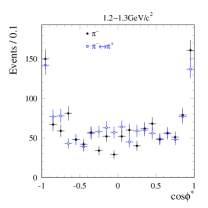
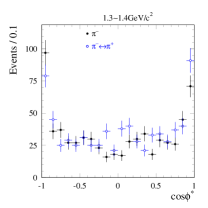
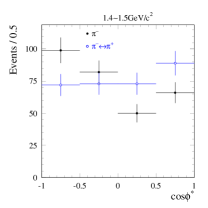
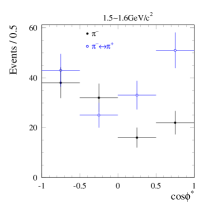
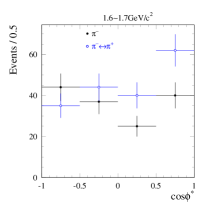
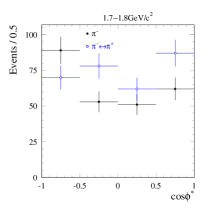
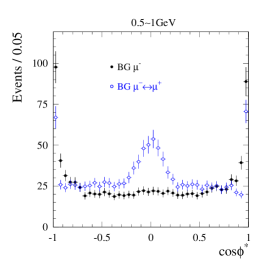
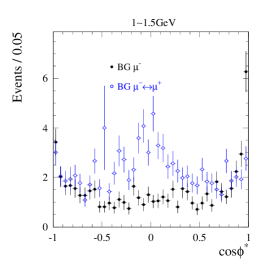
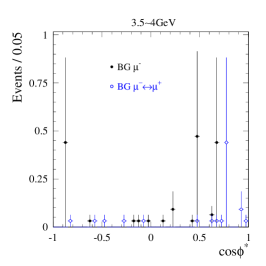
in data are shown in Fig. 7, in
mass intervals ranging from to .
Figure 6: The distributions for data in
intervals. The points labeled ‘’
refer to the configurations with , while the points
labeled ‘’ correspond to .
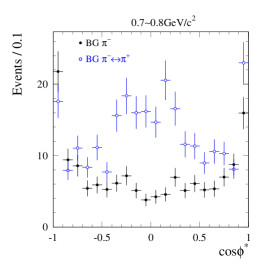
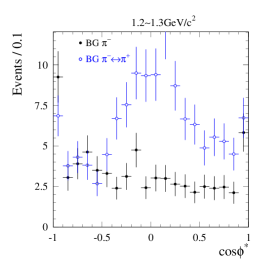
Figure 7: The distributions for data in
intervals. The points labeled ‘’
refer to the configurations with , while the points
labeled ‘’ correspond to .
The backgrounds remaining after selection are estimated using the full
simulation, normalized to the data luminosity, of the non-signal two-prong ISR
events, multi-hadron events produced through ISR, events,
and events. The expected contamination for as a
function of in typical intervals is shown in
Fig. 8, where the total error is the quadratic sum of the
statistical error and 10% systematic uncertainty on normalization prd-pipi .
Likewise, the estimated backgrounds for in typical intervals are shown
in Fig. 9.
Figure 8: Backgrounds estimated with MC for as a function of
in selected intervals.
The points labeled ‘’
refer to the configurations with , while the points
labeled ‘’ correspond to .
Figure 9: Backgrounds estimated with MC for as a function of
in selected intervals.
The points labeled ‘’
refer to the configurations with , while the points
labeled ‘’ correspond to .
V Acceptance and detector efficiency effects on the charge asymmetry
The charge asymmetry measurement is affected by the event reconstruction and
selection. These experimental effects are investigated using the full simulation
of signal events through changes of the raw charge asymmetry, defined as
, which are observed after each selection step as a
function of .
V.1 Study of the effects with the muon simulation
V.1.1 Kinematic acceptance
The kinematic acceptance includes the angular acceptance for the primary photon
and the two charged-particle tracks, and the momentum restriction () applied to
charged-particle tracks. Each kinematic selection is found to modify the slope of the raw charge asymmetry
significantly, though the total effect on the slope from the kinematic requirements
altogether turns out to be small due to accidental cancelations.
It is worthwhile to note that the kinematic selection in itself is
charge-symmetric. Hence the observed bias on the measured raw charge asymmetry is a
cross effect of physical charge-asymmetric kinematics and charge-symmetric
detector acceptance. It does vanish for a null physical charge asymmetry. As
checked with a simulated sample produced by ISR only, no fake charge asymmetry
emerges from the kinematic selection.
V.1.2 Software trigger and tracking
Biases on the raw charge asymmetry measurement originate from the software trigger and
the track reconstruction. They are observed in the low mass region, as illustrated in
Fig. 10
and vanish
at high mass ().
The common origin of the mass-dependent trigger and tracking inefficiencies
is geometrical and has been thoroughly studied for the cross section
measurement prd-pipi . Converging trajectories in the DCH of oppositely
deflected tracks emitted in close-by directions confuses the track
reconstruction and causes both the software trigger and the final
tracking inefficiencies. In the charge-conjugate configuration, in
which the positive and negative tracks are interchanged, tracks
diverge in the magnetic field and are well separated in the transverse
plane, although with the same absolute azimuthal opening angle. The
efficiencies are consequently charge-asymmetric, sharply reduced for
overlapping tracks in low regions, at values
close to zero but always positive, where is the signed
angular difference between the azimuths of the positive and negative
tracks
(14)
Figure 10: Raw charge asymmetry as a function of in selected intervals,
for MC events with () and without () reconstruction
of two good charged-particle tracks, where the events are already required to be within
the kinematic acceptance.
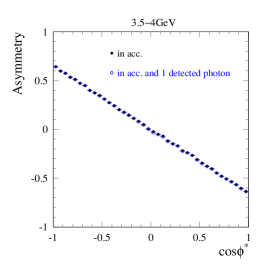
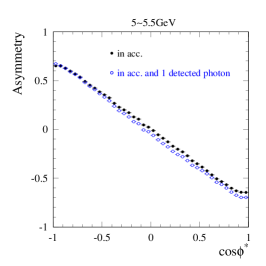
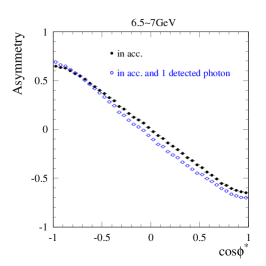
V.1.3 ‘ISR’ photon reconstruction
The event selection requires that an ‘ISR’ photon with
be measured in the EMC. The raw charge asymmetries for the fully simulated events
with and without the requirement of the ‘ISR’ photon being reconstructed are shown in
Fig. 11, where the events are already required to be
within the kinematic acceptance. Effects are observed in high
regions.
The origin of a charge-asymmetric photon reconstruction inefficiency is again
geometrical. In case one of the charged-particle tracks and the ‘ISR’ photon overlap in the
EMC, the shower produced by the ‘ISR’ photon is mistakenly associated to the
charged-particle track, and the ‘ISR’ photon is lost. In the charge-conjugate
configuration, no overlap occurs because of the opposite deflection of the
charged-particle track in the magnetic field. The overlap happens at
where is a small positive quantity,
and as a consequence, the ‘ISR’ photon reconstruction efficiency is
charge-asymmetric, strongly reduced around . As the overlap
of one charged-particle track and the ‘ISR’ photon occurs preferentially at high mass, due
to phase space, the corresponding effects are only observed at
.
Figure 11: Raw charge asymmetry as a function of in selected intervals,
for MC events with () and without () the requirement
of the reconstruction of the ‘ISR’ photon, where the events are already required
to be within the kinematic acceptance.
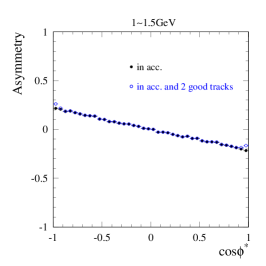
V.1.4 Muon identification
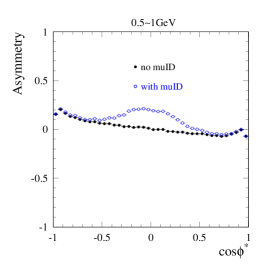
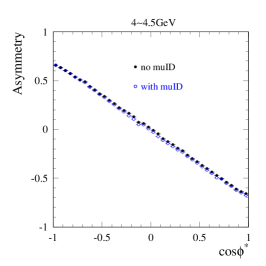
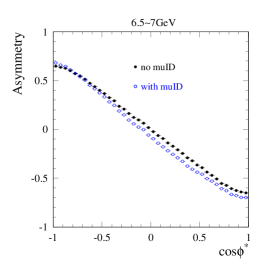
Figure 12: Raw charge asymmetry as a function of in selected intervals,
for MC events with () and without () the two-muon
identification, where the events are already required to be within the
kinematic acceptance and have two good charged-particle tracks reconstructed.
The charge asymmetry measurement is also affected by muon identification, in the
low and high regions, as shown in Fig. 12.
Charge-asymmetric inefficiency of muon identification results again from event
topologies. The first cause, which affects low regions, is the
overlap of the two charged-particle tracks at the IFR, which confuses the muon
identification algorithm. The second cause is the partial overlap of one charged-particle
track and the ‘ISR’ photon at the EMC, which makes the track look unlike a
muon. The latter effect is more pronounced at high mass, when a muon and the
‘ISR’ photon are emitted in close-by directions. The efficiency of muon
identification as a function of
exhibits a sharp dip at positive at low mass, and at
at high mass.
V.1.5 Summary of the acceptance and detector efficiency effects in the process
The overall efficiencies needed to correct the event yields
entering the charge asymmetry measurement (Eq. (13))
are the overall result of the acceptance-induced and detector asymmetries discussed above. They are
determined using the full simulation, separately for the samples.
As previously discussed, the detector inefficiencies are mostly caused by the spatial
overlap of trajectories occuring in the detector: 2-track overlaps in the DCH and
the IFR, respectively for and and
affecting masses below 2, and the photon-muon overlap in the EMC,
for and affecting masses above 4.
These various overlap effects contribute very asymmetrically to the two
samples, due to a complete correlation between the
and variables. This is demonstrated in
Fig. 13, which shows
that the () sample corresponds to ().
Since the 2-track overlaps occur for , one expects
. For the photon-muon overlap with nearly opposite
tracks the situation is reversed.
As a consequence, as summarized in
Fig. 14 (Sec. VI),
the acceptance and detector inefficiencies induce a change
in the observed charge asymmetry magnitude and also distort the linear
dependence on . The dominant effects are from geometric
acceptance, ‘ISR’ photon reconstruction and the track momentum
requirement .
Figure 13: (left) Distribution of vs. for the
sample () in the (0.5–1.0) mass interval for the MC;
(right) the same for the sample ()
However, although the detector is not completely charge symmetric, Fig. 13 shows
that the effects producing an asymmetry are nearly symmetric in .
The observable introduced in Eq. (5) is thus expected to be robust
against such effects. Overall, the slope of the asymmetry
is barely affected by detector inefficiencies and event selection.
In the process, the maximum effects, of a few ,
take place around . In the low mass
region [0.5–1.0], the effect from the overall selection is at the level of a few .
V.2 Study of the effects with the pion simulation
The acceptance and detector effects are also studied with the simulated
events.
The overall effect around the resonance
() is in average.
As the charge asymmetry is null for
MC events, generated with no LO FSR, the acceptance effects on the
slope of the charge asymmetry are quite small for any selection requirement, including
the kinematic ones. This is in contrast with the case, where the
individual kinematic requirements induce large effects. However this conclusion holds
only if the charge asymmetry in the data is actually null. If a sizeable asymmetry
is measured, the bias introduced by the cross effect of acceptance and asymmetry
has to be evaluated and corrected (Sec. VII.2).
VI Results on the charge asymmetry in the process
The measured raw charge asymmetry after the complete event selection for the data is
obtained as a function of in various intervals, and
shown in Fig. 14.
It is consistent to the first order with
the full simulation of events, except in the mass interval
populated by the resonance (3.0–3.5). This is expected as
production is not considered in AfkQed.
Figure 14: Raw charge asymmetry as a function of for
events in data () and MC (), in various intervals, after
the complete event selection.
The physical charge asymmetry for is obtained from the measured
distributions after background subtraction and efficiency
correction. The background dependence on is estimated with the
simulation for each of the samples , as explained
above. Similarly, the overall efficiency is obtained with fully
simulated events, and corrected for data/MC differences in
detector response. The efficiency differences between data and simulation have
been studied extensively for the cross section measurements of
and prd-pipi . They are parameterized as a function of
the azimuthal opening angle between the two muons, and projected
onto the variable by sampling with MC.
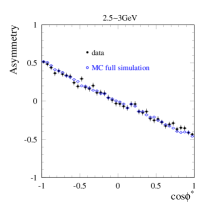
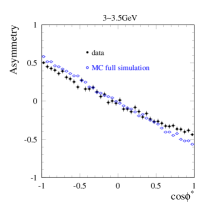
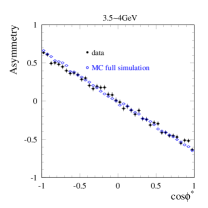
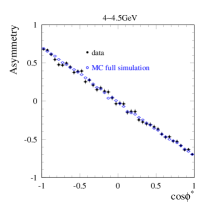
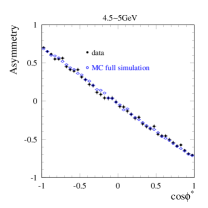
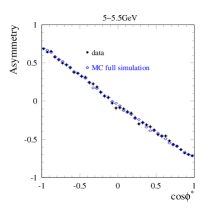
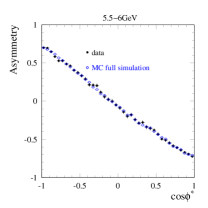
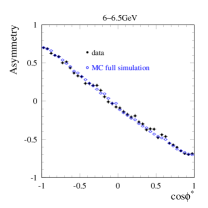
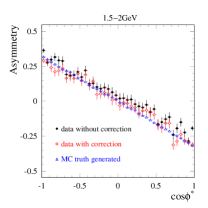
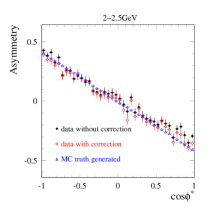
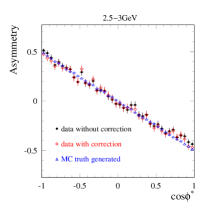
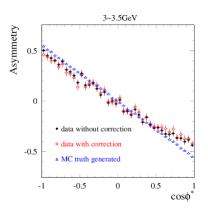
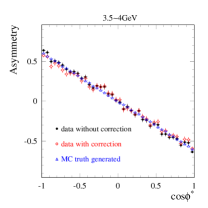
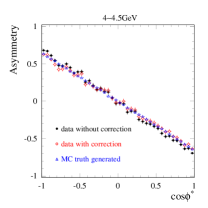
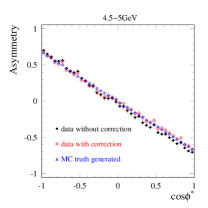
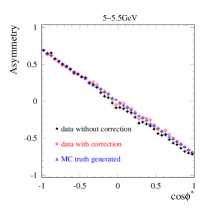
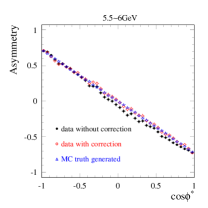
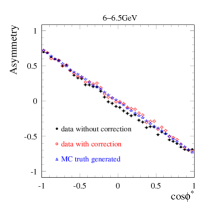
The charge asymmetry distributions for data after
background subtraction and efficiency correction, as well as the charge
asymmetry for MC at generation level, are shown in
Fig. 15. While the dependence of the
measured raw charge asymmetry is not linear, the corrected data distributions
are quite consistent with the MC distributions at generation level.
The slopes of charge asymmetry in various mass intervals are obtained by
fitting the background-subtracted efficiency-corrected charge asymmetry
distributions to .
Figure 15: Charge asymmetry in data before () and after () background subtraction and
efficiency corrections, and for MC () at generation level.
VI.1 Test of the charge asymmetry with events in data
Since with on-shell is a pure ISR process at energies, the
sample in the data provides a test of fake asymmetries that could arise
in the analysis.
To overcome the limited statistics of the sample, a loosened
event selection is applied, with the muon identification requirement removed, which
provides a gain in statistics by a factor of about 4, with no significant
increase of the hadronic background. The spectrum shows a clear
peak, over a linear QED background.
Defining and , the respective slopes of the
charge asymmetry for and underlying QED events, the slope measured in the vicinity of
the resonance is the average
(15)
where and are the yields from and QED,
respectively.
The quantities and are obtained by fitting the mass spectrum with a sum of
a linear QED component and a Gaussian signal, with fixed width equal
to the mass resolution at the and centered at the nominal
mass.
The slope is obtained by fitting the charge asymmetry
in the sidebands. The measured slope of the charge asymmetry as a
function of is shown in Fig. 16: the expected
behaviour is clearly observed, with a smooth variation from the QED continuum
with a large negative value and a sharp peak approaching a null slope on the
resonance. The specific slope is obtained as a function
of in Fig. 16 according to Eq. (15): its
value is stable across the peak and a fit to a constant between 3.07
and 3.12 yields
(16)
which is consistent with zero, as expected from the ISR-only production.
Figure 16: (left) The measured charge asymmetry as a function of mass near the
resonance. (right) The derived charge asymmetry for from
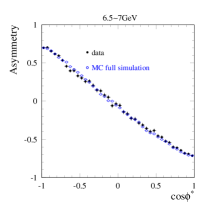
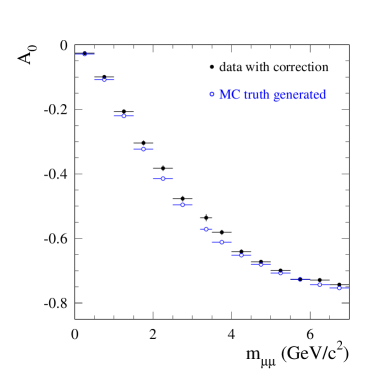
VI.2 Comparison to QED
The final slope as a function of measured on the data is
shown in Fig. 17, together with the asymmetry at the
MC generation level, and the difference between them.
The mass interval containing the
pure-ISR contribution from the (), discussed in detail in Sec. VI.1,
is excluded.
The absolute difference between data and MC
is at a few percent level (0–3%).
The measured slope of charge asymmetry is negative throughout the mass
range under study, and its magnitude increases with mass, reaching
values as large as at , in agreement with the trend predicted by QED.
However, while data and LO QED agree
within at mass less than and above , a small but
significant
discrepancy shows up for intermediate mass, reaching between
1.5 and . Investigations of systematic uncertainties, both at the experimental
and theoretical levels, are reported in the next
section.
Figure 17: The slope of charge asymmetry as a function of in
data and in MC at generation level (left), and the absolute difference
between them (right). The mass region (3.0-3.2) is excluded.
Only statistical uncertainties are shown.
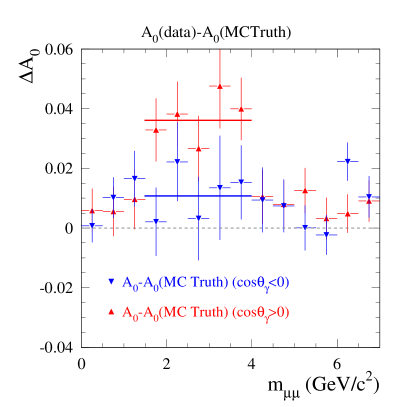
Due to the asymmetry of the beam energies at PEP-II, independent
charge asymmetry measurements in two different kinematic regimes are provided
by splitting the data into a forward () sample
and a backward () sample. The full analysis,
including background subtraction and efficiency correction, is
redone on each sample separately. The results are shown in
Fig. 18.
A significant discrepancy between data and AfkQed is observed in the forward
region, in the 1.5–4 mass region, while in the backward hemisphere
data and AfkQed are consistent. The differences are quantified in
Table 1. No significant forward-backward difference
is expected from the generator.
Table 1: The difference (in units) between the measured and the AfkQed
prediction for the two mass intervals 1.5–4 and 4–7 in different
regions. The last line gives the difference between the two
regions and .
Statistical uncertainties only.
()
all
difference
Figure 18: The difference between the measured asymmetry slope in the
process and the AfkQed prediction, as a function of
, excluding the 3.0-3.2 region. Forward
() and backward ()
hemispheres are analysed separately.
Statistical uncertainties only.
VI.3 Systematic uncertainties
VI.3.1 Experimental systematic effects
The primary sources of systematic uncertainty are the background estimation,
data/MC differences in detector response, and differences between the physical
charge asymmetry in the data and in the generated MC events.
The difference
between the results with and without background subtraction is
found to be well below
except in the 0.5–1.0 range, where it reaches 2 because of the larger background with two pions misidentified
as muons. Since the background level is known with better than 10%
accuracy prd-pipi , the corresponding systematic uncertainty on the
asymmetry slope is at most 2 throughout the studied mass range.
The trigger, tracking and -ID induce charge-asymmetric data/MC corrections,
as overlap effects are not perfectly reproduced by simulation. However, the
data/MC corrections have small
effects on the charge asymmetry slope, at most 3. Since the corrections have
been measured with a precision of 10% or better prd-pipi , the
corresponding systematic uncertainty on the asymmetry slope is less than
3.
As explained in Sec. V.1.1, the effects from the kinematic acceptance on the measured
slope of the charge asymmetry depend on the physical charge asymmetry
itself. The possible bias on the acceptance correction, induced by the
physical charge asymmetry in the generator inaccurately reproducing the data, is studied using
a sample of re-weighted MC events where weights are adjusted to
yield the same asymmetry as measured in the data in
each (, , , ) phase-space
cell. The expected bias in the measurement from a difference of charge asymmetry
between data and MC is found to be less than 5, which is taken as a
systematic uncertainty on the measurement.
VI.3.2 Effects from imperfect simulation
Since a simple linear fit might be
questionable, we perform an alternate two-parameter fit on the charge asymmetry
after efficiency corrections .
The values obtained in data are a few at most,
while the asymmetry slopes deviate from the final values, which use the one-parameter fit,
by less than .
To investigate whether the observed discrepancy results from the efficiency
corrections, we study the difference between the raw
asymmetries observed in data and MC after full event selection.
Although the raw asymmetry itself is not linear, especially at low
mass (Fig. 14), the difference
in each mass interval is observed to be
linear with . In particular, there are no edge effects in
the vicinity of , which could have resulted
from different resolutions in data and MC.
The results of the fits are shown on Fig. 19 (black points).
The values of the slope of are
insensitive whether the linear fit is a one-parameter or a
two-parameter fit.
The data-MC discrepancy in the 1.5–4 mass region is already
observed at the raw level, which excludes efficiency or resolution bias.
The values returned by the two-parameter fit over
depart from zero by up to 2.5 at low mass, as expected
from imperfect detector simulation. When data/MC corrections of detector
efficiencies are applied to the simulated raw data, the results are shown on
Fig. 19 (blue triangles).
The values are reduced to a few , while the slope of
is not changed by more than 3.
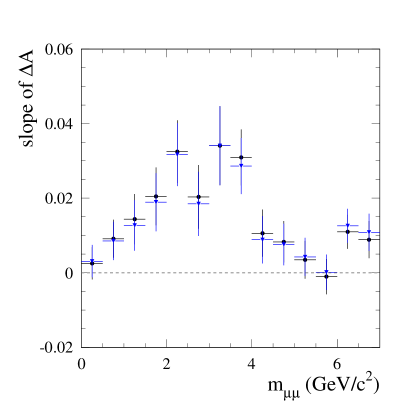
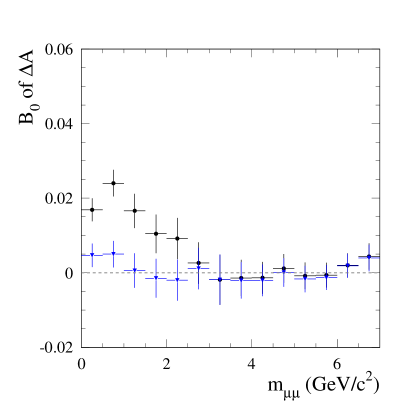
Figure 19: (left) Slope of the difference for
between the raw
asymmetries observed in data and in MC before (black points) and after (blue triangles)
the data/MC corrections,
as a function of
. (right) Constant term of the two-parameter linear fits of
.
Statistical uncertainties only.
When performed on the forward and backward samples independently, the
study at the raw data level confirms that the data-MC discrepancy in
the 1.5–4 mass interval is confined to the forward region, where
the slope of is significantly non-null by
while it is consistent with zero within over the full mass
range for the sample. In contrast, the fitted
values are consistent with each other in the two samples,
except at very low mass ().
Comparisons of the data and MC distributions of event variables
entering the asymmetry analysis are performed, in particular near the
acceptance boundaries. A sizeable departure is observed in the high
, low region, in the forward
hemisphere. However, the asymmetry measurement is found
to be insensitive to this discrepancy at very forward photon angles.
To investigate whether different resolutions in data and MC might bias
the efficiency corrections and the event assignment to the or
samples, the analysis is fully redone with tighter acceptance
requirements. The change of asymmetry slope is small, .
Conservatively, a systematic uncertainty of 7 is assigned to account for
imperfect simulation near the edges of the selected phase space.
The studies above first show that, although acceptance and detector inefficiency
effects are important, they are well accounted for in the simulation. Data/MC corrections
are found to significantly reduce the symmetric component of the asymmetry (), but
most importantly, the studies demonstrate that the measurement of the asymmetry slope is
robust against uncertainties in the efficiency corrections.
As a global test to differentiate between an uncorrected experimental
bias and a true deviation from the QED prediction, the difference
between the measured asymmetry and the theoretical one, as
implemented in AfkQed, is studied as a function of for
the events in the mass interval 1.5–4 where the deviation is
the largest (excluding the 3.0–3.2 region). As shown in
Fig. 20,
a linear dependence is indeed observed. This supports the assertion that
the deviation we observe does not originate from a detector effect unaccounted for
in the simulation.
Figure 20: The difference between the measured asymmetry in the
process and the QED prediction, as implemented in AfkQed,
as a function of for the events in the mass interval 1.5–4,
excluding the 3.0–3.2 region. The result of a linear fit is
shown by the solid line.
VI.3.3 Theoretical systematic effects
The AfkQed event generator only includes the LO QED interference
between ISR and FSR amplitudes. Additional photons generated
independently for ISR and FSR, induce a change in asymmetry through
kinematics. The NLO contributions to the QED interference are studied
with the latest version of the PHOKHARA
generator phok-2013 , which includes a full matrix element
computed at NLO. NLO contributions are found to affect the charge
asymmetry by 1-2 in the mass range covered by the present
analysis, where events are generated with the highest energy photon
in the reference
range czyz-nlo . The PHOKHARA results with fully implemented
NLO corrections are consistent with the AfkQed results with
independent extra photons, with some small discrepancy up to for masses
larger than 4.
This shows that the small difference
between LO and NLO asymmetry originates essentially from kinematic
effects due to the extra photon.
The contribution from exchange is investigated with the KKMC
generator kk2f , either processed in the QED-only
configuration, or including
the full exchange diagrams. As in AfkQed, extra photons are
generated independently in the initial state
and final state (with PHOTOS).
Electroweak (EW) effects are found to be at a few level, averaging
over the full mass range.
A significant difference of is observed between the asymmetry slopes in
KKMC and AfkQed, with an asymmetry slope larger (in absolute
value) in AfkQed than in KKMC. The conclusion holds if one
considers the forward and backward hemispheres separately. As already
observed for AfkQed, the asymmetries expected
from KKMC in the two hemispheres are consistent with each other.
Comparison of the asymmetry slope measured in data, after acceptance
correction, to the full QED+ expectation, as implemented in KKMC, confirms that a significant difference of 2
remains in the 1.5–4 mass interval, mostly in the forward
hemisphere ().
VI.3.4 Conclusion on systematic uncertainties
In the large number of tests, both experimental and theoretical, that have been performed,
the antisymmetric part () of the charge asymmetry is found to be remarkably stable.
It is immune
to all detector effects taken into account in the simulation, unlike the symmetric part ().
The simulation properly corrects known effects after data/MC
adjustment of separate sources. The experimental absolute systematic uncertainties
on are estimated to be 0.5 from MC reweighting, 0.3 from data/MC efficiency
corrections, 0.7 from acceptance edge effects, which sum up to 0.9.
In view of the observed differences on using AfkQed, PHOKHARA 9.0 (LO and NLO) and
KKMC (with and without EW corrections),
we conservatively set a 1.0 systematic uncertainty on the theoretical prediction.
Adding experimental and theoretical uncertainties quadratically a total absolute
systematic uncertainty of 1.4 is obtained.
Although we have been unable to find a bias producing the observed shape as a function
of mass of the difference between the measured and the QED predictions, all data
points are within the estimated systematic uncertainty, except for 5 out of 14 points
near 3 that exceed the systematic uncertainty by about 1-2 statistical standard deviations.
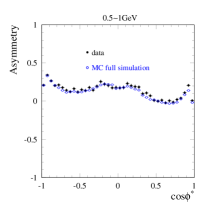
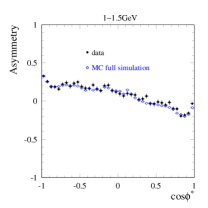
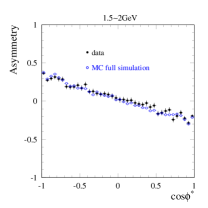
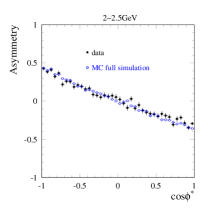
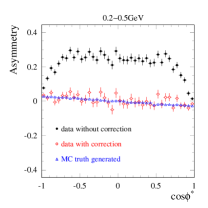
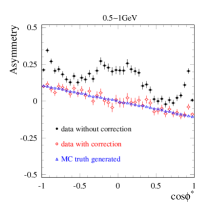
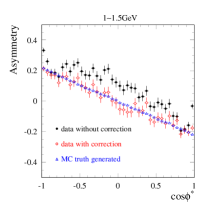
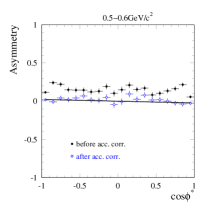
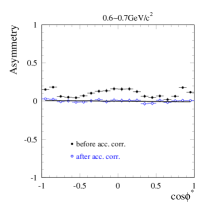
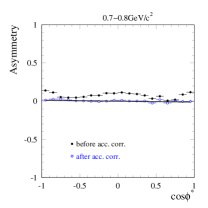
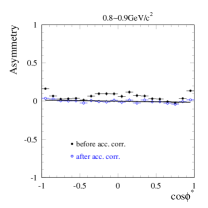
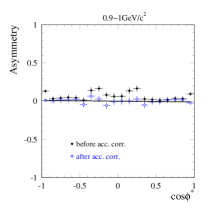
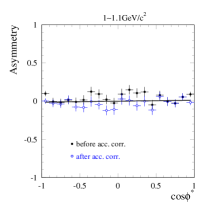
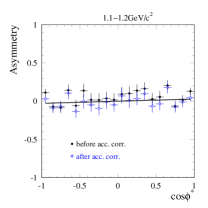
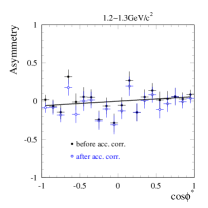
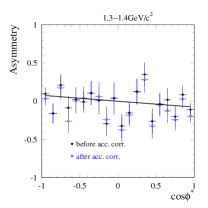
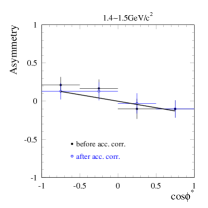
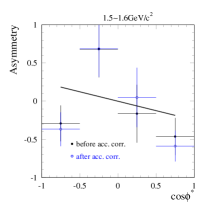
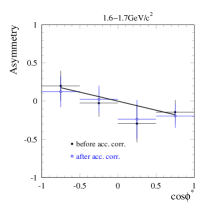
VII Results on the charge asymmetry in the process
The charge asymmetry for data before and after background subtraction
and efficiency corrections is shown in Fig. 21. As for
, the background for the process is estimated
with MC, as explained in Sec. IV.5. The overall efficiency
is obtained with full simulation of events, as a function of
at respective masses, and corrected for data/MC differences in
detector response.
The slopes of charge asymmetry in various intervals are
obtained by fitting the corrected charge asymmetry distributions to
. The results for the data are shown in Fig. 22 as a
function of . In the resonance region, the measured asymmetry is
negative, and its magnitude does not exceed . A clear interference pattern is
observed at higher mass.
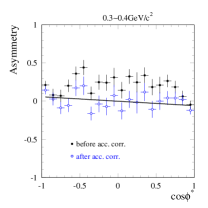
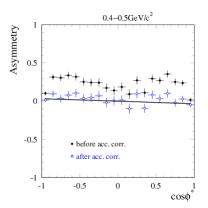
Figure 21: Charge asymmetry for data before () and after ()
efficiency corrections, in 0.1 mass intervals from 0.3 to 1.8.
The line shows the result of the fit to .
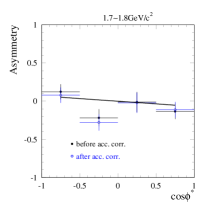
Figure 22: The fitted slope of the charge asymmetry for
at , corrected for efficiency within
the acceptance in the c.m.
VII.1 Comparison and fit to models
The magnitude of the charge asymmetry, and its variation with mass,
measured in the data (Fig. 22) is quite
different from the prediction of the FSR model 1, which treats the
pion as a point-like particle (Sec. III.2.1). This model is
not considered any further. Instead the a priori more realistic quark
FSR model 2 (Sec. III.2.2), with the modified form of the GDA
formula (Eq. (12)), is used to fit the data. The S-wave
and D-wave magnitudes () are left free in the fit, while the
mass and width for the resonance
are fixed to the world averages PDG2012 . Because the measured
charge asymmetry loses precision near the production
threshold and above 1.4, the fit is performed between 0.3 and 1.4. The upper limit removes the delicate region around
where the pion form factor has a very pronounced dip
leading to a poor knowledge of the ISR amplitude.
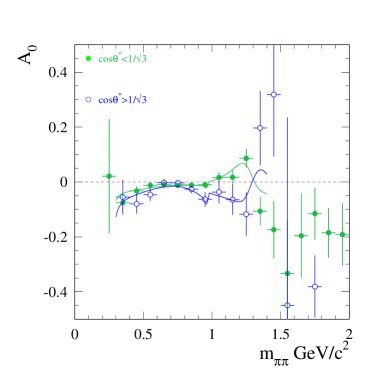
A distinctive interference pattern is observed in Fig. 22 at the location of the
resonance. In Eq. (12), assuming the dominance of helicity 0 for the
production, the angular dependence of the interference term in the
c.m. is given by the Legendre polynomial , which changes sign
at . As a consequence, the charge
asymmetry is expected to follow the same pattern in the vicinity of the
resonance.
To check this feature, the charge asymmetries are
measured separately in the phase space below and above
.
The data sample is split according to the additional requirement
, or . To enhance the
efficiency in the high region, the event selection is loosened,
by removing the and pion identification requirements on the track with lower
momentum. To keep backgrounds at manageable levels, the higher
momentum pion is required to satisfy the tighter identification criteria of a
‘hard ’ prd-pipi . To further reduce the electron contamination, an
enhanced selection is applied to the high momentum track,
and the ionization energy loss in the DCH of the low momentum track
is required to be below the average electron loss (). The corresponding efficiencies
are obtained separately from the full simulation of events in
the low and high regions. While the effective
range is limited to with the standard event selection, the
specific selection applied in the high region allows to extend
the asymmetry measurement up to . Backgrounds are
estimated accordingly using the full simulation of relevant processes. After
background subtraction and overall acceptance correction, the charge asymmetries
obtained for below and above are shown in
Fig. 23.
Since a large fraction of the events in the standard analysis are in the low
region, the charge asymmetry measured with
is quite close to the one obtained using the full
sample (Fig. 22). Although limited by statistics, the charge
asymmetry measured in the high region presents the opposite
sign oscillation around the mass, which is the expected pattern.
The change of sign between and
, and the opposite variation across the resonance
provide a solid validation that the observed charge asymmetry around the
resonance is indeed due to the interference between the two
amplitudes for and , with in the helicity 0 state. In the mass
range below , the asymmetry keeps the same (negative) sign in the two
regions, as expected for the interference with a scalar amplitude flat in
.
Figure 23: The charge asymmetries measured with below and
above . The curves represent the
fit results (see text).
The two independent data samples, with below and
above , are fitted separately to the model, and the fitted
and amplitudes are obtained in both cases. Since the pure
ISR AfkQed MC used to compute the efficiencies is not expected to
properly correct for unmeasured regions of , the fit
of the data above is performed in the effective range of
non-null efficiency where asymmetries are measurable.
The model describes the data well, and the two sets of fitted values of
and are consistent in sign and magnitude and can be averaged, yielding
and .
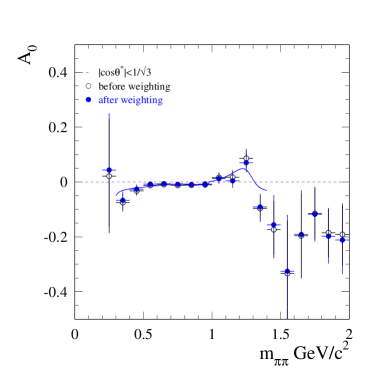
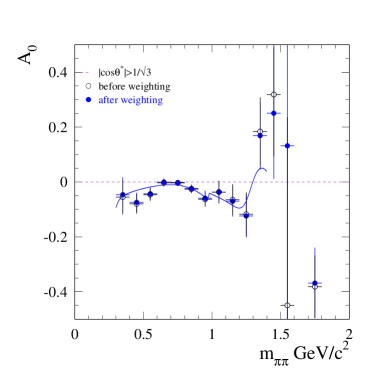
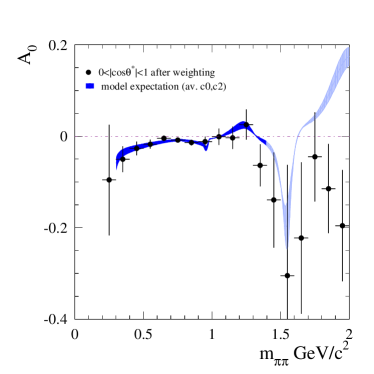
VII.2 Monte Carlo reweighting and final results
Figure 24: The charge asymmetry slopes for using MC samples
with and without reweighting, and fit to the model after reweighting (see text); (top left) for
; (top right) for ;
(bottom) for the full range; the blue band represents the model-2
prediction using the average values after reweighting.
The light-blue part corresponds to the extrapolation
of the model beyond the fitted range.
Since a significant asymmetry is observed in the data in contrast with AfkQed, which
does not include LO FSR in the pion channel, the overall efficiencies computed with MC
and used to measure the asymmetry in data are biased through
the cross effect between the acceptance and the physical asymmetry
(Sec.V.1.1).
This situation calls for an iterative procedure to introduce the
observed interference effect into the MC.
To implement this procedure, new MC samples of reweighted events are produced,
in which the weights are computed event by event as the full cross section value
including LO FSR divided by the ISR-only cross section, for the values of
, , and for the
event. The differential cross sections are given by the model used to fit the data
(Eqs. (8-10)). The FSR model is made quantitative by using
the fitted values for . The studies have been performed separately for the
regions below and above .
The fitted values of and are stable after two
iterations. A third iteration is performed in order to check the stability of
the results. The difference between the last two iterations
is taken as a systematic uncertainty.
The final values are given in Fig. 24, together with
the FSR model prediction using the fitted values determined by the iterative
process. The extrapolation of the model beyond the fit
region 0.3-1.4 is shown (light-blue band). Although the statistical uncertainty
of the data is large, there is evidence that the model becomes inadequate above 1.8.
This is not surprising since a constant S-wave amplitude
and the resonance are likely to be insufficient to describe this region,
where many high mass resonances contribute to the final state.
However, based on the change of asymmetry at the level induced at lower mass,
the effect of inadequate reweighting in the last few mass bins is expected to be
much smaller than the statistical uncertainty.
Since the two independent sets of parameters agree within their uncertainties,
they can be combined and the weighted average of the fitted values represents
the best information which can be obtained from this interference analysis
(Table 2). An alternative is to fit the overall sample
obtained with the standard selection, using efficiencies calculated with the
reweighted MC. In this case, as the data spans over the sign change at
, the measured asymmetry is much reduced. Therefore
the combined result from the two complementary ranges is more sensitive, and
moreover provides a clear confirmation of the helicity 0 contribution.
Table 2: The
parameters obtained from the fit of the charge asymmetry for
at after three iterations, with in the c.m.,
in the below and above regions, and the
weighted average, where the errors are statistical. The results of the direct
fit over the full range are given in the last column.
parameter
average
all
VII.3 Systematic uncertainties
The difference between the results with and without background
subtraction is found to be less than , except near threshold (1) and
above (1 at ). Except in the dip region at
where the ISR cross section has a sharp minimum and statistical
uncertainties are very large, the background level has been
checked prd-pipi with a precision of 20% in the worst cases. The
systematic uncertainty due to background subtraction is consequently estimated
to be less than 2 from 0.4 to , increasing above
(2 at ).
As observed for , the selection requirements for
trigger, tracking, and -ID have charge-asymmetric efficiencies
for the process. The corrections for the difference
between data and MC on the efficiencies are included in the overall
acceptance. The difference between the charge asymmetry results with
and without the data-MC corrections is smaller than except
in the dip region (0.5). Since the corrections are determined with
data with a precision of 10%, the resulting systematic uncertainty is
negligible.
As done for , the asymmetry in is
alternatively fitted to since a bias on and values
inconsistent with zero might disclose an incorrect efficiency
determination, or an incorrect background subtraction.
As shown in Fig. 25,
the fitted slopes deviate from the final values by less than ,
except in the background dominated dip region of the cross section
(), where the deviation
reaches 3. In the region where the fit of the
theoretical model is performed (0.3–1.4),
the slope does not change by more than 5, except in
the last (1.3–1.4) bin, where the deviation is 2.
This is consistent with the estimated background contribution to the systematic error.
The fitted values are within from zero over the full mass range.
The average for is .
Figure 25: The change of slope (left) and constant term
(right) in the fit of charge asymmetry to , as a
function of mass for .
Different interaction rates in the detector material for positive and negative pions
induce a charge asymmetry. Although such an effect is included in the simulation
of the detector response
based on GEANT4, its description and the corresponding track loss are known to be
somewhat imperfect. Independent studies have shown that data/MC
discrepancies occur at the 10% level for both and , in opposite
directions.
A residual charge asymmetry is thus expected after applying the MC corrections.
The effect of imperfect simulation of nuclear interactions is investigated
using the large sample of events produced by AfkQed
at the generator level. A weight is assigned to each track according to its momentum
and its path length through detector material as a function of the polar angle, using a
relative change in the respective and interaction rates. The charge
asymmetry obtained after the interaction reweighting is subjected to the two-parameter
linear fit in the integrated mass range from 0.4 to 1.2 .
The slope changes by only , which confirms the
robustness of the observable.
The charge asymmetry itself is however modified as the fitted value is found to be
displaced significantly, ,
in good agreement with the observed value in data in the same mass range.
Imperfect simulation of nuclear interactions thus provides a plausible explanation of the small
values found in the analysis, while leaving the measurement unaffected.
Summing up all sources, including the estimated cross-effect between
acceptance and physical asymmetry, the absolute systematic uncertainty on is estimated to
be less than 0.17% in the
region and less than 0.1% elsewhere.
VII.4 Searching for an signal in the cross section
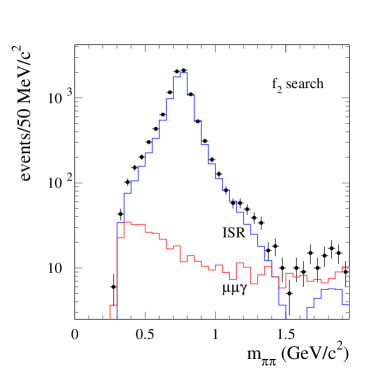
Figure 26: The
mass spectrum for for the analysis extended to
low momentum (points), the expected background from misidentified
events (red histogram), and the predicted ISR spectrum from the
standard cross section analysis (blue histogram).Figure 27: The
mass spectrum for for the analysis extended to low
momentum (points) after subtraction of the background and the
ISR contribution. The curve is the result of a fit to a constant term and a simple
Breit-Wigner shape for the resonance.
Given the sizeable amplitude of the D-wave contribution to the ISR-FSR
interference obtained from the charge asymmetry measurement, direct evidence of
production is searched for in the cross section measurement. While the
latter is overwhelmingly dominated by the ISR production of the
resonance, the rapid fall off of the pion form factor in the vicinity of the
, and the distinct angular distribution
of the D-wave in the system, are assets used in the direct search.
Since the distribution exhibits a peak at
near unity, in contrast with the dependence of
the ISR cross section, the search is performed in the very high range
. Because the standard event selection depopulates that region completely,
due to the momenta of both tracks being required to be larger than , the direct search uses
the specific selection designed for the charge asymmetry measurement in the
high region (Sec. VII.1), with an even tighter requirement.
The mass spectrum of the reconstructed events in this specific analysis
is displayed in Fig. 26 with the largest expected
background from events to be subtracted. The resulting
spectrum is dominated by the ISR production, which is also subtracted. The
remaining spectrum shown in Fig. 27 does not present any
significant excess at the mass or elsewhere, except for a slow rise above
(not shown) that originates from a residual background. The mass spectrum
is fitted between 0.95 and to a constant and a Breit-Wigner lineshape
with the world average mass and width PDG2012 and a free-floating
amplitude. The fitted number of events in the mass interval at the peak
is found to be , to be compared to ISR events in the
same interval. After correction for the loss of efficiency near
obtained from MC for ISR and candidates, the
fraction in the -enhanced range
is measured to be . This corresponds to a
value equal to .
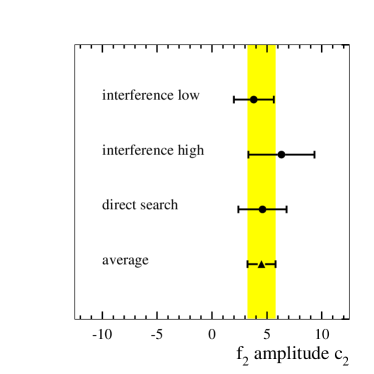
The three independent determinations of (the interference fits in two
regions and the direct search in the cross section) yield
consistent results. Since a positive sign is clearly indicated by the
interference analysis, the value from the direct search is also taken to be
positive. The three independent values can be combined with the result
, establishing LO FSR production of the resonance at
the level. The corresponding production cross section is
. The results are displayed in Fig. 28.
The size of is about a factor of two larger
than the value predicted by Chernyak chernyak with a QCD model giving
. However the difference only amounts to , not
including the unknown theoretical uncertainty. The sign is not provided in
Chernyak’s prediction.
Figure 28: The results obtained for the amplitude in the process
from the interference analysis and the
direct search in the cross section. The labels ‘low’ and ‘high’ refer
to the determination in the two angular ranges and
. For the direct search the positive solution is
chosen. The combined value for the three independent analyses is given by the
vertical band.
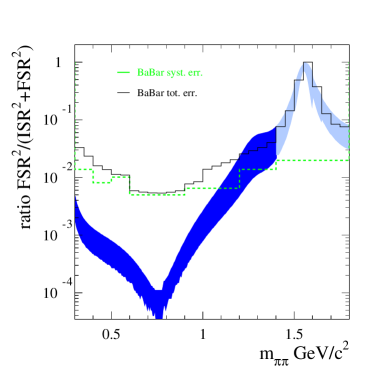
VII.5 Consequences for the cross section measurement
by BABAR for and contribution to the anomalous magnetic moment
of the muon
In the measurement of the cross section by the
BABAR collaboration prd-pipi using the ISR method, the lowest-order
FSR contribution was argued to be negligible, based on theoretical estimates.
The primary result of the present
interference analysis is to determine the actual size of the cross section, misinterpreted as ISR, and its contribution to the total
cross section ().
Using the FSR model 2, which describes well the measured charge asymmetry in the
[0.3–1.4] range, the FSR cross section calculated through
Eq. (9) with the fitted parameters, is extrapolated
to higher masses. The resulting
FSR fraction in the BABAR cross section is given in
Fig. 29 as a function of . As expected the FSR fraction
is negligible in the region, but increases significantly above
due to the contribution and the rapid fall-off of the pion form
factor. In fact the FSR ‘background’ exceeds the estimated systematic
uncertainty quoted in Ref. prd-pipi (green histogram in
Fig. 29) for mass above
, while remaining close to the total uncertainty (black histogram).
The FSR contribution is found to be dominant around , in the region
where the ISR cross section displays a deep dip and is consistent with zero
within the large errors.
Figure 29: The FSR fraction in the BABAR measurement prd-pipi
of the
cross section, defined as the ratio
obtained in this analysis using FSR model 2 with
parameters fitted to data (blue band). The light-blue part corresponds to the extrapolation
of the model beyond the fitted range. The FSR fraction is compared to the
systematic error of the BABAR cross section measurement (green dashed histogram)
and its total error (black histogram).
The contribution to the muon magnetic anomaly, , from hadronic
vacuum polarization involves a dispersion integral over the cross section
weighted by a known kernel (Ref. dehz
and references therein). The integral is dominated by the channel
and its most precise determination to date is from BABAR using the ISR
method prd-pipi with the value
when integrating from threshold to 1.8.
This value is derived under the assumption that the cross section
for has a negligible contribution from LO FSR.
The present measurement of the charge asymmetry allows one to validate this
assumption in a quantitative way. Using the FSR fraction shown in
Fig. 29, the contribution to from the LO
FSR falsely attributed to the ISR cross section is found to be, in the same
energy range up to 1.8
(17)
This reduces the value of by
relative to the BABAR determination. The correction is small
compared to the total BABAR relative
uncertainty of , which justifies its earlier neglect.
VIII Conclusions
The radiative process , where and are considered in this
analysis, involves contributions from both LO ISR
and FSR. Because charge parities of the final state pair are
opposite for ISR and FSR, the interference between ISR and FSR changes sign with
the charge interchange of the two muons (pions). As a consequence,
investigation of the charge asymmetry of the process gives a way to study the
interference between ISR and FSR, which is sensitive to the relative
contribution of LO FSR.
From QED for , and from FSR models for , we find that the charge asymmetry
has a strong dependence on the angle between the
() plane and the plane in the c.m. system,
which can be simply represented by a linear function . The
slope quantifies the magnitude of the interference between ISR and FSR.
The acceptance effects on the measured charge asymmetry are studied
with the full simulation of and
events. We find that the detector and event selection, including
trigger, tracking, PID, and kinematic fitting, induce nonlinear patterns
on the dependence of the charge asymmetry, but have a
small impact on the determined slope . Kinematic acceptance — namely the
angular acceptance, and energy or momentum requirements on the final state
particles — changes the slope of the observed charge asymmetry
significantly, although the kinematic requirements are
charge-symmetric. This is due to a cross effect between acceptance
and true interference that produces a bias in the measured asymmetry
if the physical asymmetry differs between data and MC. This bias is
corrected through an iterative procedure in the analysis, as
in that case the charge asymmetry is null in the generator.
After background subtraction and correction for the overall
acceptance, which are obtained from the full simulation with
corrections for data/MC differences, we measured the slope of
the charge asymmetry as a function of (). The
QED test, namely the comparison between the charge asymmetry measured
in the data and predicted by the simulation, in which the LO
ISR-FSR interference is implemented,
shows an overall
good consistency. However, some absolute deviation amounting to
in the
region is observed and cannot be fully explained by known
systematic effects, either in the data or in the MC generators,
which are estimated to be less than 0.014.
The measured slope of charge asymmetry in the data is
about and flat around the mass. Outside of the peak, the data
exhibits the pattern expected from the interference between
and . The data
shows a good consistency with the predictions of a model of FSR from quarks with
contributions of a scalar widespread mass distribution and the
tensor resonance. In the region the results are not
consistent with a model based on FSR from point-like pions
(scalar QED), in contrast with the observations at low energies [4].
These results are first measurements of the charge asymmetry in the
process, and for at high energy ().
The FSR contribution to derived from this analysis is small and
this confirms that it is
negligible in the measurement of the cross section obtained by BABAR assuming pure
ISR prd-pipi . Accordingly this FSR bias translates into a correction to
the muon magnetic anomaly of only per mille of the
hadronic vacuum polarization determined from BABAR data, small compared to the total quoted
uncertainty of 7.4 per mille.
We gratefully acknowledge useful discussions on theoretical
issues with H. Czyż, Zhun Lu and B. Pire, and clarifications by A.B. Arbuzov, S.J. Brodsky, R. Gastmans, and R. Kleiss.
We are grateful for the
extraordinary contributions of our PEP-II colleagues in
achieving the excellent luminosity and machine conditions
that have made this work possible.
The success of this project also relies critically on the
expertise and dedication of the computing organizations that
support BABAR.
The collaborating institutions wish to thank
SLAC for its support and the kind hospitality extended to them.
This work is supported by the
US Department of Energy
and National Science Foundation, the
Natural Sciences and Engineering Research Council (Canada),
the Commissariat à l’Energie Atomique and
Institut National de Physique Nucléaire et de Physique des Particules
(France), the
Bundesministerium für Bildung und Forschung and
Deutsche Forschungsgemeinschaft
(Germany), the
Istituto Nazionale di Fisica Nucleare (Italy),
the Foundation for Fundamental Research on Matter (The Netherlands),
the Research Council of Norway, the
Ministry of Education and Science of the Russian Federation,
Ministerio de Economía y Competitividad (Spain), the
Science and Technology Facilities Council (United Kingdom),
and the Binational Science Foundation (U.S.-Israel).
Individuals have received support from
the Marie-Curie IEF program (European Union) and the A. P. Sloan Foundation (USA).
References
(1) V.N. Baier and V.S. Fadin,
Phys. Lett. B 27, 223 (1968).
(2) A.B. Arbuzov et al.,
J. High Energy Phys. 9812, 009 (1998).
(3) S. Binner, J.H. Kühn, and K. Melnikov,
Phys. Lett. B 459, 279 (1999).
(4) M. Benayoun et al.,
Mod. Phys. Lett. A 14, 2605 (1999).
(5) A. Bevan et al. (BABAR and Belle Collaborations)
Physics of the B Factories (chapter 21),
Eur. Phys. J. C 74, 3026 (2014).
(6) B. Aubert et al. (BABAR Collaboration),
Phys. Rev. Lett. 103, 231801 (2009);
J.P. Lees et al. (BABAR Collaboration),
Phys. Rev. D 86, 032013 (2012).
(7) S.E. Muller et al. (KLOE Collaboration),
Chin. Phys. C 34, 686 (2010).
(8) H. Czyż et al.,
Phys. Lett. B 611, 116 (2005).
(9) R. Gastmans and T. T. Wu,
‘The Ubiquitous Photon’, Oxford (1990).
(10) F.A. Berends and R. Kleiss,
Nucl. Phys. B 177, 237 (1981).
(11) A.B. Arbuzov et al.,
J. High Energy Phys. 9710, 001 (1997).
(12) T. K. Pedlar et al. (CLEO Collaboration),
Phys. Rev. Lett. 95, 261803 (2005).
(13) H. Czyż et al.,
Eur. Phys. J. C 35, 527 (2004);
Eur. Phys. J. C 39, 411 (2005).
(14) Z. Lu and I. Schmidt,
Phys. Rev. D 73, 094021 (2006);
Erratum, Phy. Rev. D 75, 099902(E) (2007).
(15) M. Diehl, T. Gousset and B. Pire,
Phys. Rev. D 62, 073014 (2000).
(16) B. Hyams et al.,
Nucl. Phys. B 64, 134 (1973).
(17) F. Campanario et al.
J. High Energy Phys. 1402, 114 (2014).
(18) check on PHOKHARA site (http://ific.uv.es/̃rodrigo/phokhara/)
(19) R.W. Brown and K.O. Mikaelian,
Lett. Nuovo Cimento 10, 305 (1974).
(20) A.B. Arbuzov et al.,
J. High Energy Phys. 9710, 006 (1997).
(21) J.P. Lees et al. (BABAR Collaboration),
Nucl. Instr. Meth. A 726, 203 (2013).
(22) B. Aubert et al. (BABAR Collaboration),
Nucl. Instr. Meth. A 479, 1 (2002);
B. Aubert et al. (BABAR Collaboration),
Nucl. Instr. Meth. A 729, 615 (2013).
(23) H. Czyż and J.H. Kühn,
Eur. Phys. J. C 18, 497 (2001).
(24) M. Caffo, H. Czyż, and E. Remiddi,
Nuo. Cim. 110 A, 515 (1997).
(25) E. Barberio, B. van Eijk, and Z. Wa̧s,
Comput. Phys. Comm. 66, 115 (1991).
(26) T. Sjöstrand,
Comput. Phys. Comm. 82, 74 (1994).
(27) S. Jadach and Z. Wa̧s,
Comput. Phys. Comm. 85, 453 (1995).
(28) S. Agostinelli et al.,
Nucl. Instr. Meth. A 506, 250 (2003).
(29) We thank Henryk Czyż for providing these tests with
PHOKHARA-V9.
(30) S. Jadach, B.F.L. Ward, and Z. Wa̧s,
Comput. Phys. Comm. 130, 260 (2000).
(31) J. Beringer et al. (Particle Data Group),
Phys. Rev. D 86, 010001 (2012).
(32) V. Chernyak, private communication.
(33) M. Davier, S. Eidelman, A. Höcker, and Z. Zhang,
Eur. Phys. J. C 27, 497 (2003).