SF2A 2015
Estimating Stellar Fundamental Parameters Using PCA: Application to Early Type Stars of GES Data
Abstract
This work addresses a procedure to estimate fundamental stellar parameters such as , logg, [Fe/H], and using a dimensionality reduction technique called principal component analysis (PCA), applied to a large database of synthetic spectra. This technique shows promising results for inverting stellar parameters of observed targets from Gaia Eso Survey.
keywords:
stars: fundamental parameters, techniques: spectroscopic1 Introduction
With the introduction of new telescopes and instruments to the scientific astronomical community, and the rapid increase of sky surveys such as SDSS and RAVE, tremendous amount of spectral data is being acquired on a daily basis and with an increasing rate. Therefore, these challenges urged the need of efficient and automated techniques to handle and analyze this huge amount of information. Such automated procedures for classification of stars have been discussed recently using different codes and mathematical approaches. As an example, one can mention the methods used to analyze a spectral library described in Jofré et
al. (2014).
In this work, we present a dimensionality reduction technique called PCA, applied to a huge database of synthetic spectra. PCA searches in a high dimensional space for possible correlations, and finds an optimal basis for representing the data in a compact way.
Due to the high number of spectra in each synthetic database (200 000), and the high number of data points in each spectral domain (2 500. Same as observation, see section 2), such technique is crucial for inverting stellar parameters of observed targets from Gaia ESO survey. Using PCA, data can be represented in a fewer number of data points, allowing a fast “nearest neighbor(s)” search between the observed data set and the synthetic spectra. This study is an extension of Paletou et
al. (2015) where the H-R domain of application has been extrapolated to stars of types earlier than F, and the training database used in this work is a set of synthetic spectra.
2 Observation
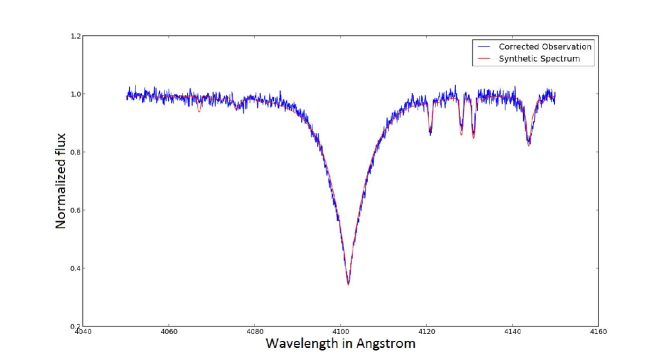
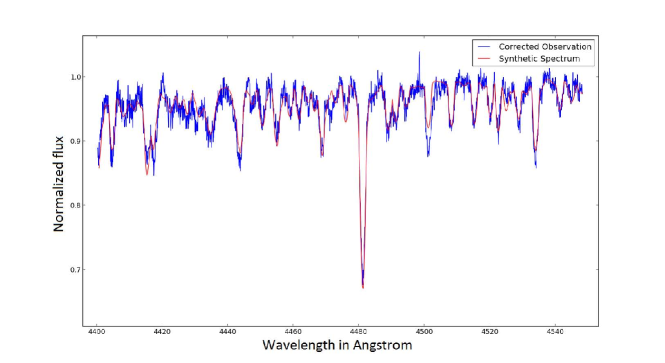
The procedure is applied to more than 800 stars, members of the open clusters NGC3293, NGC6705, and Trumpler14. The observations are part of the GAIA ESO public survey and consist of 2 spectral ranges, one samples the Hδ line region [4030-4200]Åand the second samples the [4400-4550]Å(HR5) region. These spectra were taken using GIRAFFE/FLAMES spectrograph at a resolution R 25 000, and reduced by the GES.
3 Spectral range selection
Balmer lines, due to the broadening caused by the Stark’s effect, are excellent indicators of effective temperature and surface gravity (Gray 2005). The reason behind studying Hδ in particular is because this line is formed in deep enough atmospheric layers where LTE can still be considered as a reasonable assumption. Moreover, the HR5 region was chosen since metallic lines (namely Fe ii, Mg ii, Ti ii, …) are potentially good indicators of rotational velocity and metallicity.
4 Synthetic Spetra
LTE model atmospheres were calculated using ATLAS9 code (Kurucz 1992) and were used as input to the spectrum synthesis code SYNSPEC48 (Hubeny & Lanz 1992) in order to compute a large grid of synthetic line profiles, over the same spectral regions as the observations. Spectra were calculated for Teff between 5 000 and 15 000 K, gravities between 2.0 and 5.0 cgs, rotational velocities between 0 and 200 , and metalicities between -0.6 and 0.4 dex (only for the HR5 region, whereas a solar [Fe/H] was assumed for the region), all at a microturbulence of 2 and at a resolution of 25 000.
5 Procedure
The central idea of principal component analysis is to reduce the dimensionality of a data set in which there are a large number of interrelated variables, while retaining as much as possible of the variation present in the data set (Jolliffe 1986). PCA searches for basis vectors that represent most of the variance in a given database. These vectors () are in fact the eigenvectors of the variance-covariance matrix (1) of the synthetic data set S.
| (1) |
Where being the mean spectrum over all the database.
Once the basis is obtained (adopted a set of 12 vectors, i.e ), the synthetic spectra and each observation (O) are projected unto this basis to obtain the projected coefficients (2 & 3)
| (2) |
| (3) |
Then, a standard chi-squared (4) is performed in this low dimensional space in order to achieve a fast inversion of stellar parameters of the observed targets. The parameters of the synthetic spectrum having the minimum d will be considered as the observation fundamental parameters.
| (4) |
The observation spectra were radial velocity corrected, and those with low signal-to-noise ratio were filtered out. Upon starting the inversion process, the technique showed to be very sensitive to normalization of spectra, thus an iterative “re-”normalization procedure was performed according to Gazzano et al. (2010).
6 Results
In general, inversion based on this technique was performed over the selected stars, and the fundamental parameters of the targets were estimated. An example of the nearest neighbor search is given in figures 1 and 2. The parameters derived by PCA, along with the non-official parameters obtained by WG13 of GES are detailed in table 1.
| Derived | Given | |||||||
|---|---|---|---|---|---|---|---|---|
| Star | logg | [Fe/H] | logg | [Fe/H] | ||||
| (K) | (dex) | () | (dex) | (K) | (dex) | () | (dex) | |
| 10361733-5809031 | 14 400 | 3.6 | 45 | - | 14 775 | 3.84 | 44 | - |
| 10430337-5941536 | 9 200 | 4.6 | 70 | 0.4 | 8 633 | 3.5 | 75 | - |
With PCA, we will be contributing by determining stellar parameters to the next GES data release.
7 Conclusions and future work
PCA proved to be a fast and reliable inversion technique, with an ease to implement. An attempt to increase the size of the synthetic database is being performed in order to improve the accuracy in the parameters obtained. Moreover, the merging of two spectral ranges in a one data set is also considered as a future work.
Acknowledgements.
This work is based on observations collected with the FLAMES spectrograph at the VLT/UT2 telescope (Paranal Observatory, ESO, Chile), for the Gaia-ESO Large Public Survey, programme 188.B-3002.References
- Gazzano et al. (2010) Gazzano, J.-C., de Laverny, P., Deleuil, M., et al. 2010, A&A, 523, A91
- Gray (2005) Gray, D. F. 2005, “The Observation and Analysis of Stellar Photospheres”, 3rd Edition, UK: Cambridge University Press, 2005
- Hubeny & Lanz (1992) Hubeny, I., Lanz, T. 1992, A&A, 262, 501
- Jofré et al. (2014) Jofré, P., Heiter, U., Soubiran, C., et al. 2014, A&A, 564, A133
- Jolliffe (1986) Jolliffe, I. T. 1986, Springer Series in Statistics, Berlin: Springer, 1986,
- Kurucz (1992) Kurucz, R.L. 1992, Rev. Mexicana. Astron. Astrofis., 23, 45
- Paletou et al. (2015) Paletou, F., Böhm, T., Watson, V., & Trouilhet, J.-F. 2015, A&A, 573, A67