041 \symitalics 061
A Holistic Approach in Embedded System Development
Abstract
We present pState, a tool for developing “complex” embedded systems by integrating validation into the design process. The goal is to reduce validation time. To this end, qualitative and quantitative properties are specified in system models expressed as pCharts, an extended version of hierarchical state machines. These properties are specified in an intuitive way such that they can be written by engineers who are domain experts, without needing to be familiar with temporal logic. From the system model, executable code that preserves the verified properties is generated. The design is documented on the model and the documentation is passed as comments into the generated code. On the series of examples we illustrate how models and properties are specified using pState.
1 Introduction
The main traditional software validation techniques are peer review, testing, and performance measurement. Peer review is the process of static code examination by the author and colleagues. The goal is to detect and identify problems and to confirm main design decisions. Quantitative studies indicate that peer review is an effective technique which catches on average about 60% of defects [4]. Software testing and performance measurement examine code by executing it on a specified target in a particular environment. For each specified input, a test is performed. Correctness is determined based on program execution paths. It is often not possible to test all execution paths, especially in concurrent systems, so in practice correctness is determined on a subset of all possible executable paths. This implies that the correctness is relative to the examined paths. The correctness of software systems in the conventional software development process, shown in Figure 1, is relative to the specification and to consequently executed test cases. This process can discover errors but cannot guarantee correctness: an error may still exist in the product. The other problem is that errors are discovered late, when the product is already built. The sooner errors are found, the lower the cost of repairing them is.
To overcome these two problems in the development of embedded systems, a technique based on model checking is proposed. From a model that describes the system behaviour in a mathematically precise manner, a simplified model suitable for model checking is generated. Model checking allows to explore all possible system states in a systematic manner. In our approach, the system model is described by pCharts [22], a version of hierarchical state machines extended with probabilistic transitions, timed transitions, stochastic timing, and costs/rewards. Using pCharts we can specify both a system and its environment. Qualitative and quantitative properties are expressed directly in the model. Verification of qualitative properties returns true or false. Verification of quantitative property returns a numerical value. In Figure 2, the qualitative property states that whenever the system is in the state it should not be in the state . The quantitative query returns the maximum value of power spent by the time a state is reached.
In embedded systems, the impact of the working environment and the reaction to external stimuli determine the correctness of a system. In order to verify those properties, a model of the environment has to be created together with a model of the system. If errors are detected by model checking, either the system model or the environment model need to be modified. Once the properties are verified from the system model executable code that preserves those properties is generated. The same formalism, pCharts is used to describe the system model and the environment (unlike in classical discrete event systems). Code is generated according to the algorithm presented in [22], and tested on a number of case studies. Although it is not formally proved to be correct, we believe that generated code is trustworthy.
The main strength of the model checking approach is the automatic verification based on sound mathematical foundations. The main weakness is related to scalability, a.k.a. the state-space-explosion problem, and the fact that it verifies a system model, not the system itself. Because of that we can say that any model checking technique is only as good as the model of the system itself. Model checking technique enjoys a rapidly increasing interest by industry [4] because of its potential to make the engineering process more efficient.
2 Related Work
Probabilistic transitions can be used to express randomized algorithms or quantify the uncertainty of the environment. Probabilistic descriptions are useful for analyzing quality of service, response time, unreliable environments, and fault-tolerant systems. Quantitative queries can also be attached to any state in a state hierarchy. In general, quantitative queries are specified in the temporal logic PCTL [4] with operators for probabilities and costs/rewards. Analysis in pState proceeds by generating from the visual specification a Markov Decision Process (MDP) model and quantitative queries that are passed to a probabilistic model checker. An MDP model of PRISM [14] corresponds to a probabilistic timed automaton of [25].
Modelling tools like RHAPSODY, Stateflow with Simulink, Papyrus, Yakindu, SCADE Suite, and IAR visualSTATE do not support invariants, probabilistic transitions, stochastic transitions and direct cost/rewards specification. In [29] translation of extended UML diagrams [11] to PRISM is proposed, but parallel composed system is passed as a system of multiple models to PRISM. This process does not allow nested concurrency representation, only top level concurrency. On the other hand pState translates arbitrarily nested parallel compositions and creates one model. Advantage is that in addition to the model checker input code, it is possible to generate executable code, so pState is not only a PRISM front-end.
We use PRISM for two reasons: (1) pChart’s normal form of transitions correspond to the form of the input commands to PRISM, and (2) PRISM shows better overall performance compared to other probabilistic model checking tools like ETMCC, MRMC, YMER, VESTA [24]. PRISM uses efficient algorithms and data structures based on binary decision diagrams that allow compact representation and increase tool scalability [14].
Model checking tools based on exhaustive checking are feasible only for systems with up to - states. To address this problem, statistical model checking (SMC) which solves the verification problem for stochastic systems in a less precise but still rigorous and efficient way is introduced [6]. UPPAAL tool with SMC extension is capable to verify systems with more than states, so it can verify bigger systems than pState but in less precise manner.
The original motivation for this work came from the design of RFID tags for postal systems [20]. The use of PRISM for wireless network protocols is further studied in [8], where the example in Figure 3 is specified by a simple state diagram. Overall our thrust is to have a tool founded in solid theory and is intuitive enough to be used by engineers for analyzing design tradeoffs. An overview of pState with examples of generated code is in [21]. In this work we focus on the property specification and generation of the documentation.111pState can be downloaded at http://pstate.mcmaster.ca
Requirements-oriented Semantics.
Hierarchical state machines, pCharts, are meant primarily for the design of embedded synchronous reactive systems. Transitions in the top level states have priority over transitions in lower level states. Reset always bring the system to its initial state, and there is no history transitions. We can think of a pCharts as a compact representation of a flat-state machine. On the response to an external event, a pCharts may broadcast additional events. The execution step completes as soon as the chain of reactions comes to a halt [18]. With embedded systems in mind, pCharts follow an event-centric interpretation, in which events are executable procedures, implying that their execution is fast enough and no queuing of events is needed [27]. That is, if an event leads to broadcasting of another event, the second one is executed like a called procedure, rather than queued. This is in contrast to the state-centric interpretation in UML and Statemate [10], in which events are data in queues. These interpretations are called requirements-oriented and implementation-oriented semantics in [7], with our event-centric interpretation being the requirements-oriented semantics.
A number of quantitative extensions of statecharts, similar to pCharts, have been proposed, all based on UML state machines [12, 11, 17, 29]. These follow a state-centric interpretation where the state of a chart is given by its configuration (the “states” of the current state), a set of events, and the valuation of the variables (e.g. p. 67 in [11]). In pCharts, the state consists only of the configuration and the valuation of the variables, thus reducing the state space and facilitating model checking. UML state machines events have a single receiving object, whereas pCharts follow the original Statemate interpretation and always broadcast events to all concurrent states.
The event-centric interpretation allows pCharts to be represented through probabilistic guarded commands [19]. The translation is simple and intuitive enough to serve as the definition of pCharts. The definition supports state hierarchies with inter-level transitions and concurrent states with broadcasting in arbitrary combinations. The event-centric translation of statecharts without probabilities in [28], generates nested guarded commands as supported in the B Method [2, 27]. However, for the purpose of probabilistic model checking, a flat structure of guarded commands is needed. A probabilistic guarded command is in normal form if it is a nondeterministic choice among a set of guarded statements,
where each is a Boolean expression, each is a probabilistic choice among multiple assignment statements with probability :
Thus pState translates pCharts to probabilistic guarded commands in normal form. A variation is used to translate sub-charts without probabilistic choice to nested control structures, which can be executed more efficiently than flat guarded commands. From an intermediate representation of nested control structures C code generation is currently supported. We extend the hierarchical chart structure to allow the specification of a cost/reward of being in a state and of taking a transition. We are not aware that costs in this form have been considered for hierarchical charts. In pState the cost/reward specifications are first validated and then translated as annotations of the generated probabilistic guarded commands. A theory for costs/rewards in that form is given by priced probabilistic automata; a recent overview with model checking procedures is given in [23].
3 Property Specification
The example of the wireless sender and mobile receiver in Figure 3 illustrates the basic elements of pCharts. The setup is typical for networks of sensors, in particular RFID tags. The state System is an AND (concurrent) state with children Sender and Receiver, separated by a dashed line. Both Sender and Receiver are XOR states with Basic states as children. The sender is initially in the state Sleep and the receiver in Listening. The sender exits sleep mode on a wake-up event. For active RFID tags 222http://www.lyngsoesystems.com/Canada/Tags.asp, that event can be created either by a low frequency electromagnetic field, by a motion sensor, or by an internal timer. When this event is generated by a motion sensor or an internal timer, the sender always goes into transmission mode. On the other hand, an electromagnetic field can be created by system antennas (good field), or by other sources like power lines, monitors, cell phones, or electrical machines (parasite field). A good field has a unique identification number. If the sender recognizes the field number, it goes into transmission mode; otherwise it goes back into sleep mode. This is expressed by a probabilistic transition that with probability goes to state Sending and with probability goes back to state Sleeping. A sent message may reach the receiver or may get lost. This is expressed by another probabilistic transition that with probability broadcasts to the receiver, which causes the receiver to go from Listening to Off. The receiver then shuts off to save power, while the sender (with unidirectional transmission) keeps retransmitting the message.
We wish to analyze the following properties of the system:
-
•
Is the system correct in the sense that the receiver is attentive when needed? We express this by attaching the invariant to the state ; pState reports .
-
•
What is the minimal probability that the receiver shuts off? We express this by attaching the query to state ; pState reports .
-
•
What is the maximal number of expected message transitions of the sender until the receiver shuts off? For this, we attach the cost of to the sending transition and ask what the maximal expected value of upon entering state is by attaching the query to ; pState reports .
-
•
What is the maximal expected energy consumption until the message reaches the receiver? For this, we attach the cost of to state and to . Now we can ask what the maximal expected value of is in state by attaching the query to ; pState reports .
-
•
Is the probability that the receiver shuts off at least ? We express this by attaching the query to ; pState reports .
In general, state invariants are safety conditions that can be attached to any state in a state hierarchy and specify what has to hold in that state. Every incoming transition to the state must ensure that the state invariant holds, and every outgoing transition can assume that the invariant holds. State invariants can express safety of an embedded system or consistency of a software system. The accumulated invariant of a state consists of a conjunction of invariants “inherited” from ancestor states and a combination of invariants of descendant states. For example, the accumulated invariant of System is the invariant attached to System and the invariant of Sleeping or Sending and the invariant of Listening or Off. We have implemented accumulated invariants in pCharts following the definition and algorithm of [28]. When using a model checker for invariant verification, we interpret invariants as temporal always-conditions rather than as inductive invariants as in [26]. For this example pState generates the code in Figure 4.
Queries in PRISM are specified separately from the PRISM model. In this section, state refers to states of PRISM models, i.e. configurations of pCharts and path is a sequence of PRISM states. The Boolean-valued query , where is , is true in a state if the probability that is satisfied by the paths from that state is . Among the path properties that can be specified is the always property, written . The invariant of state is translated by pState as:
The real-valued queries and return the minimal and maximal probability, which may differ due to nondeterminism. The query for the minimal probability that the receiver eventually shuts off uses the eventually operator :
The total reward for a path is the sum of the state rewards plus transition rewards along the path. The Boolean-valued query , evaluates to true in a state if the expected reward associated with is when starting from that state. The real-valued queries and return the minimal and maximal reward, which may again differ due to nondeterminism. For we consider only the reachability reward , which is the reward accumulated along a path until a state satisfying is reached. The maximum expected number of transmission attempts of the sender until a message reaches the receiver and the receiver shuts off is expressed as follows; as several reward structures can be specified, reward formulae have to refer to the structure, here :
For the maximal energy pState generates:
The maximal expected energy is calculated by PRISM as . If the transitions were reliable, the result would be . Such analysis can be used to evaluate tradeoffs. For example, if we assume that spending 10% more energy for sending increases the probability of successful transmission to , we obtain that 1.02 transmission attempts are needed. This gives an appealing alternative to the practice of basing such evaluations exclusively on lab experiments.
3.1 The Logic PCTL in pCharts
pCharts allows both model design and property specification in the same hierarchical state structure, while the specification of properties in the PRISM model is done separately from the model itself. To express a query decsribing minimal probability to reach some state, we need to write formula
in PRISM. In pCharts, we do not need to write full formula. By writing only ”?P.min” and attaching it to the state of interest we can specify the same property. The tool pState creates a PRISM formula by automatically taking into account the sates hierarchy. In a similar way it is possible to specify a reward property by ”?tran.max” which is translated into the reward formula
Properties are specified according to the following grammar:
Another way to specify the property is to write the formula in the special formula text-box. The properties are written in PCTL [3, 14], a probabilistic extension of temporal logic CTL [5]. The logic for MDP and PTA properties specification is similar, the difference is that PTA property includes clock constraints. PTA has two model checking engines digital clocks [16] and stochastic games [13]. In the digital clock engine, clock variables are allowed in operator expressions and temporal logic property types and can be used. However, this engine does not support time-bounded reachability properties, as the one used in the section 6 example.
3.2 Floating Formula Example
For the system of seven states and five transitions in Fig. 5, we want to find out the minimal probability to reach a particular state. The initial state is and probabilistic transition moves the system to with 30% probability and to with 70% probability. This is indicated by two alternatives and going from the pseudo-state to the states and . To find out the minimal probability of reaching state , we need to place the pCharts formula in the state . pState creates the PRISM formula
which returns 0.03 as the verification result, as can be verified manually by multiplying the probabilities and .
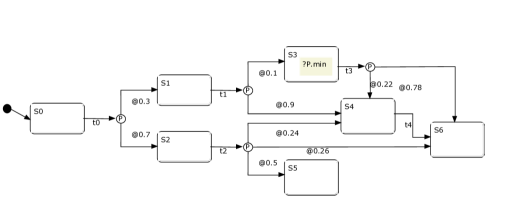
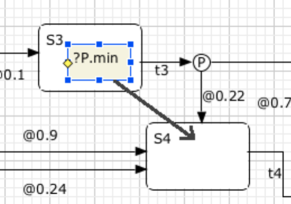
To determine the probability of entering , which can be reached on three different paths , , and , it is sufficient to move the formula from state to state , as shown in Figure 6.
Verification of
returns that minimal probability to reach state is 0.4446. Moving formula box to state , pState creates formula
which as result returns 0.6499, that is actually 0.65. The error comes from floating point rounding of the model checker. This would be difficult to calculate manually since there are five different paths to reach this state.
In this example we calculated probability, but since there are no nondeterministic transitions in the system, the calculation of the probability by would return the same result.
4 Documentation in pCharts
The design can be documented using text boxes in the model itself. The comments are inserted in the generated code. There are three types of comments general comments, state comments and transition comments. The main reason for including the documentation is to justify the design. Passing the comments to the generated code allows for forward and backward traceability, which would be necessary for the certification of the generated code.
Each comment can be connected to either a state or a transition by dashed comment line. If it is not connected, it is associated to the state surrounding the comment box. General comments are placed outside any states and are technically associated to the root state.
State Documentation
As the generated code is event centric, i.e. states become variables and events become procedures, the comments about a state are inserted in the generated code where the state is declared.
Transition Documentation
A transition comment is inserted into generated code of transition event. The comment is connected to the transition by Comment Connector figure. Timed transitions do not have an associated event name, but a name is generated for the corresponding procedure and the comment is associated to that procedure in the same way as for untimed events.
Example
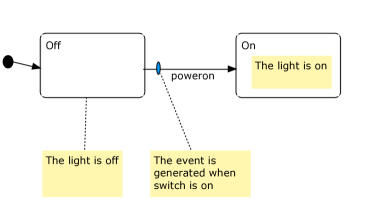
In Fig. 7, a simple transition from state to state on the event is shown. In the grey text-box connected by a dashed line to the state , the description of the state is given. Another option to describe the state is to place description text-box in the state, as it is shown for . Code generated for this example is shown in Figure 8.
5 Case Study - RFID Tag
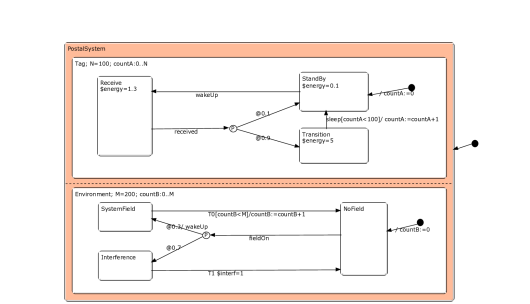
In the pCharts model of Fig. 9 we analyze properties of an RFID tag used in postal systems. The model has two concurrent states, Tag and Environment. In the Tag state the basic operation of the RFID device is represented. Initially, a tag is in StandBy and on wakeUp goes into Receive. This event is broadcasted by Environment. The environment is initially in NoField and on event fieldOn it goes to SystemField or to Interference. Based on testing we estimate that approximately 30% of the time the tag will be excited by a system field and in 70% of time it will be excited by some unwanted field which may come from some other sources of low frequency like computers, TV, some machinery, etc. On the transition to SystemField, the event wakeUp is generated. After time T0 it goes back to NoField and increments counterB, which counts valid excitations. On the event T1, environment goes from Interference to NoField state. We associate the interference cost to this transition.
On the tag side, in Receive, we read the system field ID. If the field ID is recognized, the tag goes into the Transition, and if not, it goes back into StandBy. We estimate that a tag can recognize the field ID 80% of the time. Once it finishes the messages transition, the tag goes back into Sleep and increases successful transmissions counter counterA. In each state of Tag, we specify the costs of being in that state. This is used to evaluate power consumption and for optimization of the system.
By selecting View Verify the MDP model of the pCharts is built and passed to the PRISM model checker together with properties. In a separate window the result of property verification is displayed. The model built by PRISM has 136955 states and 318657 transitions. In this example we verify three properties. Those formulas contain conditions of the counters which have to be satisfied and are not specified in the states, but in the formula text box. The the formula
| (1) |
we can calculate the minimum expected energy on ten wakeUp events; the result is: 60.06. The formula
calculates the maximum probability of having two successful transmissions in less than five excitations. The result is 0.99. The formula
calculates the minimum expected number of interferences in ten good excitations. The result is: 23.33.
If we change the probabilities of transitions, or energy consumption we can automatically calculate new values. For instance if the hardware design is improved by the selection of better components such that the energy in Receive is , formula 1 will result in 59.06; that is by decreasing state consumption for 8.7% minimum expected energy on ten wakeUp events is reduced by 2.7%. If costs of new components and labour to alternate receiver is less than saving in energy, that alternation can be done.
6 Case Study - Hubble Telescope
This example is based on the model of failure of the Hubble telescope as presented in [24]. Six gyroscopes are used for navigation. The telescope is designed such that it can fully operate with only three gyroscopes. When less than three gyroscopes are operational, the telescope goes into sleep mode and waits for repair. As long as at least one gyroscope works, the telescope is operational, otherwise it will crash. The goal of modelling is to find out the probability that the system will operate without failure for a given period of time.
We build a formal probabilistic model of the system as a pCharts model with 13 states. In the model we assume that each gyroscope has an average lifetime of 10 years. Since six gyroscopes are operational, and any one can fail, we can expect that the outgoing rate is , which means that there is a 60% of chance that at least one gyroscope will fail in 365 days. That is modelled as a probabilistic timed transition from state SixG to state FiveG. If five gyroscopes are correct, the probability to have a failure in one year is 0.5, which is modelled as probabilistic transition from state to state . When only two gyroscopes are active, the telescope needs to go into sleep mode. The probability that the telescope will go into sleep mode and the rescue operation starts in three days is 99.8%. In that case, in approximately 60 days, with probability 0.968% all failed gyroscopes will be fixed and the system goes into the initial state. If the rescue operation fails, the system goes into and consecutively into state. This means only one gyroscope is functional, and the telescope is in sleep mode. The rescue operation is taken within two months (60 days) with 98.4% chance of success. While in state , if the system fails to go to state, it will continue to work with two gyroscopes until one fails in approximately 730 days. Then, it tries to go from into and to start the rescue operation. The telescope can end up in the state if it can not go into sleep mode, or if the rescue operation is not successful.
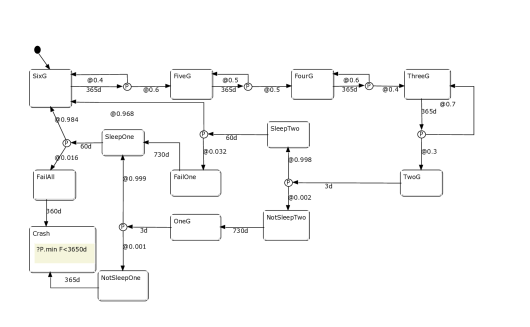
From the model, by formula
we determine that the crash probability in 10 years (3650 days) is 0.01226%, or the probability that the Hubble telescope will be operational in 10 years is 99.98774%.
7 Conclusion
This paper reports on the formalism of pCharts and its associated tool pState. The focus is on properties specification directly on the model in an intuitive way. We believe this technique will make the model checking approach more convenient for developers who are domain experts, but not software experts. The design can be documented and the documentation is passed to the generated code to allow traceability, e.g. for the certification of the generated code. The goal is to have a seamless and automated approach from modelling and analysis to code generation that can be used to evaluate design alternatives and generate trustworthy code. Future work will include formal proof of correctness of the generated code.
Our approach is holistic, means that qualitative properties, notably structural well-formedness, correctness with respect to invariants, and timing guarantees, can be verified together with quantitative properties, notably resource consumption, reliability, and performance. These properties cannot be analyzed by considering exclusively the computerized part; rather, its environment has to be considered to certain extent.
References
- [1]
- [2] Jean-Raymond Abrial (1996): The B Book: Assigning Programs to Meanings. Cambridge University Press, 10.1017/CBO9780511624162.
- [3] Adnan Aziz, Vigyan Singhal, Felice Balarin, RobertK. Brayton & AlbertoL. Sangiovanni-Vincentelli (1995): It usually works: The temporal logic of stochastic systems. In Pierre Wolper, editor: Computer Aided Verification, Lecture Notes in Computer Science 939, Springer Berlin Heidelberg, pp. 155–165, 10.1007/3-540-60045-0 48.
- [4] C. Baier & J. P. Katoen (2008): Principles of Model Checking. MIT Press, New York.
- [5] Edmund M. Clarke & E.Allen Emerson (1982): Design and synthesis of synchronization skeletons using branching time temporal logic. In Dexter Kozen, editor: Logics of Programs, Lecture Notes in Computer Science 131, Springer Berlin Heidelberg, pp. 52–71, 10.1007/BFb0025774.
- [6] Edmund M. Clarke & Paolo Zuliani (2011): Statistical Model Checking for Cyber-Physical Systems. In Tevfik Bultan & Pao-Ann Hsiung, editors: Automated Technology for Verification and Analysis, Lecture Notes in Computer Science 6996, Springer Berlin Heidelberg, pp. 1–12, 10.1007/978-3-642-24372-1 1.
- [7] Rik Eshuis, David N. Jansen & Roel Wieringa (2002): Requirements-Level Semantics and Model Checking of Object-Oriented Statecharts. Requirements Engineering V7(4), pp. 243–263, 10.1007/s007660200019.
- [8] Matthias Fruth (2011): Formal Methods for the Analysis of Wireless Network Protocols. Ph.D. thesis, University of Oxford.
- [9] David Harel & Hillel Kugler (2004): The Rhapsody Semantics of Statecharts (or, On the Executable Core of the UML). In Hartmut Ehrig, Werner Damm, Jörg Desel, Martin Große-Rhode, Wolfgang Reif, Eckehard Schnieder & Engelbert Westkämper, editors: Integration of Software Specification Techniques for Applications in Engineering, Lecture Notes in Computer Science 3147, Springer Berlin Heidelberg, pp. 325–354, 10.1007/978-3-540-27863-4 19.
- [10] David Harel & Amnon Naamad (1996): The STATEMATE Semantics of Statecharts. ACM Trans. Softw. Eng. Methodol. 5(4), pp. 293–333, 10.1145/235321.235322.
- [11] D. N. Jansen (2003): Extensions of Statecharts with Probability, Time, and Stochastic Timing. Ph.D. thesis, University of Twente, Enschede. Available at http://doc.utwente.nl/58230/.
- [12] D.N. Jansen, H. Hermanns & J.P. Katoen (2002): A probabilistic extension of UML statecharts: Specification and Verification. In W. Damm & E.-R. Olderog, editors: Formal Techniques in Real-Time and Fault-Tolerant Systems, Lecture Notes in Computer Science 2469, Springer, Oldenburg, Germany, pp. 355–374, 10.1007/3-540-45739-9.
- [13] Marta Kwiatkowska, Gethin Norman & David Parker (2009): Stochastic Games for Verification of Probabilistic Timed Automata. In: Proceedings of the 7th International Conference on Formal Modeling and Analysis of Timed Systems, FORMATS ’09, Springer-Verlag, Berlin, Heidelberg, pp. 212–227, 10.1007/978-3-642-04368-0 17.
- [14] Marta Kwiatkowska, Gethin Norman & David Parker (2011): PRISM 4.0: Verification of Probabilistic Real-Time Systems. In Ganesh Gopalakrishnan & Shaz Qadeer, editors: Computer Aided Verification, Lecture Notes in Computer Science 6806, Springer Berlin Heidelberg, pp. 585–591, 10.1007/978-3-642-22110-1 47.
- [15] Marta Kwiatkowska, Gethin Norman, Jeremy Sproston & Fuzhi Wang (2007): Symbolic model checking for probabilistic timed automata. Information and Computation 205(7), pp. 1027 – 1077, 10.1016/j.ic.2007.01.004. Available at http://www.sciencedirect.com/science/article/pii/S08905401070%00077.
- [16] Marta Z. Kwiatkowska, Gethin Norman, David Parker & Jeremy Sproston (2006): Performance analysis of probabilistic timed automata using digital clocks. Formal Methods in System Design 29(1), pp. 33–78, 10.1007/s10703-006-0005-2.
- [17] Florian Leitner-Fischer & Stefan Leue (2011): QuantUM: Quantitative Safety Analysis of UML Models. In Mieke Massink & Gethin Norman, editors: Proceedings Ninth Workshop on Quantitative Aspects of Programming Languages, Saarbrücken, Germany, April 1-3, 2011, Electronic Proceedings in Theoretical Computer Science 57, Open Publishing Association, pp. 16–30, 10.4204/EPTCS.57.2.
- [18] Gerald Löttgen & Michael Mendler (2000): Fully-Abstract Statecharts Semantics via Intuitionistic Kripke Models. In: ICALP, Lecture Notes in Computer Science 1853, Springer, pp. 163–174, 10.1007/3-540-45022-X 14. Available at http://dblp.uni-trier.de/db/conf/icalp/icalp2000.html#Luttgen%M00.
- [19] Carroll Morgan, Annabelle McIver & Karen Seidel (1996): Probabilistic Predicate Transformers. ACM Trans. Program. Lang. Syst. 18(3), pp. 325–353, 10.1145/229542.229547. Available at http://doi.acm.org.libaccess.lib.mcmaster.ca/10.1145/229542.2%29547.
- [20] Bojan Nokovic & Emil Sekerinski (2010): Analysis of Interrogator-tag Communication Protocols. SQRL Report 60, McMaster University.
- [21] Bojan Nokovic & Emil Sekerinski (2013): pState: A probabilistic statecharts translator. In: Embedded Computing (MECO), 2013 2nd Mediterranean Conference on, pp. 29–32, 10.1109/MECO.2013.6601339.
- [22] Bojan Nokovic & Emil Sekerinski (2014): Verification and Code Generation for Timed Transitions in pCharts. In: Proceedings of the 2014 International C* Conference on Computer Science #38; Software Engineering, C3S2E ’14, ACM, New York, NY, USA, pp. 3:1–3:10, 10.1145/2641483.2641522.
- [23] G. Norman, D. Parker & J. Sproston (2012): Model checking for probabilistic timed automata. Formal Methods in System Design, pp. 1–27, 10.1007/s10703-012-0177-x.
- [24] H.A. Oldenkamp (2007): Probabilistic model checking : a comparison of tools. Master’s thesis, University of Twente. Available at http://essay.utwente.nl/591/.
- [25] Roberto Segala (1995): Modelling and Verification of Randomized Distributed Real Time Systems. Ph.D. thesis, Technical Report MIT/LCS/TR-676, Massachusetts Institute of Technology. Available at http://profs.sci.univr.it/~segala/www/phd.html.
- [26] E. Sekerinski (2008): Verifying Statecharts with State Invariants. In: Proceedings of the 13th IEEE International Conference on on Engineering of Complex Computer Systems, IEEE Computer Society, Washington, DC, USA, pp. 7–14, 10.1109/ICECCS.2008.40.
- [27] E. Sekerinski & R. Zurob (2001): iState: A Statechart Translator. In M. Gogolla and C. Kobryn, editors UML 2001 - The Unified Modeling Language, 4th International Conference, Lecture Notes in Computer Science 2185, pages 376-390, Toronto, Canada, 10.1007/3-540-45441-1 28.
- [28] Emil Sekerinski (2009): Design Verification with State Invariants. In Kevin Lano, editor: UML 2 Semantics and Applications, John Wiley & Sons, pp. 317–347, 10.1002/9780470522622.
- [29] Yefei Zhao, Zongyuan Yang, Jinkui Xie & Qiang Liu (2010): Quantitative Analysis of System Based on Extended UML State Diagrams and Probabilistic Model Checking. JSW 5(7), pp. 793–800, 10.4304/jsw.5.7.793-800.