A New Ranking Scheme for the Institutional Scientific Performance
Abstract
We propose a new performance indicator to evaluate the productivity of research institutions by their disseminated scientific papers. The new quality measure includes two principle components: the normalized impact factor of the journal in which paper was published, and the number of citations received per year since it was published. In both components, the scientific impacts are weighted by the contribution of authors from the evaluated institution. As a whole, our new metric, namely, the institutional performance score takes into account both journal based impact and articles specific impacts. We apply this new scheme to evaluate research output performance of Turkish institutions specialized in astronomy and astrophysics in the period of 1998-2012. We discuss the implications of the new metric, and emphasize the benefits of it along with comparison to other proposed institutional performance indicators.
keywords:
Astronomy & Astrophysics; Research performance; Bibliometrics; Statistical analysis, , , and
1 Introduction
A natural extension of evaluating the research performance of individual scientists is to evaluate the research output productivity of research institutes. This is, however, a more challenging task than assessing the output records of an individual scientist for various reasons. First of all, the number of scientists affiliated varies remarkably between institutes. This is easily handled in the evaluation of the research performance of an institute by normalizing the research outputs with the number of affiliated researchers. Another important factor is the impact of the research output. At this front, the h-index (Hirsch, 2005) and some of its variants (Braun et al., 2006; Egghe, 2006; Van Raan, 2006; Jin et al., 2007; Guan & Gao, 2008; Vanclay, 2008; Schreiber et al., 2011) are usually employed.
Along with the wider use of advanced technology and methodologies in scientific research, the nature of research teams is also evolving. Unlike a few decades ago, scientific investigations performed by teams of about 10 scientists or more are not uncommon. The size of research teams in some cases can be as large as hundreds, such as, the Large Hadron Collider collaboration at CERN111http://lhcb-public.web.cern.ch/lhcb-public/, which includes scientists affiliated with many different institutions. In the dissemination of these scientific efforts (most commonly in the form of research articles), the contribution of each team member (that is, co-author) is not usually reported explicitly. Therefore, it would not be a fair evaluation of the respective institutions when these large collaboration articles are assessed without author contributions are taken into considerations. To account for authorship credit, various ways were proposed, such as, the harmonic author credit (Hagen, 2008) and the ith author credit (Liu & Fang, 2012), both of which credits the author based on the rank in the author list, or the fractional author credit (Liu & Fang, 2012) which credits all authors equally.
There have been numerous extensive studies for the scientific productivity evaluations of research institutions. Vieira & Gomes (2010) investigated research impact for scientific institutions using an indicator that includes the paper productivity as well as their citation performance. Batista et al. (2006) proposed a measure that is interrelated to the h-index: They introduced which is the ratio of the square of h-index of the institutional papers to the number of authors of these articles. Abramo et al. (2013) derived an indicator which is obtained by normalizing the institutional h-index with the number of full time research personnel of the institute. Franceschini & Maisano (2010) suggested a structured technique to evaluate scientific output of research groups, in which they employ h-index as the key ingredient. Recently, Franceschini et al. (2013) proposed the success index for evaluating research institutions which primarily takes into account institutional papers with greater citation records. Boell & Wilson (2010) proposed a ranking scheme based on the square of the journal impact factors. Note the fact that these performance indicators do not completely involve the effects of all the above-mentioned factors, in particular the author contribution to the impact of scientific output.
Here, we propose a new evaluation scheme for the institutional research productivity, that takes into account the scientific impact of the output as well as the extend of the scientific contribution of its researchers. We introduce this new institutional performance score scheme in the next section. Then, we apply our proposed performance indicator method to the research outputs of institutions performing research in astronomy and astrophysics in Turkey, based on their article productivity between 1998 and 2012. Finally, we discuss the implications of our results, and compare the results obtained with this new scheme and through other techniques in Section 4.
2 Material and methods
In order to obtain the complete dataset for astronomy and astrophysics research papers, we used Thomson Reuters Web of Knowledge222http://apps.webofknowledge.com, which includes 12 different databases of single and interdisciplinary citation indices. This database contains the list of all journals covered in Science Citation Index (SCI) and provides the citation counts without self citations for individual papers since 1980 to present day. In the database, we have identified 1702 publications in “Astronomy and Astrophysics” whose authors or co-authors were based in Turkey and published in 56 SCI journals in the period from 1980 to 2012. After excluding papers with overlapping fields, such as physics particles fields, geosciences multidisciplinary, meteorology atmospheric sciences, engineering aerospace, geochemistry geophysics, mathematics interdisciplinary applications and remote sensing, the total number of publications was reduced to 1062. According to document types, these 1062 papers were divided into seven groups: articles (976), proceedings (37), letters (16), reviews (15), errata (10), research notes (7) and editorial notes (1). It was also found that 37 of these studies were presented at meetings before they were published, 10 of them were corrected then re-published. Due to these reasons, we only considered the articles, letters, reviews, and editorial notes, which resulted in sample size of 1015 publications. In Fig. 1, we present the distribution of these 1015 publications over time. Note that 782 of these papers had the leading author from Turkish institutions, while in 233 papers; the leading authors were from international institutions.
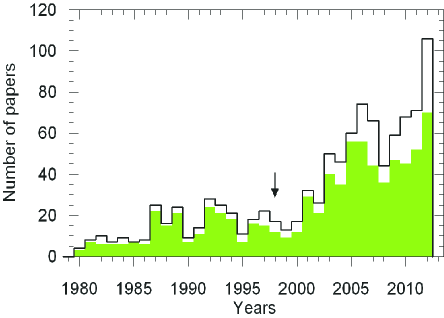
It can be seen from Fig. 1 that there is a prominent increment in number of publications that were published in SCI journals starting from about 2000. Bilir et al. (2013) suggested that this increase in scientific productivity was motivated by the application of the improved academic assignment criteria in 1998, common use of Internet, and larger scale research opportunities provided by scientific research units of the universities. Therefore, in our study here we analyzed research papers that published between the years of 1998 and the end of 2012. We should note the important fact that the number of citations for each publication was determined as of 31 August 2013. This way, even the latest publications had about one year of visibility, since papers are usually published in SCI journals can take a couple of months before they are listed on Web of Knowledge.
Astronomy and astrophysics studies in Turkey are currently conducted in three main departments such as Astronomy and Space Sciences in Ankara, Ege, Erciyes and İstanbul universities; Astronomy and Space Technologies in Akdeniz, Çanakkale Onsekiz Mart (COMU) universities and Physics in Boğaziçi (BOUN), Çukurova, İstanbul Kültür, Middle East Technical (METU) and Sabancı universities.
Note that astrophysical research has also been conducted at various sub divisions of the Turkish Scientific and Technological Research Council (TÜBİTAK)333www.tubitak.gov.tr. We have identified 749 papers that researchers based in Turkey have been leading authors or co-authors and have been published in SCI journals between 1998 and 2012. Researchers from 48 institutions contributed to these 749 publications. When we consider the papers with leading authors based in Turkey, the number of papers published within the same time frame reduces to 564, which were contributed by researchers from 37 institutions inside Turkey.
3 Theory/calculation
As we have outlined in the first section, there is currently no quality indicator to rank scientific productivity of research institutions that takes into account scientific impact and author contribution. We introduce below our article productivity based new ranking scheme, which we call the institutional performance score (IPS), which consists of two additive terms: (i) impact factor () of journal for the year that the article has been published multiplied with the contribution of each co-author () to the institutional article, and (ii) the ratio of the number of citations received () to the number of years passed since the paper has been published (), and also multiplied by .
| (1) |
where is the total number of institutional articles published. In this scheme, the parameter is simply the ratio of the number of co-authors from a particular institute to the total number of co-authors. For example, if an article is published by five researchers; three of them are from Institute A and two of them from Institute B, then the author contribution of this paper to Institute A is 3/5 and that to Institute B is 2/5. The latter term represents the scientific impact of an article, which diminishes over time if it is not cited at a steady pace. Effectively, this indicator combines author contribution added impact gained by the journal in which a particular article was published, and by the article itself.
4 Results
We apply our proposed institutional performance indicator to the Turkish institutions performing research in astronomy and astrophysics, and disseminate their outputs in the form of scientific articles. Note that the impact factor of the journal in the year that a paper is published is one of the essential inputs for our new performance indicator definition. For this purpose, the impact factors for the nine mostly preferred SCI journals between 1998 and 2012 were compiled and presented in Table 1. In the bottom row of Table 1, we provide the 15-year averages of annual impact factors for each of these nine journals.
| Years | MNRAS | A&A | ApJ | NewA | IJMPD | AN | Ap&SS | PASA | AJ |
|---|---|---|---|---|---|---|---|---|---|
| 1998 | 3.960 | 1.630 | 1.953 | 2.912 | 0.732 | 0.518 | 0.234 | 0.419 | 2.003 |
| 1999 | 4.548 | 2.252 | 2.543 | 2.947 | 1.064 | 0.600 | 0.275 | 0.868 | 2.876 |
| 2000 | 4.685 | 2.790 | 2.822 | 2.241 | 1.051 | 0.410 | 1.189 | 1.028 | 3.604 |
| 2001 | 4.681 | 2.281 | 5.921 | 2.348 | 1.242 | 0.553 | 0.274 | 0.951 | 3.018 |
| 2002 | 4.671 | 3.781 | 6.187 | 3.108 | 1.507 | 0.786 | 0.383 | 0.898 | 5.119 |
| 2003 | 4.993 | 3.843 | 6.604 | 3.866 | 1.618 | 1.199 | 0.522 | 1.057 | 5.647 |
| 2004 | 5.238 | 3.694 | 6.237 | 2.171 | 1.500 | 0.906 | 0.597 | 1.158 | 5.841 |
| 2005 | 5.352 | 4.223 | 6.308 | 1.921 | 1.225 | 0.871 | 0.495 | 1.735 | 5.377 |
| 2006 | 5.057 | 3.971 | 6.119 | 2.220 | 1.651 | 1.399 | 0.771 | 1.588 | 4.854 |
| 2007 | 5.249 | 4.259 | 6.405 | 1.714 | 1.870 | 1.461 | 0.834 | 1.390 | 5.019 |
| 2008 | 5.185 | 4.153 | 6.331 | 1.784 | 1.741 | 1.261 | 1.283 | 2.564 | 4.769 |
| 2009 | 5.103 | 4.179 | 7.364 | 1.675 | 1.046 | 1.186 | 1.404 | 3.786 | 4.481 |
| 2010 | 4.888 | 4.425 | 6.063 | 1.632 | 1.109 | 0.842 | 1.437 | 1.590 | 4.555 |
| 2011 | 4.900 | 4.587 | 6.024 | 1.411 | 1.183 | 1.012 | 1.686 | 2.259 | 6.024 |
| 2012 | 5.521 | 5.084 | 6.733 | 1.850 | 1.030 | 1.399 | 2.064 | 3.120 | 4.965 |
| Average | 4.935 | 3.677 | 5.574 | 2.253 | 1.305 | 0.960 | 0.897 | 1.627 | 4.543 |
Note: (MNRAS) Montly Notices of the Royal Astronomical Society; (A&A) Astronomy and Astrophysics, (ApJ) Astrophysical Journal, (NewA) New Astronomy, (IJMPD) International Journal of Modern Physics D, (AN) Astronomische Nachrichten, (Ap&SS) Astrophysics & Space Science, (PASA) Publications of the Astronomical Society of Australia, (AJ) Astronomical Journal.
4.1 Application of the Institutional Performance Score to Turkish Institutions
We present in Table 2, the resulting institutional performance scores (IPS) of nine leading Turkish institutions, along with their number of publications, each component of the IPS, namely (represented with ① in Table 2) and (② in Table 2), as well as their institutional h- and the other indices. The table is formed in such a way that the upper part is for all 749 publications, and the lower part is formed by considering 564 publications whose leading author reside in Turkey. The institutes in both portions of Table 2 are ranked according to their IPS values.
| Rank | Institution | ② | IPS | h-index | g-index | AR-index | ||||
|---|---|---|---|---|---|---|---|---|---|---|
| 1 | Sabancı | 105 | 216 | 115 | 0.53 | 3.15 | 24 | 35 | 12.45 | 40 |
| 2 | Ege | 135 | 305 | 104 | 0.34 | 3.03 | 15 | 23 | 7.63 | 27 |
| 3 | BOUN | 62 | 106 | 32 | 0.30 | 2.23 | 12 | 18 | 5.18 | 17 |
| 4 | COMU | 115 | 180 | 72 | 0.40 | 2.19 | 18 | 25 | 8.74 | 26 |
| 5 | İstanbul | 122 | 170 | 88 | 0.52 | 2.11 | 20 | 28 | 8.86 | 27 |
| 6 | METU | 120 | 191 | 48 | 0.25 | 1.99 | 20 | 33 | 11.6 | 28 |
| 7 | TÜBİTAK | 62 | 80 | 15 | 0.19 | 1.53 | 12 | 18 | 7.03 | 21 |
| 8 | Ankara | 71 | 75 | 31 | 0.41 | 1.49 | 11 | 23 | 8.64 | 15 |
| 9 | Akdeniz | 45 | 45 | 16 | 0.36 | 1.36 | 11 | 15 | 5.15 | 17 |
| Rank | Institution | ② | IPS | h-index | g-index | AR-index | ||||
| 1 | Sabancı | 43 | 140 | 76 | 0.54 | 5.02 | 14 | 23 | 8.21 | 31 |
| 2 | Ege | 93 | 255 | 85 | 0.33 | 3.66 | 11 | 18 | 6.07 | 25 |
| 3 | İstanbul | 62 | 115 | 68 | 0.59 | 2.95 | 14 | 19 | 6.54 | 20 |
| 4 | METU | 66 | 151 | 32 | 0.21 | 2.77 | 13 | 21 | 5.98 | 24 |
| 5 | COMU | 82 | 159 | 59 | 0.37 | 2.66 | 11 | 16 | 5.49 | 19 |
| 6 | BOUN | 41 | 83 | 25 | 0.30 | 2.63 | 9 | 15 | 4.62 | 11 |
| 7 | TÜBİTAK | 31 | 63 | 11 | 0.17 | 2.39 | 7 | 11 | 3.10 | 15 |
| 8 | Akdeniz | 24 | 33 | 13 | 0.39 | 1.92 | 6 | 8 | 3.77 | 9 |
| 9 | Ankara | 40 | 52 | 15 | 0.29 | 1.68 | 6 | 10 | 2.80 | 8 |
We find that Sabancı University appears on top of the list in both publication categories, followed by Ege, which produced the largest number of institutional publications in our sample. It is noteworthy that Ege University was founded in 1962 while Sabancı University in 1999 and the average number of researchers in Ege have been much larger than that in Sabancı University. Our proposed performance indicator is not biased by such contrasts since we normalize the total quantities by the number of papers published. With respect to the individual impact (② in Table 2), Sabancı again earns the first rank, followed by Ege and İstanbul. Another important ranking tool here is the ratio of ② to ①, that is the fraction of the collective impact of scientific papers within the collective impact they gained by their respective journals. In this scheme, Sabancı leads, and closely followed by İstanbul University.
Sabancı University ranks on top also in other performance indicators. It is striking to note in Table 2 that METU, İstanbul and COMU the second, third and fourth places, respectively, in their respective h-index (Hirsch, 2005), g-index (Egghe, 2006), AR-index (Jin et al., 2007), and (Boell & Wilson, 2010) rankings. In the IPS ranking, METU, İstanbul and COMU rank sixth, fifth and fourth, respectively.
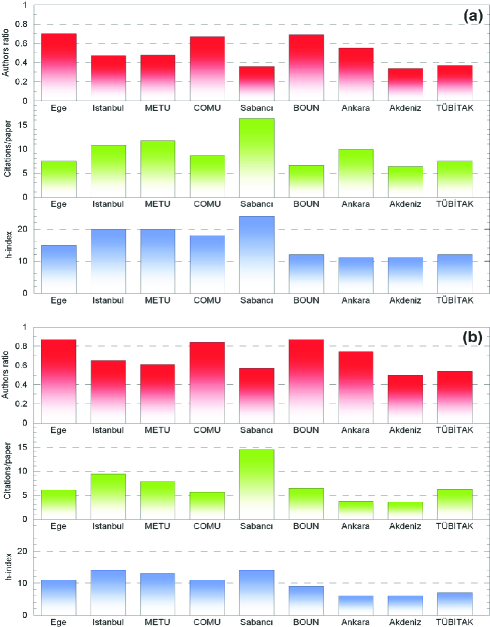
We present in Fig. 2, the average author contribution () for each institution in both publication groups. We find that the average author contribution ratios from Turkish institutions to all publications vary between 0.34 and 0.70. For all 749 publications, Turkey resident author contribution to research papers mostly comes from BOUN, Ege and COMU (Fig. 2a). There are four institutions that were found to pass the author contribution ratios of 0.50, while Sabancı University remains below this proportion, even though with the highest citation value received for research papers. The author contribution ratios for publications with domestic leading authors varied between 0.50 and 0.87. In this category, BOUN and Ege earn the first place, followed by COMU with 0.84 and Ankara University with 0.74. Also in Fig. 2, we present the number of citations per papers and institutional h-indices of all nine Turkish institutions. When citations per papers were considered, Sabancı University leads in both publication categories with 16.36 and 14.53 citations per paper, respectively. It is followed by METU (11.74%) and İstanbul (10.78%) for all publications and İstanbul (9.37%) and METU (7.76%) for publications with domestic leading authors.
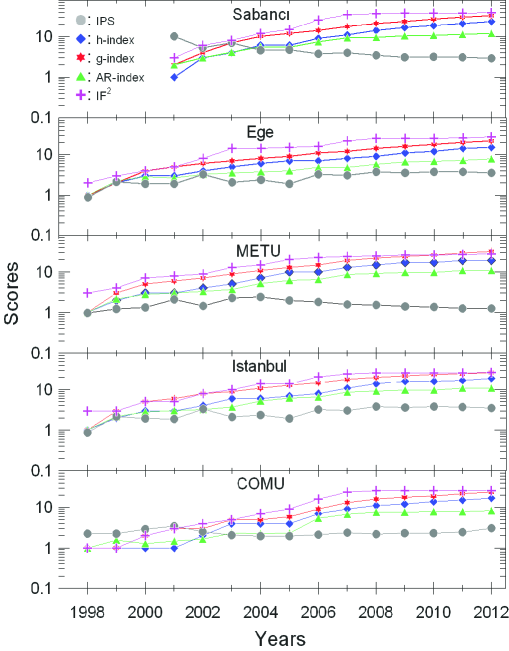
Finally, we construct time evolution of IPS values of Turkish astronomy and astrophysics related research institutions with exceeding 100 publications. We also calculate h-index, g-index, AR-index, and for these five institutions to compare with our proposed performance indicator. As seen in Fig. 3, the annual IPS of Sabancı University is mostly in the 4-8 band over the course of our study from 1998 to 2012. Note the fact that Sabancı is a newly established institution and astrophysical research started in 1999. Ege, METU and İstanbul Universities lie around IPSs of 4. It is noteworthy that Ege exhibits a gradual increase trend until 2004. The IPS trends of other institutions appear between 2 and 4. It is important to note that h-index, g-index, AR-index, and exhibit cumulative evolution in time, while the IPS can evolve positive or negatively, depending on the scientific impact of research units.
5 Discussion
We introduced a new quantitative indicator to evaluate scientific performance of research institutions. Our proposed indicator consists of two crucial components: one is the author contribution weighted impact factor of the journal in which a paper has been published, and the other one is again author contribution corrected the number of citations received by the paper per each year since its appearance in the journal. In other words, the IPS value can be regarded as institutional scientific impact of a research unit.
In the era of very high-speed communications and rather easy access to high-performance computation, scientists of today are greatly benefiting from the fact that geopolitical borders are no longer boundaries for scientific collaborations. As reaching out for international collaborations gets easier, the sizes of international research teams become eventually larger. When it comes to extensively large experimental efforts, such as, the Large Hadron Collider project at CERN, the size of collaborations can be as large as thousands of researchers from hundreds of different institutions. Therefore, it would not be trivial to assess the outcome of their collaborative effort (peer-reviewed papers) to a particular institution only. For this reason, we include the ratio of the number of co-authors from a particular institution to the total number of co-authors as a multiplicative weight for the impact factor of the journal in which a particular paper has been published.
The journal, and its associated impact factor cannot provide a direct measure for the quality of a research topic. Some articles might end up in a journal with no page charge but has a low impact factor due to the lack of funding for publication costs. Nevertheless, there are, fortunately, numerous journals which require no publication charges but have high impact factors, such as MNRAS in the field of astronomy and astrophysics. When folded with the ratio of contributing authors, the impact factor becomes a more sensitive quality indicator of a research paper.
Another important achievement indicator of a scientific paper is the number of citations received. It is unavoidable that a paper takes some time for its visibility before it is being referred by peer-researchers. As years pass by, it will be eligible for further referral. In our parameterization, we consider the citation based impact of a paper per the number of years passed so that the outcome is balanced for newly published papers, as well as those published a while ago and had already ample periods of time for their visibility.
We apply our new performance indicator scheme to the outputs of Turkish institution specialized in astronomy and astrophysics. We clearly find that commonly used h-index or its variants suggest slightly different rankings for the same sample since they involve primarily citations received by papers. This approach underestimates the performance of an institution which produced modest number of highly cited papers. As we showed in Table 2, h-index, g-index, AR-index, and based ranking closely resemble each other. On the other hand, the IPS ranking is significantly different. Another important property of the use of IPS is that it can grow or decay, depending on the scientific performance of research institutes. Whereas, the other four indicators compared here evolve in time cumulatively.
We also investigated other proposed performance indicators (such as Batista et al., 2006; Vieira & Gomes, 2010; Abramo et al., 2013; Franceschini et al., 2013). The indicators proposed by Abramo et al. (2013) requires the number of full time equivalent staff of research institutions, which is, in most cases, not easy to obtain for the institutions other than the home institution of a researcher. The methods proposed by Batista et al. (2006) and Vieira & Gomes (2010) differ from pure h-index analysis, but still heavily based upon h-index parameters. Our proposed scheme, on the other hand, makes use of easily available input parameters, which can be extracted from various commonly used channels, such as, Web of Knowledge.
Finally, it is important to note that our proposed performance indicator can also be adopted to evaluate scientific output of an individual researcher. For this purpose, the weighting parameter of the journal impact factor (i.e. the author contribution ratio) is simply replaced with the reciprocal of the number of co-authors. When summed over all publication of researchers, this would provide a more sensitive comparison tool for personal evaluations.
References
- Abramo et al. (2013) Abramo, G., D’Angelo, C. A., & Viel, F. (2013). The suitability of h and g indexes for measuring the research performance of institutions. Scientometrics, 97, 555
- Batista et al. (2006) Batista, P. D., Campiteli, M. G, Kinouchi, O., & Martinez, A. S. (2006). Is it possible to compare researchers with different scientific interests? Scientometrics, 68, 179
- Bilir et al. (2013) Bilir, S., Göğüş, E., Önal, Ö., Öztürkmen, N. D., & Yontan, T. (2013). Research performance of Turkish astronomers in the period of 1980-2010. Scientometrics, 97, 477
- Boell & Wilson (2010) Boell, S. K., & Wilson, C. S. (2010). Journal impact factors for evaluating scientific performance: use of h-like indicators. Scientometrics, 82, 613
- Braun et al. (2006) Braun, T., Glanzel, W., & Schubert, A. (2006). A Hirsch-type index for journals. Scientometrics, 69, 169
- Egghe (2006) Egghe, L. (2006). Theory and practise of the g-index. Scientometrics, 69, 131
- Franceschini & Maisano (2010) Franceschini, F., & Maisano, D. (2010). Analysis of the Hirsch index’s operational properties. European Journal of Operational Research, 203, 494
- Franceschini et al. (2013) Franceschini, F., Maisano, D., & Mastrogiacomo, L. (2013). Evaluating research institutions: the potential of the success-index. Scientometrics, 96, 85
- Guan & Gao (2008) Guan, J., & Gao, X. (2008). Comparison and evaluation of Chinese research performance in the field of bioinformatics. Scientometrics, 75, 357
- Hagen (2008) Hagen, N. T. (2008). Harmonic allocation of authorship credit: Source-level correction of bibliometric bias assures accurate publication and citation analysis. PLoS ONE, 3(12), e4021
- Hirsch (2005) Hirsch, J. E. (2005). An index to quantify an individual’s scientific research output. Proceedings of the National Academy of Sciences of the United States of America, 102, 16569
- Jin et al. (2007) Jin, B., Liang L., Rousseau R., & Egghe, L. (2007). The R- and AR-indices: Complementing the h-index. Chinese Science Bulletin, 52, 855
- Liu & Fang (2012) Liu, X. Z., & Fang, H. (2012). Fairly sharing the credit of multi-authored papers and its application in the modification of h-index and g-index. Scientometrics, 91, 37
- Schreiber et al. (2011) Schreiber, M., Malesios, C. C., & Psarakis, S. (2011). Categorizing h-index variants. Research Evaluation, 21, 397
- Vanclay (2008) Vanclay, J. (2008). Ranking forestry journals using the h-index. Journal of Informetrics, 2, 326, (2008)
- Van Raan (2006) Van Raan, A. F. J. (2006). Comparison of the Hirsc h-index with standard bibliometric indicators and with peer judgment for 147 chemistry research groups, Scientometrics, 67, 491
- Vieira & Gomes (2010) Vieira, E. S., & Gomes, J. A. N. F. (2010). A research impact indicator for institutions. Journal of Informetrics, 4, 581