Accepted for publication in
The Astrophysical Journal
Very Large Interstellar Grains as Evidenced
by the Mid-Infrared Extinction111Dedicated to the late Professor
J. Mayo Greenberg (1922.1.14–2001.11.29)
of Leiden University
who first suggested the possible existence
of very large grains in the interstellar space.
Abstract
The sizes of interstellar grains are widely distributed, ranging from a few angstroms to a few micrometers. The ultraviolet (UV) and optical extinction constrains the dust in the size range of a couple hundredth micrometers to several submicrometers. The near and mid infrared (IR) emission constrains the nanometer-sized grains and angstrom-sized very large molecules. However, the quantity and size distribution of micrometer-sized grains remain unknown as they are gray in the UV/optical extinction and they are too cold and emit too little in the IR to be detected by IRAS, Spitzer, or Herschel. In this work, we employ the 3–8 mid-IR extinction which is flat in both diffuse and dense regions to constrain the quantity, size, and composition of the m-sized grain component. We find that, together with nano- and submicron-sized silicate and graphite (as well as PAHs), m-sized graphite grains with C/H 137 and a mean size of 1.2 closely fit the observed interstellar extinction of the Galactic diffuse interstellar medium from the far-UV to the mid-IR as well as the near-IR to millimeter thermal emission obtained by COBE/DIRBE, COBE/FIRAS, and Planck up to . The m-sized graphite component accounts for 14.6% of the total dust mass and 2.5% of the total IR emission.
1 Introduction
The absorption and scattering — their combination is called “extinction” — of starlight are caused by interstellar grains of all sizes. But grains of sizes comparable to the wavelength () of starlight absorb and scatter photons most effectively (i.e., , where is the spherical radius of the grain; see Li 2009). Because of this, interstellar grains have long been known to be “submicron-sized”, with a canonical size of 0.1 (i.e., 0.1 for the visual band ) since their first detection via extinction and reddening in the visible (Trumpler 1930). However, it is now well recognized that they actually span a range of sizes from subnanometers (i.e., angstroms) and nanometers to submicrometers and micrometers.
The sub-m-sized grain population is well constrained by the wavelength-dependent extinction from the near infrared (IR) at to the far ultraviolet (UV) at . This population, ranging from a couple hundredth micrometers to several submicrometers, is often referred to as “sub-m-sized” grains or “classical” grains.
The angstrom- and nano-sized grain population cannot be constrained even by the far-UV extinction. These grains (of sizes from down to a few angstroms) are often referred to as “very large molecules”, “very small grains” (VSG), “ultrasmall grains”, or “nanoparticles”. They are in the Rayleigh regime (i.e., ) in the far-UV. On a per unit volume () basis, their extinction cross section of spherical radii at wavelength is independent of grain size, i.e., . The extinction resulting from these grains is not sensitive to the size distribution but their total volume:
| (1) | |||||
where () is the hydrogen volume (column) density, and is the total volume per H nuclei of these grains. Eq. 1 demonstrates that the observed far-UV extinction is not able to constrain the size distribution of this grain population. On the other hand, with a heat content smaller or comparable to the stellar photons that heat them, these grains are stochastically heated by single photons and do not attain an equilibrium temperature (Draine & Li 2001). Upon absorption of an energetic photon of energy , a ultrasmall grain will be heated to a maximum temperature determined by its specific heat and : , and then rapidly radiates away most of the absorbed energy at temperature . Therefore, its IR emission contains crucial information about its size since (see Li 2004). Indeed, as demonstrated by Li & Draine (2001; LD01) and Draine & Li (2007; DL07), the size distribution of the ultrasmall grain population is determined by the near- and mid-IR emission features at 3.3, 6.2, 7.7, 8.6 and 11.3 ascribed to polycyclic aromatic hydrocarbon (PAH), as well as the near- and mid-IR broadband photometry of IRAS and COBE/DIRBE, particularly those at .
In the UV/optical, micrometer-sized grains or “very large grains” (VLG) are in the geometrical-optics regime (i.e., ) and their extinction is essentially wavelength-independent or “gray” (Li 2009). Therefore, the UV/optical extinction is not able to constrain their quantity or size distribution. There are several lines of direct evidence for the presence of very large grains in the interstellar medium (ISM). Micrometer-sized interstellar SiC, graphite, Al2O3, and Si3N4 grains have been found in primitive meteorites. They were identified as presolar grains of stellar origin based on their isotope anomalies (Clayton & Nittler 2004). Furthermore, the dust detectors aboard the Ulysses and Galileo spacecrafts have detected large interstellar grains with radii up to 2.0 flowing through the heliosphere from the local interstellar cloud (Grün et al. 1994, Krüger et al. 2007). Moreover, even larger interstellar grains (of radii 20) were detected as radar meteors entering the Earth’s atmosphere on solar-hyperbolic trajectories (Taylor et al. 1996, Baggaley 2000). More recently, Westphal et al. (2014) reported the detection of seven grains possibly of interstellar origin returned by the Stardust spacecraft (also see Sterken et al. 2015). These grains are mostly composed of Mg-rich silicates and three of them have radii .
In addition, Witt et al. (2001) pointed out that the presence of very large grains in the ISM could be inferred from X-ray halos since the X-ray scattering efficiency varies approximately as while the differential cross section varies as . They examined the X-ray halo around Nova Cygni 1992 and found that, in order to explain the observed profile and intensity, the grain size distribution needs to extend to and possibly beyond 2. Furthermore, surprisingly high-albedo scattering at near-IR wavelengths has been reported for several dense regions (Witt et al. 1994, Block et al. 1994, Lehtinen & Mattila 1996), suggesting the possible presence of a population of grains at least 0.5 in radii. Moreover, based on the unaccounted for O/H abundance (Jenkins 2009, Whittet 2010), Jenkins (2009), Poteet et al. (2015), and Wang, Li & Jiang (2015) argued that the missing reservoir of O could reside on m-sized H2O grains. It is worth noting that four decades ago Greenberg (1974) had already pointed out that there could exist very large grains comprised of O, C, and N in the interstellar space. Socrates & Draine (2009) suggested that “pebble”-sized grains of 1 mm may be detected through optical scattered light halos. Finally, we note that m-sized grains were detected in dense cloud cores through the scattering of the interstellar radiation at the Spitzer/IRAC 3.6 and 4.5 bands (i.e., “coreshine”; Pagani et al. 2010, Steinacker et al. 2014).222The presence of this type of grains in dense environments is typically interpreted as due to grain growth which also occurs in proto-planetary disks (e.g., see Bouwman et al. 2001, Kessler-Silacci et al. 2006, Ricci et al. 2010). In contrast, those m-sized grains discussed in this work are for the diffuse ISM as well, not confined to dense clouds.
In this work, we aim at constraining the quantity and size distribution of the m-sized dust population. This is achieved by fitting the observed mid-IR extinction at 3–8 (§2) in terms of the silicate-graphite-PAH model together with an extra population of m-sized grains (§3). We present the results in §4 and discuss their astrophysical implications in §5. Our principal conclusions are summarized in §6.
2 Mid-IR Extinction
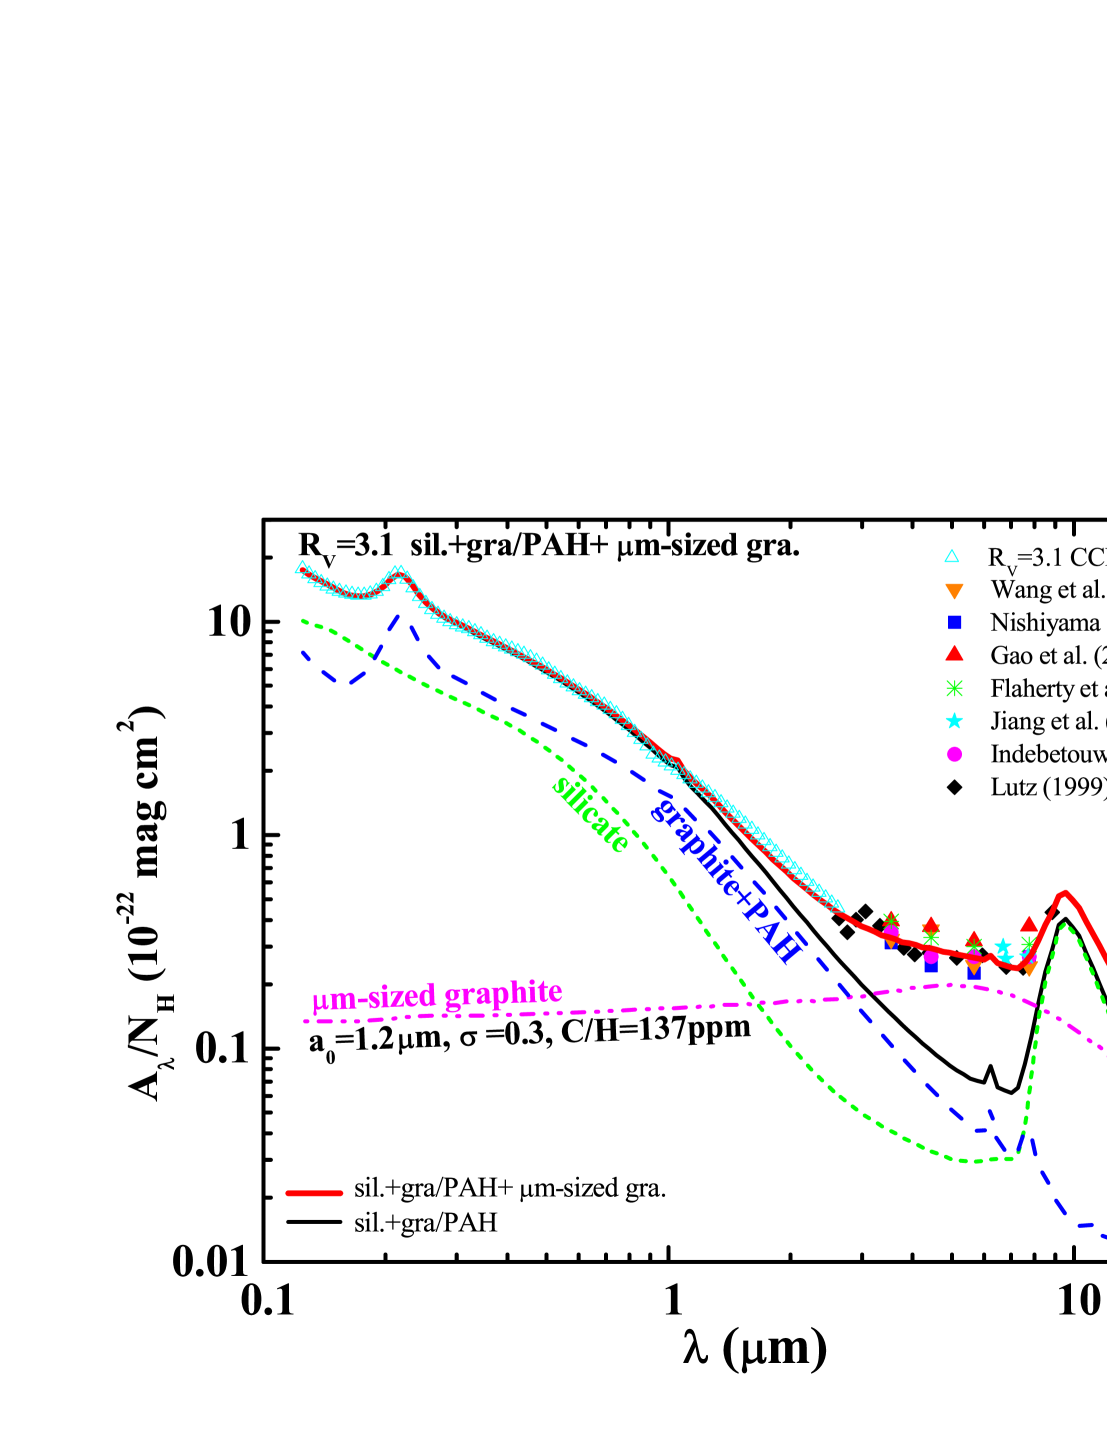
The UV/optical interstellar extinction can be characterized by a single parameter (Cardelli et al. 1989, CCM).333 is the total-to-selective extinction ratio, where is the blue band extinction at . For the Galactic average, . The UV/optical extinction can be closely fitted in terms of the classical silicate-graphite model (Mathis et al. 1977, Draine & Lee 1984 [DL84]). In the IR at , this model predicts a power-law extinction curve of (Draine 1989). As elaborated in Wang, Li & Jiang (2014), this is too steep to be consistent with the subsequent observations made by the Infrared Space Observatory (ISO) and the Spitzer Space Telescope. Numerous observations suggest that the mid-IR extinction at is flat or “gray” for both diffuse and dense environments (see Figure 1), including the Galactic center (Lutz 1999, Nishiyama et al. 2009), the Galactic plane (Indebetouw et al. 2005, Jiang et al. 2006, Gao et al. 2009), the Coalsack nebula (Wang et al. 2013), and nearby star-forming regions (Flaherty et al. 2007). All these observations appear to suggest an “universally” flat mid-IR extinction law, with little dependence on environments.
3 Dust Model
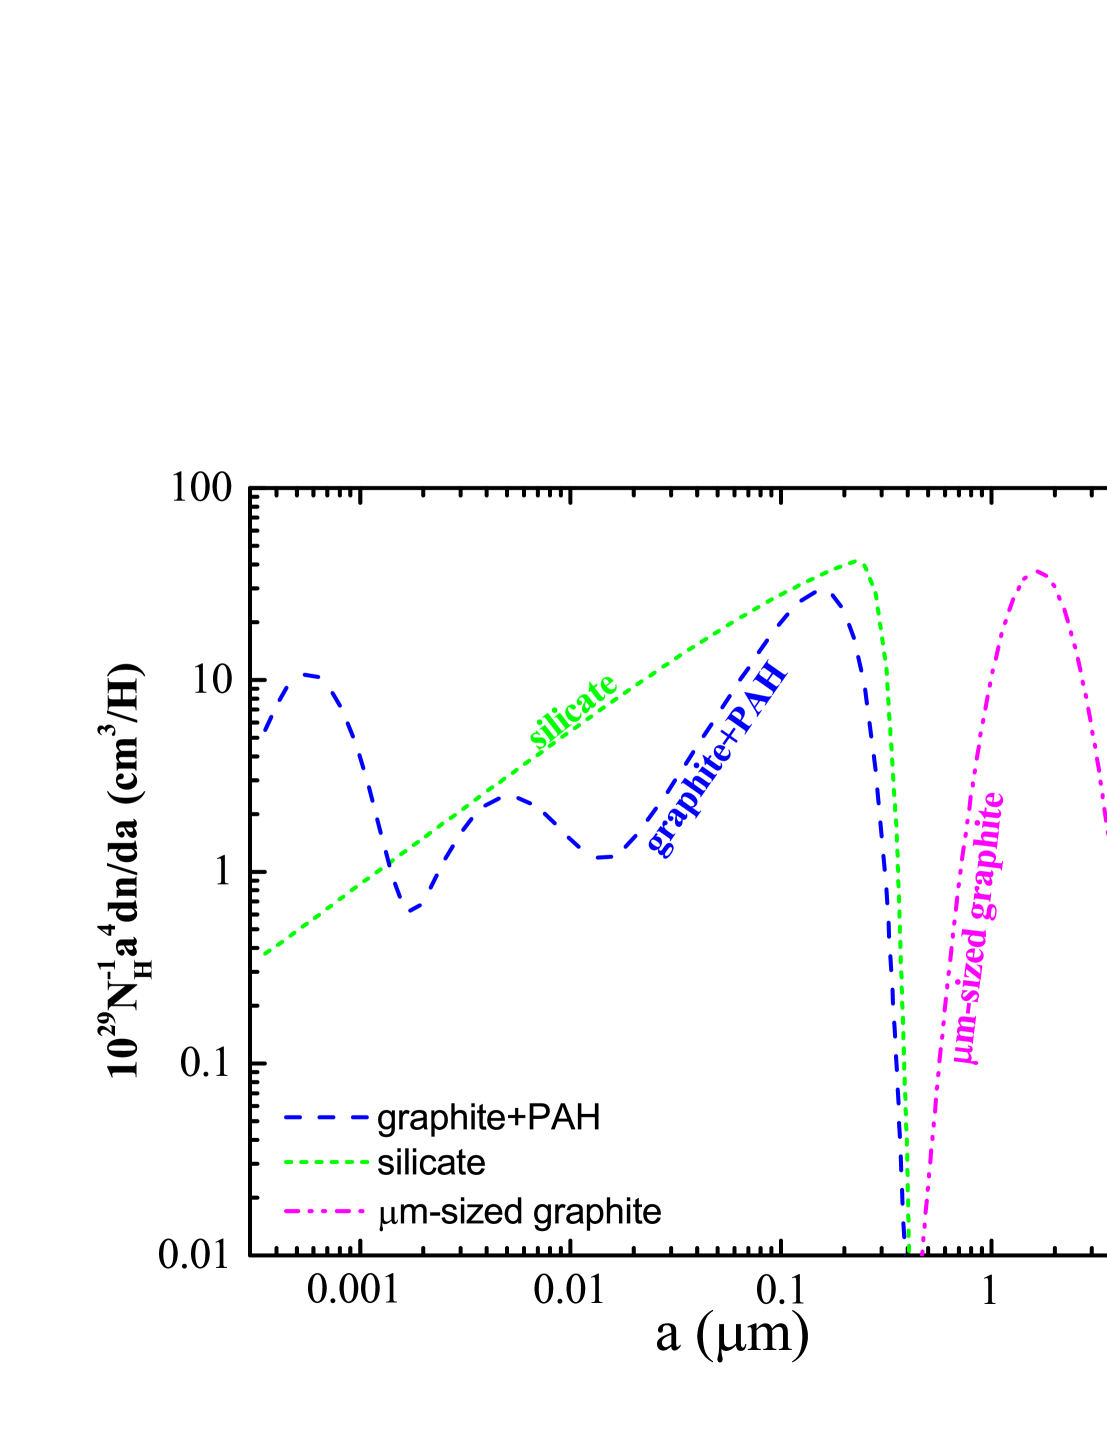
We aim at reproducing the observed extinction from the UV/optical to the near- and mid-IR. We assume a mixture of amorphous silicate dust and carbonaceous dust, taking the size distribution functional form of Weingartner & Draine (2001; WD01). We assume that the latter extends from grains with graphitic properties at radii , down to grains with PAH-like properties at very small sizes (LD01). The WD01 model employs two log-normal size distributions for two populations of PAHs which respectively peak at , and have a width of , , consuming a C abundance of , (per H nuclei). Following DL07, we adopt , , , , , and . These parameters were constrained by the observed near- and mid-IR emission. To account for the mid-IR extinction, we invoke an extra population of very large grains for which we also adopt a log-normal size distribution of peak size and width :
| (2) |
where is the atomic H mass, and are respectively the mass density and the molecular weight of the dust species ( and for silicate, and for graphite), and is the abundance per H nuclei locked up in m-sized grains.
We consider 120 wavelengths, equally spaced in , to model the extinction between 0.125 and 8. For the “observed” extinction in the wavelength range of , we take the Galactic average of as parameterized by CCM. For the 3–8 mid-IR extinction, we first obtain a weighted “average” from the observed extinction shown in Figure 1, with twice as much weight given to the diffuse sightlines toward the Galactic center. We then interpolate the “average” mid-IR extinction into 25 logarithmically equally-spaced wavelengths.
We take the optical constants of astronomical silicate and graphite of DL84. The PAH absorption cross sections are taken from DL07. Following WD01, we use the Levenberg-Marquardt method to minimize , where gives the error in the extinction fit:
| (3) |
where and are respectively the observed and model-computed extinction at wavelength . Following WD01, we take the weights for and for . The “penalty” term prevents the model-consumed C and Si abundances (, ) from grossly exceeding their interstellar abundances:
| (4) |
where and (ppm is an abbreviation of parts per million).
4 Results
In fitting the far-UV to mid-IR extinction represented by 120 “data points” (see §3), we have ten parameters from the WD01 size distribution function (, , , , for graphite, , , , , for silicate) and three parameters from the m-sized grain component. Following WD01, we fix .444WD01 found that the fitting error only mildly varies with provided while it abruptly increases with when . We consider a graphite composition for the m-sized grain component.555In the following, unless otherwise stated, we refer “graphite/PAHs” to nano- and sub-m-sized graphitic grains (including PAHs). As shown in Figure 1, with , , and , the observed extinction from the far-UV to the mid-IR is closely reproduced (with ). The corresponding parameters for the WD01 size distribution function are: , , , , and for graphite, , , , and for silicate. The derived size distributions are illustrated in Figure 2.
The model requires a total silicate mass (relative to H) of , and a total carbonaceous dust mass (relative to H) of , indicating a total gas-to-dust mass ratio of , where for . The required elemental depletions are and . The latter includes in m-sized graphite grains and in PAHs, which respectively account for 37.8% and 16.6% of the total mass of the carbonaceous dust component, and 14.6% and 6.38% of the total dust mass.
We have also tried m-sized silicate grains. Compared with graphite, silicates are much more transparent at . To account for the observed mid-IR extinction, one requires to be locked up in m-sized silicates, far exceeding the available amount of 32–41 in the ISM (see §5). Also, m-sized silicate grains exhibit a Si–O resonance dip at 8 which is not seen in the observed extinction curve. We have also considered m-sized iron grains. Unless they are extremely-elongated like needles (Dwek 2004), the mid-IR extinction requires a depletion of , far exceeding the available amount of Fe/H 28–35 in the ISM. More recently, Köhler et al. (2014) found that amorphous silicates with iron nanoparticles embedded could enhance the mid-IR extinction. Köhler et al. (2015) further found that dust aggregates could also cause increased mid-IR extinction. It would be interesting to see how their model extinction per H column compares with the observed extinction.
5 Discussion
5.1 IR Emission
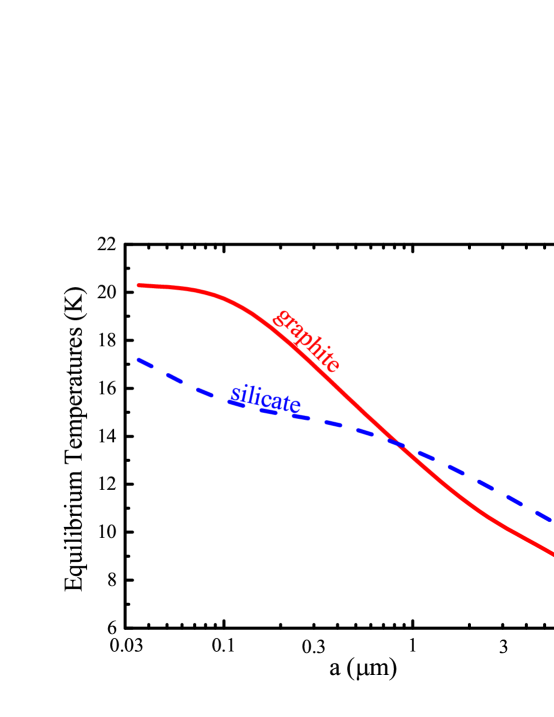
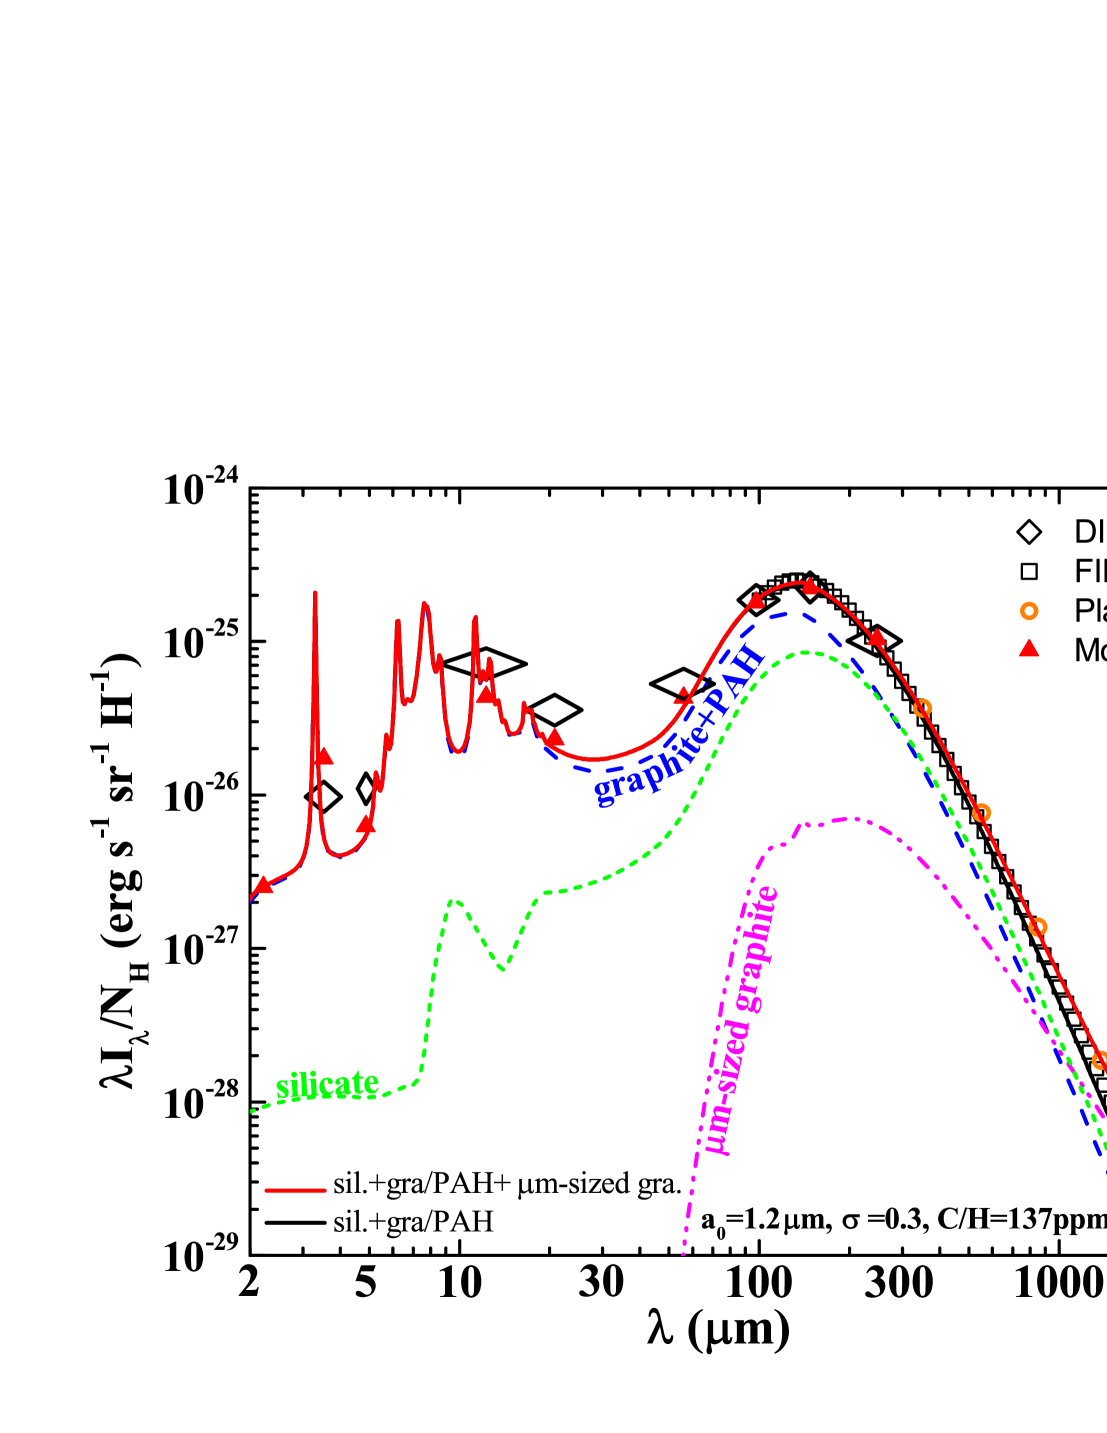
As shown in Figure 1, m-sized graphite grains are “gray” in the UV, optical, and near-IR. They do not absorb much in the UV/optical, and therefore by implication do not emit much radiation in the IR. We have calculated the temperature probability distribution functions of PAHs, small graphite and silicate grains of radii smaller than 250 which are heated by the Mathis, Mezger, & Panagia (1983, MMP83) interstellar radiation field (ISRF). We have also calculated the equilibrium temperatures of silicate and graphite grains of radii larger than 250 (see Figure 3). The resulting IR emission is shown in Figure 4 and compared with that of the diffuse ISM observed by COBE/DIRBE, COBE/FIRAS and Planck.666Many Herschel observations have deen dedicated to the investigation of the dust properties in the ISM (e.g., see Abergel et al. 2010, Gordon et al. 2010, Molinari et al. 2010, Juvela et al. 2011, Juvela 2015). In this work, these Herschel data are not included since the Herschel/PACS bands are essentially covered by COBE/DIRBE, while the Herschel/SPIRE bands are essentially covered by COBE/FIRAS and Planck (see Table 4 of LD01 and Table 6 of DL07). Our model yields a total IR intensity of . The fractional contributions of silicate, graphite/PAHs, and m-sized graphite are approximately 27.5%, 70.0%, and 2.5%, respectively. The m-sized graphite component is cold ( for compared to for , see Figure 3) and its contribution to the overall emission is only noticeable at , becomes significant at , and dominates the emission at .
Figure 4 shows that our model fits the observed emission very well from the near-IR to submm: up to , it is in close agreement with the COBE/FIRAS spectrophotometry. At , the model emission slightly exceeds the COBE/FIRAS data. We note that the Planck photometric data at are also slightly higher than the COBE/FIRAS spectrophotometry. Our model is in excellent agreement with the Planck data up to , and does not overpredict until . At , the model emission is stronger than the COBE/FIRAS photometry by a factor of 1.5 and exceeds the Planck data by 72%. However, the far-IR dielectric functions of graphite and silicate adopted here may not be known with a high precision (e.g., at the DL84 silicate has an opacity of , while the silicate material measured by Agladze et al. (1996) had ). We also note that the Planck data at exceeds that of COBE/FIRAS by 45%.
Finkbeiner, Davis & Schlegel (1999; FDS) approximated the COBE/FIRAS data in terms of a two-component model consisting of a warm component of temperature and a cold component of temperature : . They ascribed the warm component to carbonaceous grains and the cold component to amorphous silicates. We argue that while the FDS two-component model provides an excellent representation of the observed far-IR emission, their ascription may not be physical. As shown in Figure 3, to attain an equilibrium temperature of , silicate grains need to be very large, with radii . Such very large silicate grains are gray in the UV/optical and contribute little to the UV/optical extinction. As a result, the observed UV/optical extinction would exclusively rely on carbonaceous dust. However, it is known that neither silicates nor carbonaceous dust alone can account for the observed UV/optical extinction (see Li 2005a). It is more natural to attribute the warm component to a combination of sub-m-sized silicate and carbonaceous grains and the cold component either to a population of m-sized grains or alternatively, according to the two-level-system (TLS) model, to the low energy transitions associated with the disordered internal structure of sub-m-sized amorphous grains (Meny et al. 2007).
A cold emission component of 4–7 was also noted in the COBE/FIRAS Galactic emission spectrum by Wright et al. (1991) and Reach et al. (1995). Rowan-Robinson (1992) explained the cold emission in terms of grains of . But he did not specify the composition of this grain population. He simply assumed its absorption efficiency to be for and for .
As shown in Figure 4, our model SED flattens at . The overall dust opacity at has a power-index of . In contrast, the opacity at has a slightly smaller power-index of . The Planck observations of the Galactic diffuse ISM detected the flattening of the SED at long wavelengths, with at (see Planck Collaboration XVII 2014). These observations also provided evidence for the far-IR opacity variations in the diffuse ISM, attributable to large amorphous carbon grains or the TLS model of disordered charge distribution in amorphous grains.
5.2 The C/H Crisis
The interstellar abundances of Si/H and C/H are unknown. They are often assumed to be that of solar (, , Asplund et al. 2009), proto-Sun (, , Lodders 2003), early B stars (, , Nieva & Przybilla 2012), or young F/G stars (, , Sofia & Meyer 2001). Our model consumes which is consistent with the proto-Sun Si/H abundance. With the gas-phase abundance of (Cardelli et al. 1996) or (Sofia et al. 2011) subtracted, the proto-Sun reference standard leaves only 148 or 188 of C/H for the dust, respectively. With , our model uses too much C compared to what would be available in the ISM. Even ignoring the m-sized graphite component, the silicate-graphite-PAH model, with (WD01), is already in “C crisis” (Snow & Witt 1995). With the inclusion of a population of m-sized graphite grains, our model amplifies the so-called “C crisis”.
The “C crisis” holds for all dust models, including that of Zubko et al. (2004; ZDA) which requires (and ) and Jones et al. (2013; J13) which requires (and ). Note that the mid-IR extinction has not been accounted for by ZDA or J13. The ZDA model produces much less extinction at than observed (see Figure 23.11 in Draine 2011). The J13 model fitted the IR extinction tabulated in Mathis (1990) which is much lower than the mid-IR extinction described here in §2. The total consumed C/H is expected to be similar to ours if the flat mid-IR extinction is to be accounted for by their models. This is indicated by the Kramers-Kronig relation of Purcell (1969) which relates the wavelength-integrated extinction to the dust quantity: where is the total dust volume per H nucleon, and is a dimensionless factor which depends only upon the grain shape and the static dielectric constant of the grain material. Spherical silicates () with the proto-Sun abundance contribute to the extinction integration. With (see Figure 1), one derives for spherical graphite (). This is a lower limit since . For moderatly elongated grains, the C crisis still persists (e.g., with an elongation of 2–3, one requires of graphite of ).
A likely solution to the C crisis problem is that the stellar photospheric abundances of dust-forming elements may be considerably lower than that of the interstellar material from which young stars are formed. This could be caused by an incomplete incorporation of heavy elements in stars during the star formation process, and/or an underestimation of the degree of heavy-element settling in stellar atmospheres (see Li 2005b). Parvathi et al. (2012) derived the gas-phase C/H abundance of 16 Galactic interstellar sightlines. They found that varies from one sightline to another, with 1/3 of the sightlines having their gas-phase C/H abundance alone exceeding the proto-Sun C/H abundance (e.g., the sightline toward HD 206773 has a gas-phase C/H abundance of [see Parvathi et al. 2012] which is comparable to the total C/H abundance of 462 required by our model (i.e., [see §4] plus [see Sofia et al. 2011]).777If we attribute the flat 3–8 mid-IR extinction to m-sized silicate or iron spheres, we would face a much more severe Si or Fe “crisis”: as discussed in §4, while the model consisting of m-sized graphite grains requires 60% more C/H than the proto-Sun C/H abundance, the model consisting of m-sized silicate grains requires 725 times more Si/H than the proto-Sun Si/H abundance, and the model consisting of m-sized iron spheres requires 3.0 times more Fe/H than the proto-Sun Fe/H abundance.
5.3 An Artificial Gap in the Grain Size Distribution?
The size distribution derived for the m-sized dust component is not a continuous extension of the sub-m-sized component but has a gap in between (see Figure 2). This seems inconsistent with the observed continuous size distribution of the interstellar grains entering the solar system (see Figure 2 of Frisch et al. 1999). However, the extinction resulting from such a continuous size distribution would be totally unlike what is actually observed (see Figures 3, 4 of Draine 2009).888Draine (2009) added a population of large grains to the WD01 size distribution so that the new one approximately reproduces that of the interstellar grains detected by Ulysses and Galileo at of Landgraf et al. (2000). With the inclusion of these large grains, Draine (2009) derived an extinction curve of . As a matter of fact, a close inspection of the in situ dust size distribution of Frisch et al. (1999) reveals that it already shows a flattening off at . Witt et al. (2001) also noted that the size distribution continuously extending to micrometers required to explain the X-ray halo around Nova Cygni 1992 would lead to an extinction curve with . It would be interesting to see if a size distribution with a gap in between the sub-m-sized grains and the m-sized grains like the one derived here could reproduce the observed X-ray halo and result in an extinction curve with .
5.4 The Origin of Very Large Grains
The origin of m-sized interstellar grains is not known. Theoretical calculations show that carbon dust can grow to sizes as large as a few micrometers in the radioactive environment of supernova ejecta, even if O is more abundant than C (Clayton et al. 1999). These calculations are also applicable to the formation of m-sized oxides within supernova gas having C O. However, we do not know in the ISM how much dust originates from supernovae. If a substantial fraction of interstellar dust is from supernova condensates, then m-sized grains may be prevalent in the ISM.
We note that the size and quantity derived for the m-sized graphite dust does not rely on the silicate-graphite-PAH model. The m-sized component is inferred from the mid-IR extinction which is essentially independent of the observed properties (e.g., UV/optical/near-IR extinction, near-, mid-, and far-IR emission) previously used to constrain dust models. These models differ from each other in detailed composition and morphology (see Li 2004). But they all fit the UV/optical extinction and are deficient in comparison with the observed 3–8 mid-IR extinction except the WD01 model. To account for the observed mid-IR extinction, a population of m-sized dust is required by all dust models. The size is inferred from a general consideration of light scattering theory. The quantity of this component can be inferred from the Kramers-Kronig relation of Purcell (1969).
Finally, we note that, while the m-sized dust component derived here is carbonaceous in nature, the m-sized interstellar grains detected by the Stardust spacecraft are remarkably devoid of carbon (Westphal et al. 2014). This is probably due to the shock destruction of carbonaceous grains in the local interstellar cloud, as revealed by the overabundant CII in the interstellar gas surrounding the heliosphere (see Slavin & Frisch 2008).
6 Summary
The 3–8 mid-IR extinction is observed to be flat or gray in various interstellar environments, including low-density diffuse clouds, translucent clouds, and dense clouds. It provides a sensitive constraint on very large, m-sized grains which are gray at optical wavelengths and whose existence can not be constrained by the far-UV to near-IR extinction. We model the flat 3–8 mid-IR extinction with m-sized grains together with a mixture of silicate and graphite grains of sizes ranging from a few angstroms to a few submicrometers. Our principal results are as follows:
-
1.
The observed interstellar extinction is closely reproduced from the far-UV to the mid-IR with in silicate grains, in carbonaceous grains which include PAHs (), submicron-sized graphite (C/H 165), and m-sized graphite (). The sizes of the m-sized graphite component are modeled as a log-normal distribution peaking at and having a width of .
-
2.
Our model closely reproduces the IR emission of the diffuse ISM observed by COBE/DIRBE, COBE/FIRAS, and Planck from the near-IR up to . With equilibrium temperatures of , m-sized graphite grains dominate the emission at and account for 2.5% of the total IR emission.
-
3.
A carbon budget problem does arise with respect to our model when one compares the model-required C depletion of with the solar and proto-Sun abundances of 269, 288.
-
4.
Micrometer-sized silicate or iron grains, if present in the ISM, are unlikely responsible for the observed 3–8 extinction as they would require too much Si/H and Fe/H, exceeding the proto-Sun Si/H and Fe/H abundances by a factor of 725 and 3.0, respectively.
References
- (1) Abergel, A., Arab, H., Compiègne, M., et al. 2010, A&A, 518, L96
- (2) Agladze, N. I., Sievers, A. J., Jones, S. A., et al. 1996, ApJ, 462, 1026
- (3) Arendt, R. G., Odegard, N., Weiland, J. L., et al. 1998, ApJ, 508, 74
- (4) Asplund, M., Grevesse, N., Sauval, A.J., & Scott, P. 2009, ARA&A, 47, 481
- (5) Baggaley, W. J. 2000, J. Geophys. Res., 105, 10353
- (6) Block, D. L., Witt, A. N., Grosbol, P., et al. 1994, A&A, 288, 383
- (7) Bouwman, J., Meeus, G., de Koter, A., et al. 2001, A&A, 375, 950
- (8) Cardelli, J. A.,Clayton, G. C., & Mathis, J. S. 1989, ApJ, 345, 245 (CCM)
- (9) Cardelli, J. A., Meyer, D. M., Jura, M., & Savage, B. D. 1996, ApJ, 467, 334
- (10) Clayton, D. D., Liu, W., & Dalgarno, A. 1999, Science, 283, 1290
- (11) Clayton, D. D., & Nittler, L. R. 2004, ARA&A, 42, 39
- (12) Draine, B. T. 1989, in Infrared Spectroscopy in Astronomy, ed. B. H. Kaldeich (Paris: ESA Publ. Division), 93
- (13) Draine, B. T. 2009, Space Sci. Rev., 143, 333
- (14) Draine, B. T. 2011, Physics of the Interstellar and Intergalactic Medium (Princeton, NJ: Princeton Univ. Press)
- (15) Draine, B. T., & Lee, H. M. 1984, ApJ, 285, 89 (DL84)
- (16) Draine, B. T., & Li, A. 2001, ApJ, 551, 807
- (17) Draine, B. T., & Li, A. 2007, ApJ, 657, 810 (DL07)
- (18) Dwek, E. 2004, ApJ, 611, L109
- (19) Flaherty, K. M., Pipher, J. L., Megeath, S. T., et al. 2007, ApJ, 663, 1069
- (20) Finkbeiner, D. P., Davis, M., & Schlegel, D. J. 1999, ApJ, 524, 867 (FDS)
- (21) Frisch, P. C., Dorschner, J. M., Geiss, J., et al. 1999, ApJ, 525, 492
- (22) Gao, J., Jiang, B.W., & Li, A., 2009, ApJ, 707, 89
- (23) Gordon, K. D., Galliano, F., Hony, S., et al. 2010, A&A, 518, L89
- (24) Greenberg, J. M. 1974, ApJ, 189, L81
- (25) Grün, E., Gustafson, B., Mann, I., et al. 1994, A&A, 286, 915
- (26) Indebetouw, R., Mathis, J. S., Babler, B. L., et al. 2005, ApJ, 619, 931
- (27) Jenkins, E. B. 2009, ApJ, 700, 1299
- (28) Jiang, B.W., Gao, J., Omont, A., Schuller, F., & Simon, G. 2006, A&A, 446, 551
- (29) Jones, A. P., Fanciullo, L., Köhler, M., et al. 2013, A&A, 558, A62 (J13)
- (30) Juvela, M., Ristorcelli, I., Pelkonen, V.-M., et al. 2011, A&A, 527, A111
- (31) Juvela, M. 2015, Planet. Space Sci., in press
- (32) Kessler-Silacci, J., Augereau, J.-C., Dullemond, C. P., et al. 2006, ApJ, 639, 275
- (33) Köhler, M., Jones, A., & Ysard, N. 2014, A&A, 565, L9
- (34) Köhler, M., Ysard, N., & Jones, A. P. 2015, A&A, 579, A15
- (35) Krüger, H., Landgraf, M. Altobelli, N., et al. 2007, Space Sci. Rev., 130, 401
- (36) Landgraf, M., Baggaley, W. J., Grün, E., Krüger, H., & Linkert, G. 2000, J. Geophys. Res., 105, 10343
- (37) Lehtinen, K., & Mattila, K. 1996, A&A, 309, 570
- (38) Li, A. 2004, in ASP Conf. Ser. 309, Astrophysics of Dust, ed. A. N. Witt, G. C. Clayton, & B. T. Draine (San Francisco, CA: ASP), 417
- (39) Li, A. 2005a, J. Phys.: Conf. Ser., 6, 229
- (40) Li, A. 2005b, ApJ, 622, 965
- (41) Li, A. 2009, in Small Bodies in Planetary Sciences, ed. I. Mann, A. Nakamura, & T. Mukai (Berlin: Springer), 167
- (42) Li, A., & Draine, B. T. 2001, ApJ, 554, 778 (LD01)
- (43) Lodders, K. 2003, ApJ, 591, 1220
- (44) Lutz, D. 1999, in The Universe as Seen by ISO, ed. P. Cox & M. Kessler (ESA Special Publ., Vol. 427; Noordwijk: ESA), 623
- (45) Mathis, J. S., Mezger, P. G., & Panagia, N. 1983, A&A, 128, 212 (MMP83)
- (46) Mathis, J. S., Rumpl, W., & Nordsieck, K. H. 1977, ApJ, 217, 425
- (47) Meny, C., Gromov, V., Boudet, N., et al. 2007, A&A, 468, 171
- (48) Molinari, S., Swinyard, B., Bally, J., et al. 2010, PASP, 122, 314
- (49) Nieva, M. F., & Przybilla. N., 2012, A&A, 539, 143
- (50) Nishiyama, S., Tamura, M., Hatano, H., et al. 2009, ApJ, 696, 1407
- (51) Pagani, L., Steinacker, J., Bacmann, A., et al. 2010, Science, 329, 1622
- (52) Parvathi, V. S., Sofia, U. J., Murthy, J., & Babu, B. R. S. 2012, ApJ, 760, 36
- (53) Planck Collaboration XVII 2014, A&A, 566, A55
- (54) Poteet, C. A., Whittet, D. C. B., & Draine, B. T. 2015, ApJ, 801, 110
- (55) Purcell, E. M. 1969, ApJ, 158, 433
- (56) Reach, W. T., Dwek, E., Fixsen, D. J., et al. 1995, ApJ, 451, 188
- (57) Ricci, L., Testi, L., Natta, A., & Brooks, K. J. 2010, A&A, 521, A66
- (58) Rowan-Robinson, M. 1992, MNRAS, 258, 787
- (59) Slavin, J. D., & Frisch, P. C. 2008, A&A, 491, 53
- (60) Snow, T. P., & Witt, A. N. 1995, Science, 270, 1455
- (61) Socrates, A., & Draine, B. T. 2009, ApJ, 702, L77
- (62) Sofia, U. J., & Meyer, D.M., 2001, ApJ, 554, L221
- (63) Sofia, U. J., Parvathi, V. S., Babu, B. R. S., & Murthy, J. 2011, AJ, 141, 22
- (64) Steinacker, J., Ormel, C. W., Andersen, M., & Bacmann, A. 2014, A&A, 564, 96
- (65) Sterken, V. J., Strub, P., Krüger, H., et al. 2015, ApJ, in press
- (66) Taylor, A.D., Baggaley, W.J., & Steel, D.I., 1996, Nature, 380, 323
- (67) Trumpler, R. J. 1930, PASP, 42, 214
- (68) Wang, S., Gao, J., Jiang, B. W., Li, A., & Chen, Y. 2013, ApJ, 773, 30
- (69) Wang, S., Li, A., & Jiang, B. W. 2014, Planet. Space Sci., 100, 32
- (70) Wang, S., Li, A., & Jiang, B. W. 2015, MNRAS, in press
- (71) Weingartner, J. C., & Draine, B. T. 2001, ApJ, 548, 296 (WD01)
- (72) Westphal, A. J., Stroud, R. M., Bechtel, H. A., et al. 2014, Science, 345, 786
- (73) Whittet, D. C. B. 2010, ApJ, 710, 1009
- (74) Witt, A. N., Lindell, R. S., Block, D. L., & Evans, Rh. 1994, ApJ, 427, 227
- (75) Witt, A. N., Smith, R. K., & Dwek, E. 2001, ApJ, 510, L201
- (76) Wright, E. L., Mather, J. C., Bennett, C. L., et al. 1991, ApJ, 381, 200
- (77) Zubko, V., Dwek, E., & Arendt, R. G. 2004, ApJS, 152, 211 (ZDA)