22email: pearce@kth.se, mozsi@kth.se
Present address of M. Kole: Geneva University, CH-1211 Geneva, Switzerland.
Present address of E. Moretti: Max-Planck-Institut für Physik, D-80805 Munich, Germany. 33institutetext: H.-G. Florén, G. Olofsson 44institutetext: Stockholm University, Department of Astronomy, AlbaNova University Centre, SE-106 91 Stockholm, Sweden. 55institutetext: T. Kamae 66institutetext: University of Tokyo, Department of Physics, 113-0033 Tokyo, Japan. 77institutetext: T. Kawano, H. Takahashi 88institutetext: Hiroshima University, Department of Physical Science, 739-8526 Hiroshima, Japan. 99institutetext: J. Lind, J.-E. Strömberg, O. Welin 1010institutetext: DST Control, Åkerbogatan 10, 582 54 Linköping, Sweden. 1111institutetext: A. Iyudin 1212institutetext: Skobeltsyn Institute of Nuclear Physics, Moscow State University by M. V. Lomonosov, 119991 Moscow, Russia. 1313institutetext: D. Shifrin 1414institutetext: Russian Federal Service for Hydrometeorology and Environmental Monitoring, Central Aerological Observatory, Moscow, Russia.
The design and flight performance of the PoGOLite Pathfinder balloon-borne hard X-ray polarimeter
Abstract
In the 50 years since the advent of X-ray astronomy there have been many scientific advances due to the development of new experimental techniques for detecting and characterising X-rays. Observations of X-ray polarisation have, however, not undergone a similar development. This is a shortcoming since a plethora of open questions related to the nature of X-ray sources could be resolved through measurements of the linear polarisation of emitted X-rays. The PoGOLite Pathfinder is a balloon-borne hard X-ray polarimeter operating in the 25 - 240 keV energy band from a stabilised observation platform. Polarisation is determined using coincident energy deposits in a segmented array of plastic scintillators surrounded by a BGO anticoincidence system and a polyethylene neutron shield. The PoGOLite Pathfinder was launched from the SSC Esrange Space Centre in July 2013. A near-circumpolar flight was achieved with a duration of approximately two weeks. The flight performance of the Pathfinder design is discussed for the three Crab observations conducted. The signal-to-background ratio for the observations is shown to be 0.250.03 and the Minimum Detectable Polarisation (99% C.L.) is (28.42.2)%. A strategy for the continuation of the PoGOLite programme is outlined based on experience gained during the 2013 maiden flight.
Keywords:
X-ray polarimetry scientific ballooning Crabpacs:
95.75.Hi 07.85.Fv 95.55.Ka1 Introduction
X-ray sources are known to include non-thermal radiation emitted either from asymmetric systems (e.g. jets, columns, and accretion disks), or from systems having ordered magnetic fields. For such sources, the emission in X-rays is expected to be polarised. X-ray polarimetry remains, however, a largely unexplored field of high-energy astrophysics. Imaging, spectroscopy and timing are the standard observation techniques. The addition of the polarisation fraction and angle provides unique information regarding the emission mechanism and the geometry of the emitting region, respectively background .
A concept for a balloon-borne hard X-ray Compton polarimeter with sensitivity for point sources with X-ray fluxes of order 100 mCrab has been presented previously Overview paper . The collecting area of the polarimeter is defined by 217 close-packed hexagonal cross-section plastic scintillator detector cells. In order to initiate the experimental programme, a reduced area polarimeter comprising 61 detector cells has been constructed to allow observations of 1 Crab sources. The PoGOLite Pathfinder mission was launched from the SSC Esrange Space Centre on July 12th 2013. The aims of this flight were to evaluate the experimental design, study high latitude stratospheric background conditions and make observations of the Crab (25 - 240 keV). Planned polarimetric observations of Cygnus X-1 were not possible since the required hard state magnus was not present.
For the synchrotron processes expected in the Crab, the electric field vector of the X-ray flux will be perpendicular to the magnetic field lines in the emitting region. A polarisation measurement therefore determines the direction of the magnetic field allowing competing emission models to be tested in the hard X-ray regime. For accretion disks around black holes, such as Cygnus X-1, Compton scattering processes are present. In this case, the electric vector is perpendicular to the plane of scattering and a polarisation measurement determines the geometrical relation between the photon source and the scatterer. The linear polarisation of X-ray emissions (2.6 keV and 5.2 keV) from the Crab nebula were studied over forty years ago using a dedicated polarimeter MW . The relatively high polarisation fraction observed (19%) is compatible with synchrotron emission. The polarisation angle was found to lie approximately 30∘ from the Crab pulsar spin axis. Polarimetric observations made using instruments on-board the INTEGRAL observatory have been made more recently integral for the energy range of 100’s keV to 1 MeV. The polarimetric response of these instruments was not evaluated prior to launch. The high polarisation fraction observed supports synchrotron emission from a well-ordered magnetic environment. The polarisation angle was determined to be well aligned to the Crab pulsar spin axis, indicating that high-energy electrons are generated close to the pulsar.
2 Polarimeter design
2.1 Measurement principle
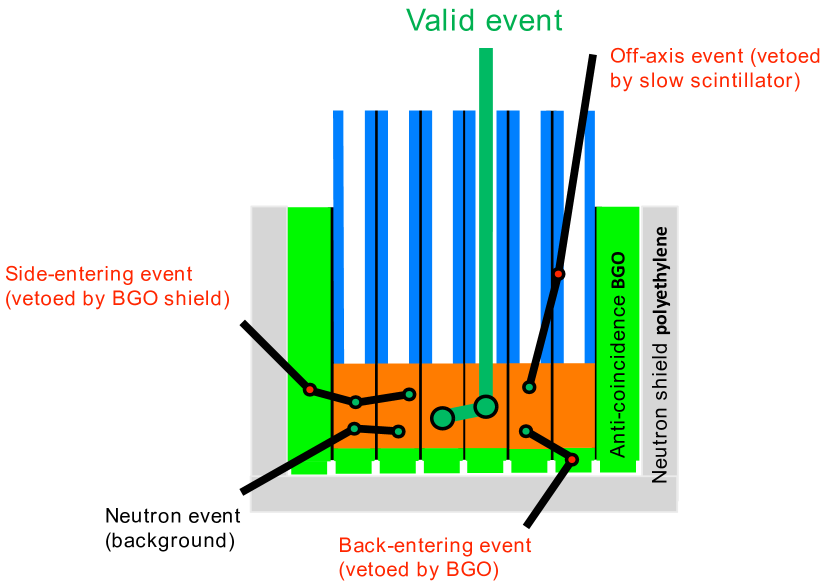
The PoGOLite polarimeter comprises a close-packed hexagonal array of plastic scintillators and a mixed plastic/BGO (Bi4Ge3O12) anticoincidence system. The polarisation of X-rays incident on the array of plastic scintillators is determined by reconstructing the distribution of azimuthal scattering angles defined relative to the polarisation plane. A polarisation event can be characterised by two energy deposits in the scintillator array – corresponding to a Compton scatter and either a photoelectric absorption or a second Compton scatter in a nearby scintillator element. Figure 1 describes the measurement concept. During observations the polarimeter is rotated (0.2 r.p.m.) around the viewing axis in order to remove the systematic bias which could result e.g. from intrinsic differences in efficiency between the scintillator elements. Each polarisation event is tagged with the roll angle, generating a continuous distribution of scattering angles.
The resulting distribution of azimuthal scattering angles will be modulated for a polarised incident flux. The modulation factor is defined as the ratio between the amplitude and mean value of a fitted sinusoidal modulation curve. The polarisation fraction of the source emission is given by the measured modulation factor divided by that for a 100% polarised beam (M100), derived from computer simulations validated with tests using polarised photons Ground calibration paper . The polarisation angle is related to the phase of the fitted modulation curve. Alternatively, an approach based on Stokes vectors can be used to extract polarisation parameters Stokes . The design of the polarimeter has been optimised and characterised using Geant4 simulations Overview paper , tests using polarised synchrotron beams synchro and radioactive sources Ground calibration paper . The expected M100 for Crab observations is 22% Ground calibration paper . In the remainder of this section, the implementation of the conceptual design outlined in Overview paper is described in detail.
2.2 Scintillator array
The scintillator array comprises 61 hexagonal cross-section phoswich detector cells (PDCs) arranged in a honeycomb structure. Each PDC is 84 cm long and has three scintillating elements, as shown in Figure 2.
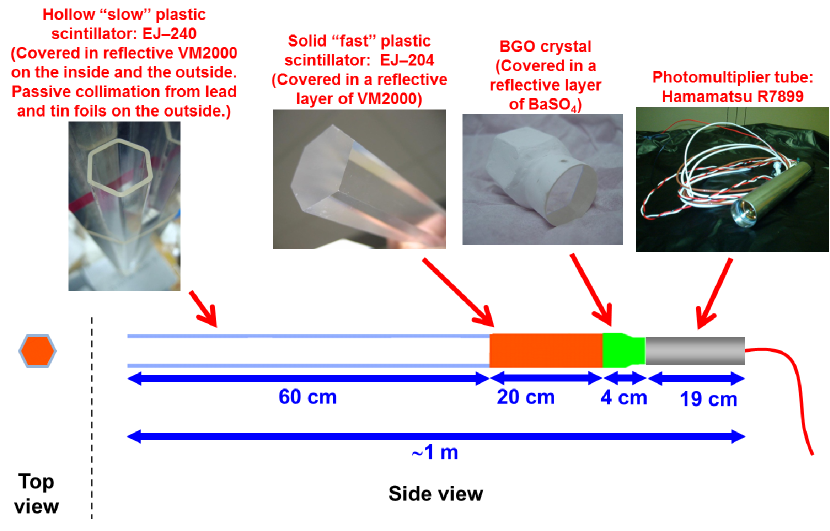
The upper part of the PDC is an active collimator “slow” plastic scintillator tube (Eljen Technology EJ240, 60 cm long, 2 mm wall thickness, scintillation decay time 285 ns), while the bottom part is a anticoincidence BGO crystal (4 cm long, scintillation decay time 300 ns, supplied by the Nikolaev Institute of Inorganic Chemistry). Sandwiched between these two anticoincidence components is a solid “fast” plastic scintillator rod (EJ204, 20 cm long, scintillation decay time 1.8 ns). The scintillators are glued together using a UV transparent polyurethane-based epoxy resin. The fast scintillator rods and slow scintillator tubes are wrapped (inside and outside) in a reflective layer of 80 m thick 3M VM2000 radiant mirror film to maximise the light collection. Due to their irregular shape, the BGO crystals are instead covered in a layer of 350 m thick epoxy loaded with reflective BaSO4. For additional passive collimation, each slow scintillator tube is sheathed in 50 m thick foils of lead and tin (to absorb fluorescence X-rays from the lead). The fast and slow scintillators are covered in a 200 m thick protective layer of plastic heat-shrink film. Each PDC is read out by a modified version of the Hamamatsu Photonics R7899 photomultiplier tube (PMT). The PMT is designed to have a sufficiently low dark current level to allow Compton energy deposits from incident 25 keV photons (1.2 keV corresponding to 0.6 photo-electrons is deposited for a polar scattering angle of 90∘) to be detected. A 1 mm thick silicone wafer, Eljen Technology EJ560, and generic optical grease are used to interface the BGO crystal surface to the photomultiplier tube window. Each PDC is co-aligned with the polarimeter viewing axis with a precision exceeding 0.1∘. The plastic scintillator array is surrounded by a 60 cm tall BGO side anticoincidence shield (SAS) comprising 30 units, where each unit consists of three 20 cm long segments, glued together, and mounted on a 10 mm thick aluminium support. SAS BGO crystals are covered in a reflective layer of BaSO4 and read out using the same PMT as used for the PDCs.
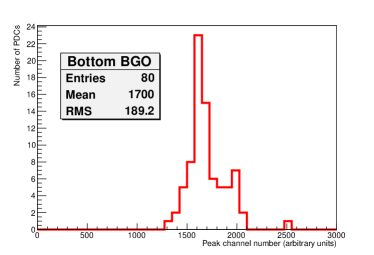
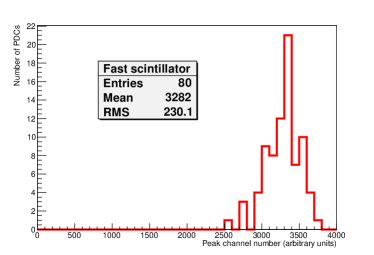
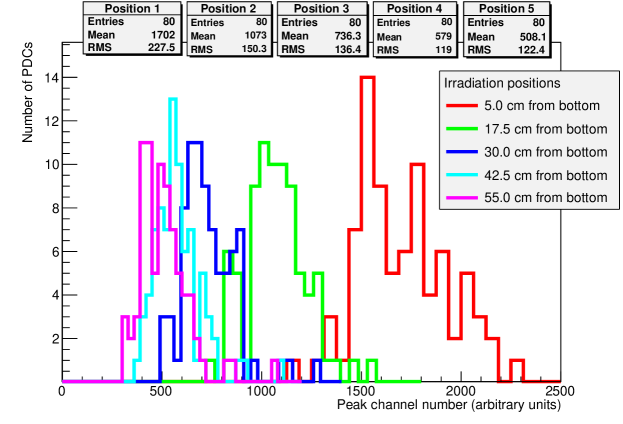
A procedure was developed to characterise PDC performance and determine which units would be used for the flight polarimeter Kiss - PhD thesis : (a) the fast plastic scintillator was irradiated from the side using 241Am (59.5 keV ); (b) the slow plastic scintillator was irradiated from the side at 5 equi-separated points using 90Sr (electrons); (c) the BGO crystal was irradiated from the side using 137Cs (662 keV ). The distribution of measured light yields are summarised in Figure 3. The typical difference in light yield at the two ends of the 60 cm long slow scintillator is approximately 75%. Previous tests showed that the variation in light yield along the length of the fast scintillator was 13% Mizuno . The position of PDCs within the polarimeter was governed by the light yield results. PDCs with the highest fast scintillator light yield were placed at the centre of the scintillator array, while units with high slow scintillator light yield were selected for the outer-most detector ring, where background is expected to be more severe. Assembled SAS units were characterised using photons from 137Cs incident on the centre point of each 20 cm long BGO crystal. The light yield was found to vary by approximately 10% over the 60 cm length of a SAS element.
Photomultiplier tube operating voltages were chosen to produce a uniform response to 59.5 keV photons photoabsorbed in the fast scintillator array. An example of a reconstructed energy spectrum is shown in Figure 4.
The plastic scintillator response to other photon energies has also been studied using synchrotron photons of various energies in the range between 6 keV and 70 keV Mizuno . Based on this data, a correction can be applied for the non-linearity of the signal amplitude as a function of energy, e.g. at 25 keV, approximately 95% of the deposited energy is detected.
The polarimeter and data acquisition electronics are housed inside an aluminium pressure vessel with 3 mm wall thickness. All vessels are purged with dry nitrogen to prevent formation of ice at low temperatures during the balloon flight. The pressurised environment (1 atm at room temperature) simplifies the thermal management and selection procedure for components. X-rays enter the polarimeter through a thin window in the pressure vessel which comprises three materials: (i) a 190 m thick PEEK (polyetheretherketone) window which provides a pressure seal; (b) a 50 m thick DuPont Tedlar light-tight window; and, (c) a 200 m thick aluminised Mylar window to reduce solar heating. The air column inside the 60 cm long slow scintillator tubes constitutes an equivalent atmospheric overburden of less than 0.1 g/cm2. The transmission through the window materials in combination with the air column exceeds 95% for 25 keV photons.
In order to meet the desired lower energy threshold for polarimetric measurements, the temperature of the photomultipliers must be actively controlled during flight in order to limit photomultiplier dark current. A fluid-based cooling system pau is used to dissipate the heat generated inside the polarimeter (110 W). The heat originates from the DC/DC converters inside the tightly-packed array of 91 photomultiplier tubes, with approximately 0.35 W expended per PMT. The remaining heat load originiates from the data acquisition electronics. Paratherm LR heat-transfer fluid is pumped through a cooling plate inside the polarimeter, which has a thermal path to each PMT. The cooling fluid is also circulated through the walls of the housing for the data acquisition electronics. Heat is dissipated as the fluid is circulated through channels in a radiator plate which is directed towards the cold sky during the flight. An overview of the polarimeter components and cooling loop is shown in Figure 5.
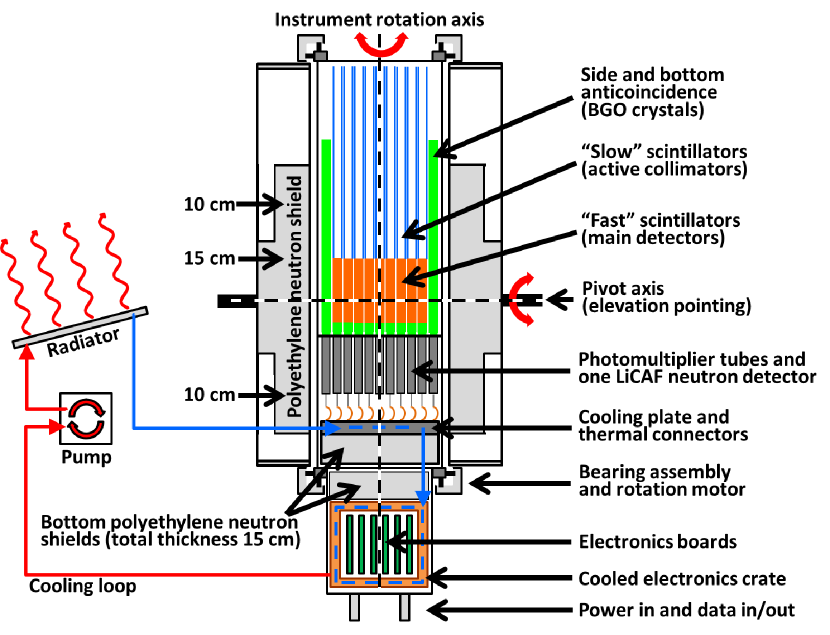
Atmospheric neutrons are the dominant background to PoGOLite measurements MKo thesis . Neutrons can fake valid Compton scattering events through elastic scattering off protons in the fast scintillators. This background is reduced by approximately an order of magnitude using a polyethylene shield surrounding the polarimeter assembly. In order to reduce the mass of polyethylene needed, the shield has a varying thickness. Its geometry was optimised using Geant4 simulations where the neutron-induced background as a function of the shield thickness and the signal-induced rate as a function of the float altitude (which is mass-dependent) were considered. The implemented shielding configuration, shown in Figure 5, has a maximum thickness of 15 cm and a total mass of 300 kg. The neutron flux in the vicinity of the fast scintillators is monitored using a custom LiCAF-based (LiCaAlF6) neutron detector LiCAF . The detector was used in an independent balloon mission to allow first studies of the high latitude stratospheric neutron environment pogolino .
3 Polarimeter data acquisition system
A schematic overview of the data acquisition electronics is shown in Figure 6.
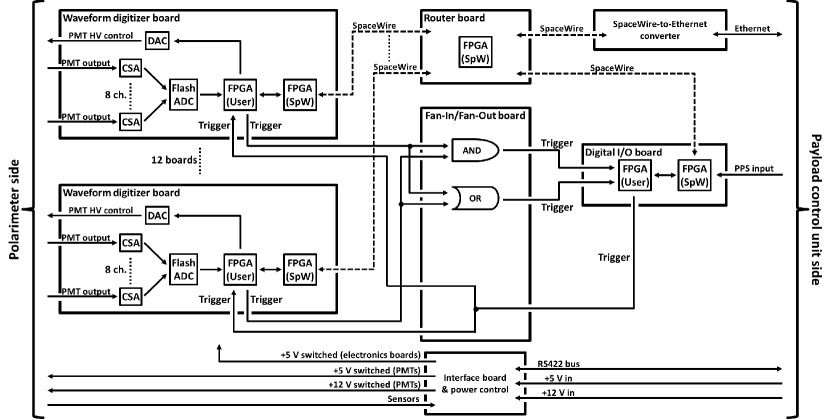
Polarimeter photomultiplier tube signals are fed into charge-sensitive amplifiers on the waveform digitizer boards, the outputs of which are continuously sampled by flash analog-to-digital converters with 12 bit precision at 37.5 MHz. For each sample, the signal amplitude is calculated as the difference between the current sample point value and the value three samples earlier. A trigger is issued if the signal amplitude exceeds a threshold level, resulting in all waveforms with an amplitude exceeding a lower hit threshold being recorded with 50 sample points during 1.3 s. The stored waveform starts approximately 0.4 s before the trigger. This allows offsets in the waveform baseline, e.g. due to large preceding signals or PMT after-pulses, to be identified when determining the signal amplitude.
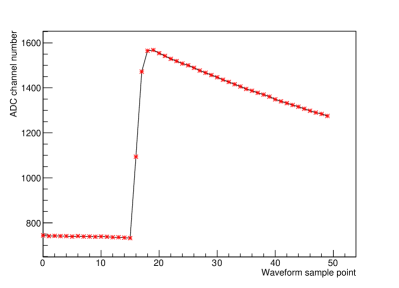
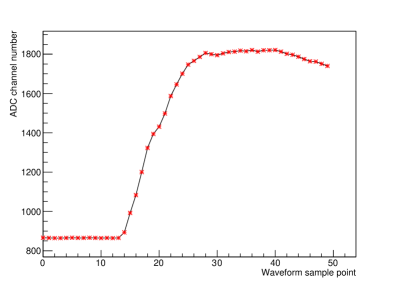
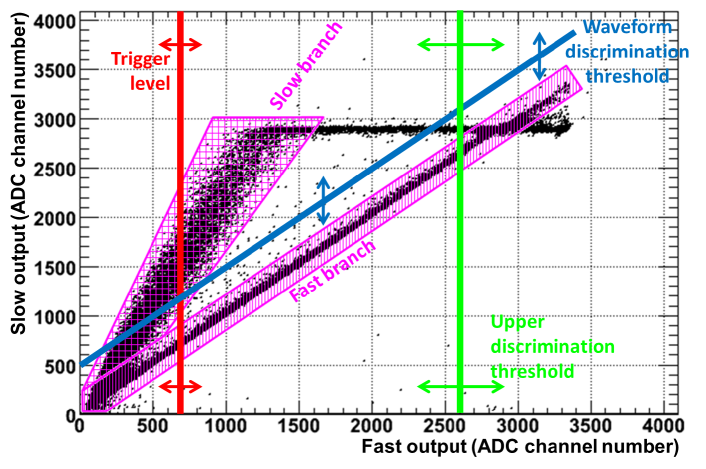
Typical waveforms from the fast scintillator and slow/BGO scintillator are shown in Figure 7. Pulse shape discrimination uses a calculated fast (slow) output amplitude defined as the maximum pulse height considered within a sliding integration window 3 (14) samples wide. Events from the fast scintillator and slow/BGO scintillator can be separated into two branches, as shown in Figure 8.
Each of the PMT input channels is subject to threshold settings, as illustrated in Figure 8. The trigger threshold defines the minimum PDC signal amplitude required to initiate data acquisition. The threshold value is set to 300 ADC channels (15 - 20 keV, depending on the PDC), i.e. compatible with a photoelectric absorption. Once a valid trigger has been received, all PDCs with a fast or slow output amplitude exceeding the hit threshold will be read out. This threshold level is conservatively set to 0.5 keV in order to accept the majority of low energy Compton events, while still rejecting electronics noise. The waveform discrimination threshold is a simple pulse shape discrimination selection, allowing slow scintillator or BGO hits to be rejected. An upper discrimination threshold (UD) is used to reject large amplitude signals, e.g. from minimum ionising cosmic rays interacting within a scintillator. In this case, data acquisition dead time (11 s) is introduced to allow the waveform baseline to recover before further triggers are accepted. Algorithms implemented in field-programmable gate arrays on the waveform digitizer boards search for signal amplitudes compatible with a trigger. If coincident waveform/upper discrimination signals from other channels are identified during a 16 clock cycle window (0.4 s) the event is vetoed, otherwise a data acquisition request is issued to all waveform digitizer boards and waveforms from all channels with a signal amplitude above the hit threshold are stored. Requiring that upper discrimination and waveform discrimination threshold conditions are fulfilled significantly reduces polarimeter dead-time and data volume. To ensure that the thresholds do not introduce a bias in the measurements, data can also be recorded without applying thresholds. This has been tested for various source and background configurations Ground calibration paper .
As well as storing the sampled waveforms, minute-wise signal amplitude histograms are recorded for each input channel with a 10 bit accuracy. The histograms are filled independently of the trigger and threshold settings for signal amplitudes above a histogram threshold (0.5 keV). These files are used to calculate e.g. the rate of saturated (UD) events or the rate of background events. After vetoes, the amount of compressed scientific data produced during a one hour Crab observation is 350 MBytes.
4 Control and data storage systems
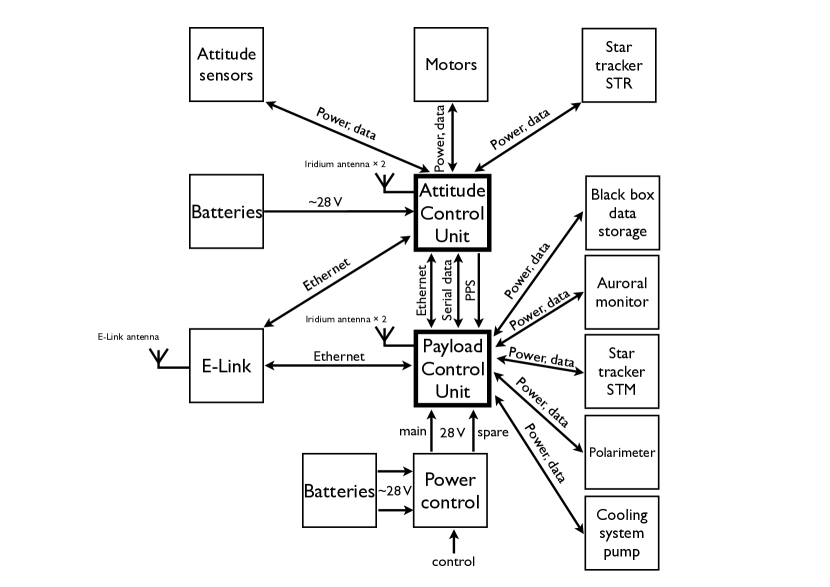
Two PC/104-standard flight control computers within the Payload Control Unit (PCU) provide redundant control of the polarimeter and other systems, as illustrated in Figure 9. A dedicated custom real-time computer provides an interface to data from the Attitude Control Unit (ACU) and controls power distribution to the polarimeter. A pulse per second (PPS) signal from a GPS unit in the ACU is read by the polarimeter data acquisition system. Receipt of this signal generates timestamped waveform data across all waveform digitizer boards which can be synchronised to absolute GPS time. The relative offset from the GPS second transition for each polarimeter event is determined using a 37.5 MHz crystal oscillator on each waveform digitizer board. The absolute polarimeter timing precision is 1 s Ground calibration paper . Communication with the flight control computers uses the ”Ethernet-over-radio”, E-Link, system E-LINK which operates while there is line-of-sight to Esrange or a relay station in Andøya, Norway. The link bandwidth (1 Mbit/s) allows all scientific data to be downloaded. The Iridium satellite communication system is used for over-the-horizon communications. The PoGOLite Pathfinder is designed to operate autonomously during the Iridium phase, determining the best suitable observation target based on parameters such as time, position, altitude and target priority Miranda . Since the Iridium bandwidth is extremely limited, 1 kbit/s, only a limited subset of processed scientific data can be downloaded. Post-flight recovery of the data storage units is therefore required for a full waveform-based analysis. Data is stored on solid state disk arrays in the PCU and in an independent data storage unit which has an inbuilt computer and provides a redundant back-up for the flight control computers. Scientific and housekeeping data are automatically synchronised between these three computers during the flight.
5 Attitude control system
A custom attitude control system keeps the viewing axis of the polarimeter aligned to the sidereal motion of observation targets and compensates for perturbations such as torsional forces in the flight-train rigging and stratospheric winds. In order to prevent performance degradation due to shadowing effects of the slow scintillator collimators onto the fast scintillator array, pointing to within 0.1∘ is required during observations Cecilia .
The polarimeter assembly is mounted in a gimbal. A number of digital direct drive torque motors JES_ESAPAC are mounted on the gimbal and used to orientate the polarimeter. One motor acts directly on the polarimeter elevation axle. Azimuthal pointing is achieved using a combination of a motor-driven flywheel system and a motor which acts upon the coupling to the flight-train rigging (which connects the gimbal to the balloon). The flywheel provides high frequency compensation, while the balloon train motor provides low frequency and static torque compensation. If the flywheel speed saturates, angular momentum can be transferred to the balloon using the flight-train motor. The use of direct drive torque motors eliminates problems with gear-box inertia and backlash. The polarimeter roll motor is controlled from the attitude control system. A standard geared motor is used, to match the moderate performance requirements and manage the high and fluctuating torque required to turn the polarimeter.
Digital control signals are passed between the motors and a real-time processor which receives inputs from a number of attitude sensors mounted on the gimbal. The absolute gondola heading is primarily determined by a differential GPS (DGPS) unit. Two antennas are separated by 10 m and the phase difference between the GPS carrier wave signals is used to determine a relative positioning of the two antennas to within 10 mm accuracy. Heading values are generated at a relatively slow rate of 20 Hz but with high accuracy, 0.05∘. A three-axis magnetometer is used as a back-up heading sensor, with an accuracy of a few degrees. The elevation of the polarimeter is gauged with an accuracy better than 0.01∘ with respect to the gimbal structure by encoders mounted on the elevation axle. An inclinometer is mounted on the gimbal to measure the absolute attitude of the gondola with respect to the gravity of the Earth. An Intertial Measurement Unit (IMU) is used to correct for high frequency disturbances coming from the balloon train, friction and cabling. The IMU comprises three orthogonally oriented micromechanical gyro sensors and accelerometers mounted on the polarimeter elevation axis. Algorithms implemented in the IMU firmware use a combination of inputs from all other attitude sensors to compute a wide bandwidth high accuracy attitude estimate.
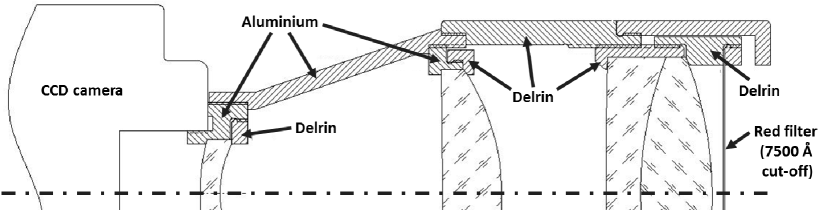
The polarimeter field-of-view is positioned on the star-field of interest using signals from the DGPS and IMU to close the attitude control loop. The star fields are imaged by two star trackers, “STM”, narrow field-of-view, and “STR”, wide field-of-view, . The STM star tracker Cecilia is based on a flight-proven design BLAST Dietz . The STR star tracker is significantly more compact and light-weight than the STM, and is foreseen to be used for future balloon campaigns. STR uses the same 1392 1024 pixel CCD camera as STM, but has a custom temperature-compensated fixed-focus design LODAC . The design concept is illustrated in Figure 10. To protect the CCD cameras during pointing operations, both star trackers are equipped with mechanical shutters triggered automatically by photo-diodes if the polarimeter is inadvertently pointed at the Sun.
The desired pixel position of a guide star is calculated based on the gondola location, time and observation target coordinates. Using pixel values from a small part of the CCD image the measured guide star position is used to close the attitude control loop. Stability constraints, hot-pixel maps and neighbouring pixel values are used to filter erroneous pixel readings, caused, for example, by cosmic rays. For Crab observations, the guide star is HIP 26451 (visual magnitude M=2.95) for STR and HIP 26328 (M=7.00) for STM.
6 Gondola
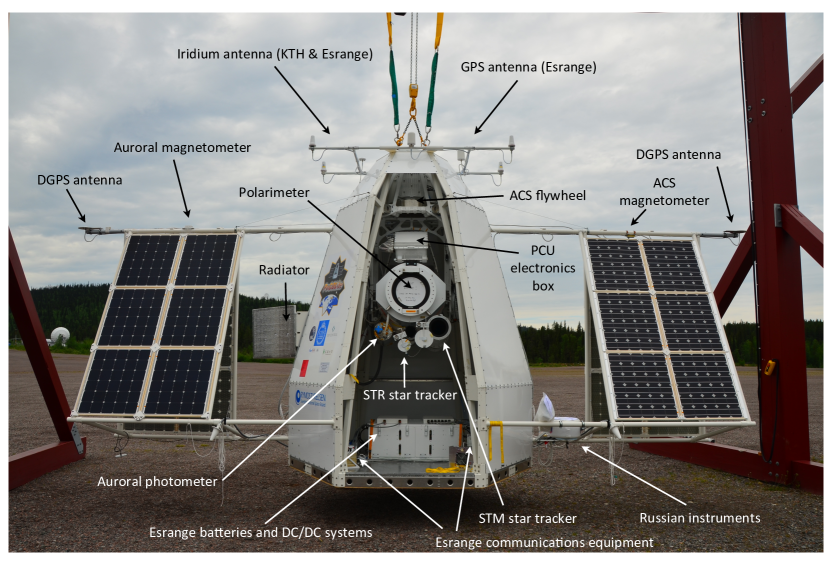
The gimbal is mounted inside a gondola structure developed by SSC Esrange Space Centre, as shown in Figure 11. The gondola reduces the solar flux incident on the polarimeter and ancillary equipment and protects the polarimeter from damage during landing. The gondola comprises a tubular aluminium structure covered in composite honeycomb panels which affords a light-weight but rigid structure able to withstand the 10 G shocks expected during parachute deployment and landing. Solar panels are located on each side of the gondola (forward and backward-facing), giving a total area of 12 m2 on each side, providing approximately 1 kW charging power at float altitude. The overall width of the gondola is 10 m, for a total height of 5 m. The suspended weight is approximately 1850 kg (excluding ballast), which breaks down as (i) polarimeter, 600 kg; (ii) attitude control system including gimbal, 300 kg; (iii) and gondola, including power supply, solar panels, communications and ancillary equipment, 950 kg. The gondola is suspended approximately 100 m under a helium-filled polyethylene balloon with a volume of 1.1 Mm3, corresponding to a fully inflated diameter of approximately 150 m. Neither the gondola or balloon occludes the polarimeter field-of-view during observations up to an elevation of 60∘.
7 The 2013 near-circumpolar flight
7.1 Flight overview
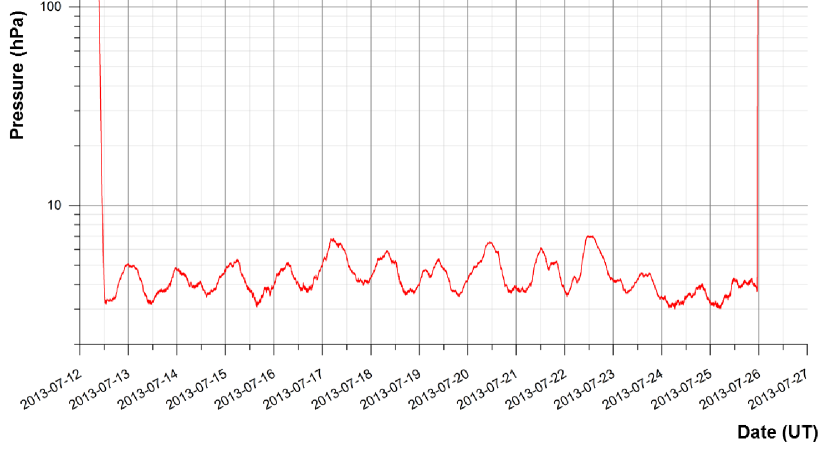
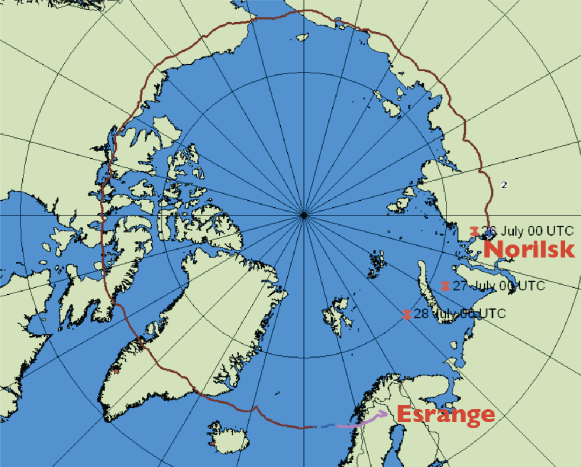
The PoGOLite Pathfinder balloon campaign was conducted at the Esrange Space Centre (68.89∘ N, 21.11∘ E), near the Swedish town of Kiruna. Towards the end of May, stratospheric winds start to flow in a westerly direction, providing long duration flight opportunities until the stratospheric winds start to break down at the end of July. The launch window for PoGOLite opens on July 1st when the angular separation between the Sun and Crab exceeds 15∘. On July 12th, at 08:18 UT, the PoGOLite Pathfinder was successfully launched on a planned full circumpolar flight. The ascent to float altitude, 39.9 km, took approximately five hours. Observations cycled between the Crab and Cygnus X-1, which was not in the required hard state but allowed observation conditions for possible future flights to be studied. While passing over Russia, the stratospheric winds started to move in a northerly direction. Predictions based on the balloon position, airspeed and direction indicated that the balloon would pass north of Scandinavia. The flight was therefore terminated near Norilsk, 3000 km East of Moscow, where infrastructure was available for the gondola recovery. The gondola was cut from the balloon at 23:24 UT on July 25th. Ambient pressure measured throughout the flight is presented in Figure 12 and the balloon trajectory is shown in Figure 13. The polarimeter assembly and data storage units were returned to Stockholm on January 21st 2014. Inspection of the polarimeter indicated that no significant damage had incurred during flight termination or transport.
7.2 Thermal environment
The thermal environment during summer circumpolar stratospheric balloon flights is characterised by solar illumination which is continuous but variable. Due to the low ambient pressure the primary heat transfer mechanism is radiation. A full treatment of the thermal environment requires solar radiation, the albedo heat flux from the Earth, coupling to the balloon, radiation to space and convection effects to be taken into account. During ascent, temperatures of 40 ∘C were experienced during passage through the tropopause at an altitude of 15 km. Once at float altitude, the thermal environment for the polarimeter systems is primarily dictated by the azimuthal pointing of the gondola. During observations of the Crab, the gondola opening is directed towards the Sun. Observations of Cygnus X-1 are in the anti-Sun direction. The temperature of a gondola wall was measured to be 85 ∘C while solar-illuminated and 10 ∘C while in eclipse privESC .
During Crab observations, the polarimeter and PCU box are exposed to solar radiation. The polarimeter heating time constant is relatively long due to the shielding effects of the thick polyethylene shield and the reflective Mylar window placed over the polarimeter aperture. The polarimeter fluid cooling system ensured that data acquisition electronics and photomultiplier temperatures remained within specification. During a Crab observation, the temperature of the waveform digitizer boards was found to increase by 15 ∘C, which affected the performance of the charge sensitive amplifiers as discussed in section 7.4. The photomultiplier temperature increased by 8 ∘C. The effect on the photomultiplier gain can be gauged and compensated for by studying the position of the single photoelectron peak. BGO scintillator temperatures in the side anticoincidence system were observed to increase by 10∘C. The corresponding decrease in light yield of 12% has negligible effect on the efficiency of the anticoincidence shield considering the threshold settings adopted. The temperature-induced change in the scintillation light decay time also has no effect. While the close packed array of plastic scintillators was not equipped with temperature sensors, the temperature dependence of plastic scintillator light yield is relatively weak – at 60∘C, the light yield is 95% of that at 20∘C.
The PCU box is painted white to reflect incoming solar radiation, but unlike the polarimeter, it is not actively cooled. The thermal design of the PCU proved inadequate since the flight control computers overheated during Crab observations which significantly complicated operations. This problem could, however, be partly offset by rotating operations between the flight control computers and the data storage computer located on the gondola floor (also prone to overheating when solar-illuminated). After the third Crab observation, on July 14th, the power to the polarimeter control system was cycled in order to return to a well-defined state after overheating issues. This resulted in a failure of the real-time computer system in the PCU and polarimeter operations were no longer possible. Post-flight analysis revealed that the computer file system had become corrupted (unrecoverable during flight). Sensor data showed that the failure was not temperature related. The ACU can be operated independently from the PCU, which allowed pointing operations to continue.
7.3 Attitude control system performance
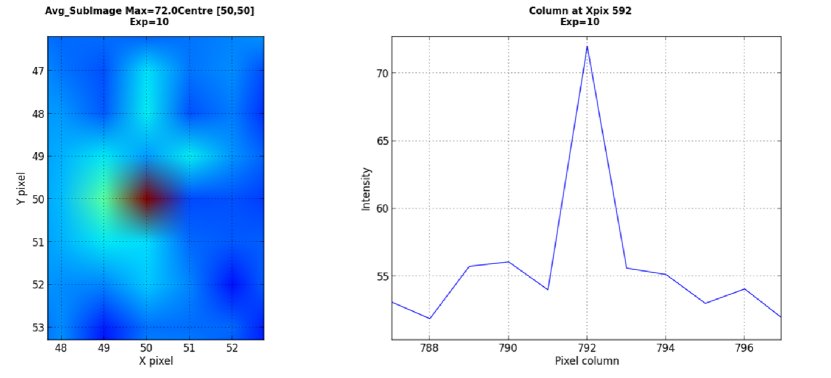
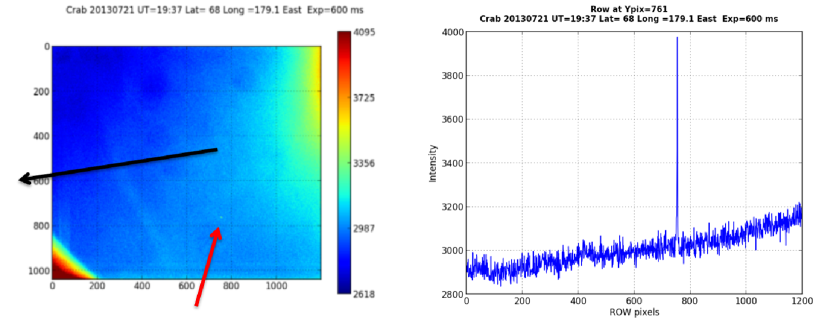
During observations of the Crab, star tracking is complicated by the relatively small angular distance to the Sun111Future flights are likely to use the Sun itself as a tracking target. Star trackers were originally foreseen for a one day long maiden flight of PoGOLite planned for August and were retained when a long duration flight was pursued instead.. The performance of the star trackers depends on, e.g., image focus, gondola stability and exposure time. By co-adding images with short exposure time the gondola movement becomes negligible. As shown in Figure 14, the image point-spread function is symmetric, indicating that gondola motion and not focus ultimately dictates image quality. This shows that the temperature-compensating mechanical structure shown in Figure 10 is working adequately. An example of a representative 600 ms exposure STR image and a pixel intensity scan are shown in Figure 15 for a Crab observation at 36.5 km altitude on July 21st 2013, at 19:37 UT. The pixel intensity map is dominated by background and stray light. A three-point criterion is used to identify stars in the CCD image. At least three adjacent pixel intensity values in both horizontal and vertical directions must exceed the noise level to be identified as a star, with the highest value required for the central pixel. Despite the severe image gradient, this method allows a magnitude 3.0 guide star to be clearly identified.
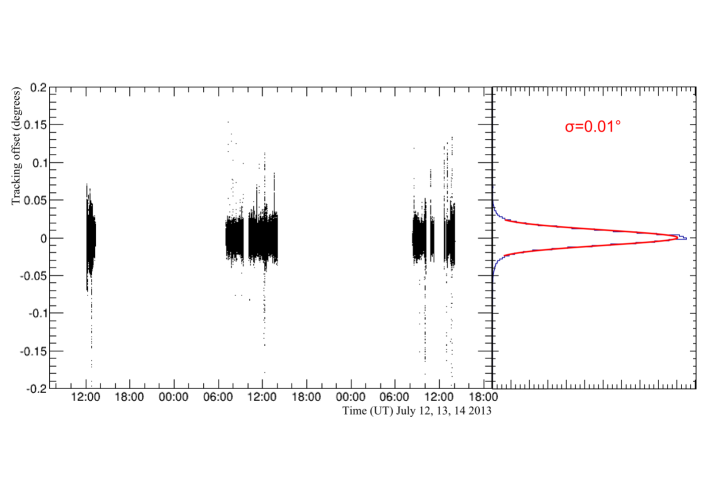
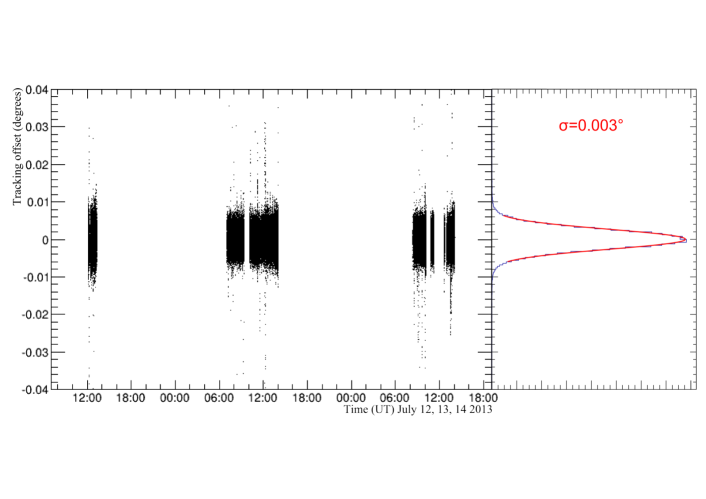
Although difficulties were experienced during star tracking, e.g. spurious reflections within the baffle assembly due to the proximity of the Sun to the star field or disturbances from passing satellites, the performance of the attitude control system was found to significantly exceed the design requirement. The time dependent and integrated angular offset between the polarimeter pointing and the Crab set-point, is shown in azimuth and elevation in Figure 16 for all Crab observations. The pointing accuracy is found to be an order of magnitude better than the design requirement in both elevation and azimuth.
7.4 Observations
Three Crab observations were made in the period July 12th-14th 2013 for a total observation time of 549 minutes with a reconstructed pointing direction within 0.1∘ of the Crab direction. The atmospheric column density during observations is shown in Figure 17, yielding a time-averaged column density of 5.7 g/cm2. At 30 keV (100 keV), the corresponding transmission probability is 13% (41%).
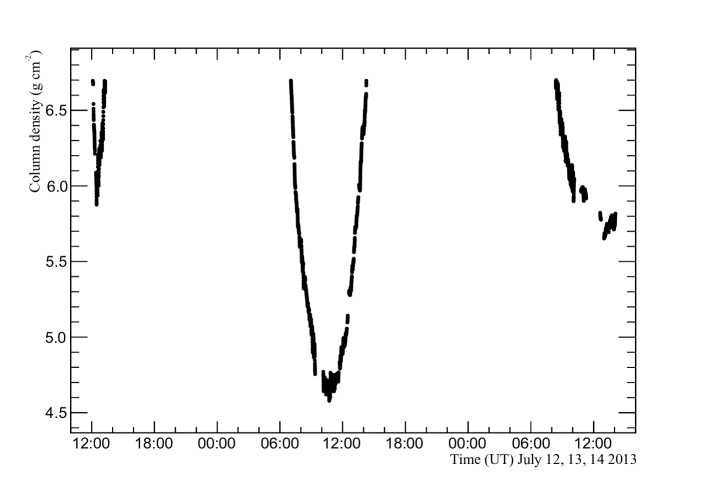
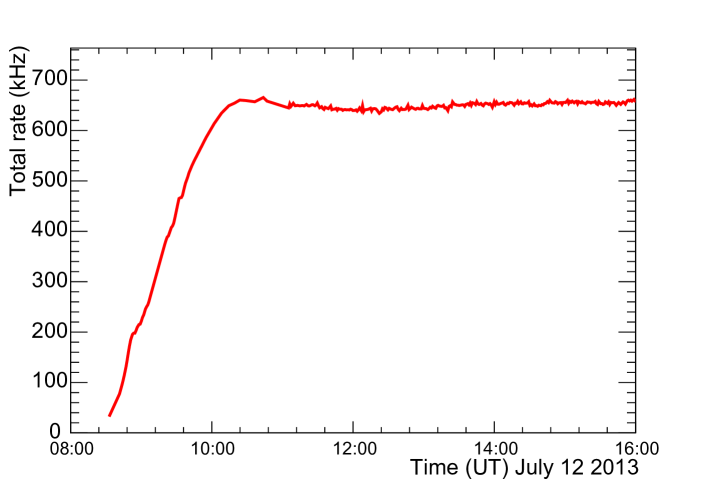
Figure 18 illustrates the challenging background environment. The total PDC count rate (histogram data, 0.5 keV) rapidly increases during ascent to float altitude before stabilising at around 650 kHz. The corresponding total counting rate (10 keV) for the side anticoincidence system is 300 kHz. The online veto system is used to reject background interactions, resulting in a manageable two-hit counting rate which forms the basis for polarisation measurements.
After applying the online veto system (described in Section 3), the two hit counting rate is 84 Hz for an expected Crab two hit rate of 2 Hz.
Data reduction techniques developed for on-ground calibration tests Ground calibration paper needed to be complemented in order to achieve an acceptable signal-to-background performance for flight conditions. The temperature increase experienced by the waveform digitiser boards during Crab observations (see Section 7.2) affected the dynamic range of the charge-sensitive amplifiers depicted in Figure 6. A temperature dependent correction was therefore applied to waveform data in order to recover the correct baseline level. Pre-trigger sample points could then be reliably used to reject events with variable baselines, e.g. due to preceding large signals or photomultiplier after-pulses. Additionally, fake two-hit polarisation events including a scattering from a slow scintillator collimator to a fast scintillator in the same PDC resulted in super-imposed waveforms which were difficult to reject due to the relatively low amplitude signal from the slow scintillator. A Principal Component Analysis (PCA) method was developed to reject such events. Waveforms were characterised using ten variables, e.g. the fast and slow output values, the peak value of the waveform, the number of sample points in the waveform rise and the starting sample point of the rise. The PCA method allows this multivariate (ten dimensional) approach to be reduced to a pair (two dimensions) of uncorrelated components. Two dimensional selections were placed on the resulting principal and secondary components after performing a basis transformation. A standard selection on the fast branch, as described in Section 3, was also applied.
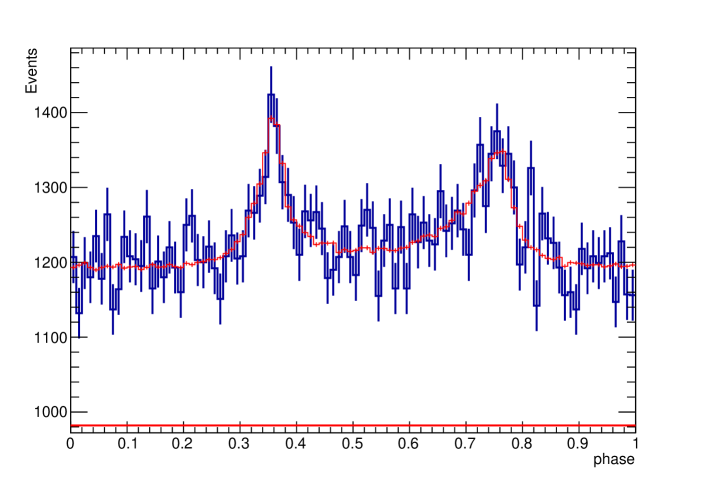
Selections in the resulting two-dimensional plane are iteratively evaluated by minimising an established figure-of-merit for X-ray polarimeters, the Minimum Detectable Polarisation (MDP) MDP which is sensitive to the signal-to-background ratio in observations. The quality of the barycentred pulsar light-curve is also considered using the H-test statistic de Jager 1 & 2 . Neither of these metrics are related to polarisation observables such as the modulation curve. The H-test statistic is well suited to data with a low signal-to-background ratio and does not require a priori assumptions regarding the shape of the pulsed distribution. Periodicity was searched for in a narrow band around the known Crab pulsar spin period Jodrell Bank . For final selections, a H-test statistic of 1.5 () was determined for background observations, compared to 132 () for all Crab observations, where is the probability that the observed periodicity would arise purely from statistical fluctuations. The reconstructed light-curve is shown in Figure 19. Polarimeter events with reconstructed energy within the range 25 - 110 keV are used. This light-curve is compared to that derived from the Suzaku hard X-ray detector Suzaku HXD over a comparable energy range: 10 - 70 keV. Since the signal-to-background ratio of the Suzaku measurement is known, a pure signal reference light-curve can be obtained. By fitting this reference light-curve, diluted by an appropriate fraction of background, the PoGOLite signal-to-background ratio is found to be 0.250.03. The Crab M100 is determined as (21.41.5)%, and the MDP for all Crab observations is (28.42.2)%.
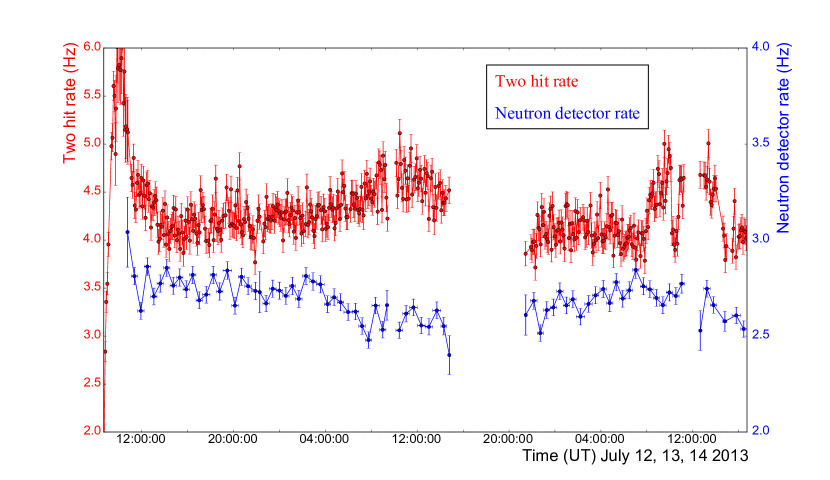
The time evolution of the two hit rate is shown in Figure 20 and confirms the light-curve signal-to-background prediction. Data from the LiCAF-based neutron detector can be used to gauge relative changes in the dominant background due to atmospheric neutrons. The decrease in neutron background coincident with the second Crab observation (July 14th) is confirmed by a background model MKo paper based on the gondola altitude, longitude and solar activity estimated from ground-based neutron monitor data.
8 Discussion and outlook
The primary aim of the PoGOLite Pathfinder mission is to evaluate the experimental approach chosen to measure the polarisation of hard X-ray emissions from the Crab. During the 14 day long flight, three Crab observations were completed before the polarimeter control system failed. Observations were hampered by an inadequate thermal design of the polarimeter control electronics which significantly reduced the observation time. These issues are the focus of a post-flight engineering review. A pointing precision in both azimuth and elevation of one order of magnitude better than the design goal was achieved. Signal from the Crab was unambiguously detected for a signal-to-background ratio of 0.250.03. In the PoGOLite energy band, the Crab polarisation fraction is likely to lie below the MDP. A polarisation measurement is still possible but requires the development of a method to deal with the resulting non-Gaussianities in the determination of polarisation parameters resulting from measuring a positive-definite quantity close to the limit of observability. Such a method and a polarisation result will be presented in a future publication.
A 5 day duration flight to Canada is used as a baseline for possible future flights. For the current polarimeter design, the expected Crab minimum detectable polarisation (MDP) for such a flight is 20%, using the flight conditions experienced in 2013 (e.g. altitude profile, signal-to-background performance). The observation time takes into account a 50% duty cycle due to off-Crab (5∘ in azimuth) observations in order to measure background (not possible during the 2013 flight due to over-heating issues). Using data from the Pathfinder flight, a number of improvements to the polarimeter design have been identified in order to improve this performance.
-
•
Post-flight calibration tests Ground calibration paper revealed unintentional leakage of scintillation light between PDCs. Although the magnitude of the effect is small, it degrades polarimetric response significantly, e.g. M100 reduces by approximately a third. It is straight-forward to address this issue once the PDCs are removed from the polarimeter. The application of new reflective wrapping materials will also improve the PDC light-yield and further improve the performance, especially for low deposited energies.
-
•
For the flight data, waveforms were found to be distorted due to low energy deposits in the slow scintillator which could not be separated from fast scintillator signals. The slow plastic scintillator collimator will therefore be replaced with a purely passive collimator comprising (from inside to outside) copper, tin and lead.
-
•
The fast scattering scintillators will be shortened to 12 cm in length in order to reduce the target volume for background neutron interactions while not affecting efficiency for source X-ray detection. As a by-product, the light-yield will be improved.
-
•
The neutron shield will be further optimised, e.g. reducing gaps in the shielding during integration of the polarimeter.
A re-flight of an upgraded polarimeter has been proposed for summer 2016 from Esrange in order to make polarimetric studies of the Crab (and Cygnus X-1, if possible) with a significant improvement in performance compared to the 2013 flight. For a 5 day flight (assuming 2013 flight conditions) with multiple Crab exposures, the resulting MDP is significantly improved at 8.2%. It is illustrative to consider the expected performance of the ’full-size’ PoGOLite concept with 217 PDCs. For an equivalent flight, the MDP can be conservatively expected to improve by a factor , where is the collecting area. The resulting MDP prediction is 4.3% for 1 Crab sources (15-20% estimated for 200 mCrab sources). It is however noted that there are major engineering challenges to address before a larger polarimeter can be constructed. For example, the current gondola mass of 1850 kg is close to the limit for the 1.1 Mm3 balloon used - the largest currently available.
Acknowledgements.
The PoGOLite Collaboration acknowledges funding received from The Swedish National Space Board, The Knut and Alice Wallenberg Foundation, The Swedish Research Council and the Göran Gustafsson Foundation. The SSC Esrange Space Centre is thanked for their considerable support and expertise during the launch build-up and flight campaign of the PoGOLite Pathfinder. The government of the Russian Federation is thanked for permitting a circumpolar flight. Tim Thurston designed the PoGOLite mechanics which was primarily manufactured by the workshop at AlbaNova University Centre. Gilles Bogaert provided VM2000 for the scintillator array. All past members of the PoGOLite Collaboration not listed as authors on this paper are thanked for their important contributions to the development of the project.References
- (1) F. Lei et al., Space Science Reviews 82 (1997) 309.
- (2) T. Kamae et al., Astroparticle Physics 30 (2008) 72.
- (3) M. Axelsson et al., Astroparticle Physics 28 (2007) 327.
- (4) M. C. Weisskopf et al., Astrophysical Journal 208 (1976) 125. R. Novick et al., Astrophysical Journal 174 (1972) 1. M. C. Weisskopf et al., Astrophysical Journal 220 (1978) 117.
- (5) M. Forot et al., Astrophysical Journal 688 (2008) 29. A.J. Dean et al., Science 321 (2008) 1183. M. Chauvin et al., Astrophysical Journal 769 (2013) 137.
- (6) M. Chauvin et al. Astroparticle Physics 72 (2016) 1.
- (7) F. Kislat et al., Astroparticle Physics 68 (2015) 45.
- (8) T. Mizuno et al., Nuclear Instruments and Methods A 540 (2005) 158. Y. Kanai et al., Nuclear Instruments and Methods A 570 (2007) 61.
- (9) M. Kiss, ’Pre-flight development of the PoGOLite Pathfinder’. KTH Royal Institute of Technology Doctoral Thesis (2011). ISBN: 978-91-7415-896-0.
- (10) T. Mizuno et al., Nuclear Instruments and Methods A 600 (2009) 609.
- (11) P. Mallol, ’A cooling system for PoGOLite – a balloon-borne soft gamma-ray polarimeter’. KTH Royal Institute of Technology Master’s Thesis (2009).
- (12) M. Kole, ’Background Studies for the Balloon-Borne Hard X-ray Polarimeter PoGOLite’. KTH Royal Institute of Technology Doctoral Thesis (2014). ISBN: 978-91-7595-337-3.
- (13) H. Takahashi et al., IEEE Nuclear Science Symposium conference record (2011) 32.
- (14) M. Kole et al., Nuclear Instruments and Methods A 770 (2015) 68.
- (15) ESA SpaceWire home page, http://www.spacewire.esa.int.
- (16) L.-O. Jönsson, Proceedings of the 19th ESA Symposium on European Rocket and Balloon Programmes and Related Research (2009).
- (17) M. S. Jackson, Journal of Instrumentation 8 (2013) P04008.
- (18) C. Marini Bettolo, ’Performance Studies and Star Tracking for PoGOLite’. KTH Royal Institute of Technology Doctoral Thesis (2010). ISBN: 978-91-7415-641-6.
- (19) J.-E. Strömberg, Proceedings of the 19th ESA Symposium on European Rocket and Balloon Programmes and Related Research (2009).
- (20) M. Rex et al., Proceedings of SPIE – The International Society for Optical Engineering 6269 (2006) 6269H-1.
- (21) K. L. Dietz et al., Optical Engineering 41 10 (2002) 2641.
- (22) Lindblom Optic Design And Consulting, Varmfrontsgatan 18, 128 34 Skarpnäck, Sweden.
- (23) Private Communication, SSC Esrange Space Centre (2013).
- (24) M. C. Weisskopf et al., Proceedings of SPIE – The International Society for Optical Engineering 7732 (2010) 77320E.
- (25) O. C. de Jager et al., Astronomy & Astrophysics 221 (1989) 180. O. C. de Jager & I. Büsching, Astronomy & Astrophysics 517 L9 (2010).
- (26) A. G. Lyne et al., Monthly Notices of the Royal Astronomical Society 265 (1993) 1003. Data available at http://www.jb.man.ac.uk/~pulsar/crab.html.
- (27) T. Takahashi et al., Publications of the Astronomical Society of Japan 59 (2007) S35.
- (28) Suzaku Public Data (dataset 104001070). Data available at http://www.darts.isas.jaxa.jp/astro/suzaku/public_seq.html.
- (29) M. Kole et al., Astroparticle Physics 62 (2015) 230.