11email: h.deruiter@ira.inaf.it, parma@ira.inaf.it, r.fanti@ira.inaf.it, c.fanti@ira.inaf.it
Far-UV to mid-IR properties of nearby radio galaxies
Abstract
Aims. We investigate whether the far-UV continuum of nearby radio galaxies is due solely to the parent galaxy that passively evolves, or if it reveals evidence for the presence of other star-forming or non-stellar components. If the UV excess is due to an additional radiation component, we compare this with other properties such as radio power, optical spectral type (e.g. high- and low-excitation galaxies), and the strength of the emission lines. We also discuss the possible correlation between the ultra-violet flux, IR properties, and the central black hole mass.
Methods. We used a sample of low-luminosity B2 radio galaxies and a small sample of higher luminosity 3C radio galaxies at comparable redshift (). Spectral energy distributions (SEDs) were constructed using a number of on-line databases that are freely available now: GALEX, SDSS, 2MASS, and WISE. These were compared with model SEDs of early-type galaxies with passively evolving stellar populations at various ages (typically years). We established whether a second component was needed to obtain a satisfactory fit with the observed overall SED. We introduce the parameter , which measures the excess slope of the UV continuum between 4500 and 2000 Å with respect to the UV radiation produced by the underlying old galaxy component.
Results. We find that the UV excess as measured by is usually small or absent in low-luminosity (FR I) sources, but sets in abruptly at the transition radio power, above which we find mostly FRII sources. behaves very similarly to the strength of the optical emission lines (in particular ). Below WHz-1 is close to zero. correlates strongly with the line strength, but only in sources with strong emission. We discuss whether the line emission might be due to photoionization by radiation from the parent galaxy, possibly with additional star formation, or if it requires the presence of a non-stellar AGN component. and the slope of the mid-IR are strongly correlated, as measured by the WISE bands in the interval 3.4 to 22 m, in the sense that sources with a strong UV excess also have stronger IR emission. There is an inverse correlation between and central black hole mass: the of objects with strong UV excess is on average two to three times less massive than that of objects without UV excess. Low-luminosity radio galaxies tend to be more massive and contain more massive black holes.
Key Words.:
galaxies: active - galaxies: photometry - radio continuum: galaxies - ultraviolet: galaxies - infrared: galaxies1 Introduction
Ever since the classical paper of Fanaroff & Riley (fanaroff74 (1974)), we know that radio galaxies can be divided into two different types according to whether they are of low or high radio luminosity, the dividing line being at approximately WHz-1 at the frequency 1.4 GHz, but weakly dependent on the absolute magnitude of the parent galaxy (Ledlow & Owen ledlow96 (1996); see also Ghisellini & Celotti ghisellini01 (2001)). This difference manifests especially in the morphology (which was the basis of the distinction of the two FR classes), the low-luminosity sources have a relaxed overall radio structure without hot spots at the end of the radio jets or lobes, for example, while this feature is usually present and even characteristic in high-luminosity sources. The reason for the FR division was unknown, but there is now growing evidence that both the fuelling mechanism and the merging history may play significant roles (Evans, Hardcastle & Croston evans08 (2008); Hardcastle, Evans & Croston hardcastle07 (2007); Saripalli saripalli12 (2012)).
High-luminosity radio sources have a significant influence on the parent radio galaxy. The radio jets plough their way through the interstellar medium, which may be excited or even ionized by them, and indeed the bulk kinetic energy of the jets correlates strongly with the luminosity of the narrow emission lines (Rawlings & Saunders rawlings89 (1989)). The nuclear activity itself may also be at the origin of the emission spectrum, consisting of both lines and a continuum. It is much less clear if there is significant interaction (if at all) between a low-luminosity radio source and its parent galaxy.
This strong dichotomy in the optical properties of radio galaxies approximately follows the division into the two Fanaroff-Riley (FR) classes and is also related to the accretion mechanism (see for a general discussion Best & Heckman best12 (2012)). Emission lines in radio galaxies have been studied by a number of authors (e.g. Zirbel & Baum zirbel95 (1995); for some more recent articles see Buttiglione et al. 2009a , Buttiglione et al. 2009b , Baldi & Capetti baldi09 (2009), and Buttiglione et al. buttiglione10 (2010)). It has been known for a long time that strong emission lines occur in the more powerful radio galaxies, while the weaker FRI galaxies tend to have emissionless spectra identical to those of the ordinary early-type galaxies. Different accretion rates for FRI and FRII sources were proposed by Ghisellini & Celotti (ghisellini01 (2001)); they noted that high-excitation radio galaxies (HERGs) typically accrete at about 1-10 % of the Eddington rate, while low-excitation radio galaxies (LERGs) accrete at much lower rates ( %). At high radio luminosities, HERGs are dominant, although both types can occur at all radio luminosities (Best & Heckman (best12 (2012)). It appears that the high-excitation galaxies have on average a lower stellar mass and lower central black hole mass than the more massive galaxies that are associated with the low-excitation mode, while the latter are frequently associated with hot X-ray haloes.
Allen et al. (allen06 (2006)) have suggested that accretion in LERGs in the centre of clusters may proceed directly from the hot phase of the intra-cluster medium. This view was supported by Hardcastle, Evans & Croston (hardcastle07 (2007)), who suggested that LERGs may be powered by the hot X-ray emitting gas, while HERGs also need a cold gas component. However, very often circumnuclear dusty disks can be clearly seen in HST images of low-luminosity B2 and nearby 3C radio galaxies (Capetti et al. capetti00 (2000); de Ruiter et al. deruiter02 (2002); Verdoes-Kleijn et al. verdoes99 (1999); de Koff et al. dekoff00 (2000)). Moreover, CO has been detected in many nearby FRI radio galaxies (Prandoni et al. prandoni07 (2007), prandoni10 (2010); Lim et al. lim03 (2003); Leon et al. leon03 (2003); Ocaña Flaquer et al. oca10 (2010)). The molecular gas often appears to be in dusty disks around the nucleus. According to de Koff et al. (dekoff00 (2000)), the dust masses found in FRI galaxies tend to be higher than those seen in a sample of ordinary (i.e. optically selected) elliptical galaxies studied by van Dokkum & Franx (vandok95 (1995)).
Recent technological developments have led to the creation of large-scale optical surveys with correspondingly large data bases, extending from the infrared to the far-ultraviolet. This makes it possible to study the overall spectral energy distributions and spectral lines of many well-known sets of objects. In particular, the GALEX survey provides photometric data in the hitherto inaccessible far-UV part of the spectrum, enabling us to study the behaviour of FRI and FRII radio galaxies in that range of the spectrum. This is our topic here: we analyse the optical spectral energy distributions of parts of the B2 and 3C samples of radio galaxies and try to shed some more light on the interrelation between radio and optical properties, by fitting the spectral energy distribution (SED; in the range Å to ) with synthetic galaxy models (Bruzual & Charlot bruzual03 (2003)) and analysing the deviations in the fit.
We also compare the UV and IR properties; in particular, we investigate the mid-IR using data collected from the WISE mission (Wright et al. wright10 (2010)) and in a limited number of cases also the FIR. The relevant literature for mid- and far-IR data is briefly discussed in Sect. 2, in which we describe how the optical photometry and spectroscopy were collected, using the on-line data bases of GALEX, SDSS, and 2MASS and the galaxy models of Bruzual & Charlot (bruzual03 (2003)) to check whether any more components are necessary, other than some model of an early-type galaxy. We present the results in Sect. 3, where we also investigate the (optical) spectral line properties of the galaxies and their possible relation to the radio properties.
Finally, in Sect. 4 we discuss the results obtained in this paper and list our conclusions.
Unless explicitly stated, all intrinsic parameters were calculated using a concordance cosmology with and km s-1Mpc-1.
2 Data selection and galaxy model fitting
As the basis for our analysis, we selected two samples of low-redshift () radio galaxies in the area covered by the SDSS: first, B2 radio galaxies (Fanti et al. fanti87 (1987); de Ruiter et al. deruiter90 (1990)). They are mostly low-luminosity FR I sources identified with early-type galaxies. Second, a sample extracted from the 3CR catalogue (Laing, Riley & Longair laing83 (1983)). There is some overlap between the B2 and 3C samples: the sources in common are 3C 293 (B2 1350+31), 3C 310 (B2 1502+26), 3C 315 (B2 1511+26), 3C 332 (B2 1615+32), and 3C 357 (B2 1726+32). The majority of the 3C sources have a higher radio luminosity and are mostly FR II. A number of the 3C sources have been observed in the ultraviolet as part of an HST snapshot survey of 3CR radio galaxies (Allen et al. allen02 (2002)).
Thanks to the impressive developments in optical surveys, it is now possible to obtain, for many objects at least, accurate photometric data ranging from the far-UV to the near-IR. Thus it is quite easy now to compare the photometry with model SEDs and investigate whether, apart from a ”normal” SED, any signs of other components are present that might be linked to the radio activity. Fanti et al. (fanti11 (2011)) performed a similar study to the one presented here, in their case of compact steep spectrum (CSS) radio sources. We basically follow their method.
Although information on the photometric parameters can be recovered directly from the respective GALEX, SDSS, 2MASS and WISE sites111URLs are given in the acknowledgments. , we summarize them here in Table 1 for easy reference. The SDSS does not cover the whole northern sky yet, which is why only 68 (of which 6 are FR II) B2 sources (out of the 101 in the entire sample) can be used here, while the 3C is restricted to 14 sources, of which 8 are FR II. Virtually all of these sources have infrared data. However, not all have UV data, either because they are too faint or because no GALEX data are available. Nevertheless, the remaining sources constitute a sample that is large enough to allow a more detailed statistical investigation. The selection is random, and the final sample used here should therefore be unbiased.
|
The photometric data were converted into luminosity using the redshift of the sources (for the B2 sources see, e.g., Fanti et al. fanti87 (1987); de Ruiter et al. deruiter90 (1990)) and following the various recipes given in the on-line web sites of the SDSS, GALEX, and 2MASS surveys. More details on the SDSS seventh data release (used here) can be found in Abazijian et al. (abazijian09 (2009)). The GALEX mission is described in Martin et al. (martin05 (2005)); we took the UV extinction coefficients from Wyder et al. (wyder07 (2007)). For an object to be included in our analysis of the UV properties, we obviously required that it is detected in at least one of the two UV bands of GALEX, but even if GALEX data were not available, we could in a few cases use such objects in some of the correlations, for instance, radio power against spectral properties.
Near-IR data were extracted from the 2MASS survey (see Skrutskie et al. skrutskie06 (2006)); these exist for virtually all objects in our samples. In a minority we noticed that the 2MASS values lie systematically slightly higher (or even much higher in the case of 3C 274) than expected on the basis of an extrapolation of the SDSS magnitudes (and in one case, B2 1502+26, alias 3C 310, much lower), although the slope of the SED is consistent with the extrapolation. This is expected because the galaxies are usually quite extended, and the algorithms that are used to derive the magnitudes in different surveys may sometimes lead to small systematic offsets. We stress, however, that the overall consistency of the photometric data from the UV to the IR is quite satisfactory.
Additional mid- and far-IR data were collected for a number of sources. These cover the range 3-200 m, but neither IR data collected from the WISE mission nor other mid- to far-IR data were used in fitting galaxy models. The reason for this is that other components start to dominate the SED above m, which is different from the stellar population. The MIR-FIR range can be easily explained by emission of dust. We applied some plausible models based on Hildebrand (hildebrand83 (1983)) and Knapp, Bies, & van Gorkom (knapp90 (1990)). We discuss the IR in more detail below.
For almost all B2 and 3C sources considered here, data collected by the WISE mission are available (see Wright et al. wright10 (2010)) at 3.4, 4.6, 12 and 22 m. The WISE mission was optimized for point sources, and it is known that there may be a problem with fluxes of extended objects (see Jarrett et al. jarrett13 (2013)). As discussed below, a few galaxies at low redshift show systematically lower fluxes than in the other IR and visual bands. However, this only occurs in a small minority of cases, and in general the WISE data are quite useful. We have collected the available WISE data in Table LABEL:tab:wise. The references for other IR data, typically in the 20-200 m, are a) Ogle et al. (ogle06 (2006)), b) Dicken et al. (dicken10 (2010)), c) Lilly et al. (lilly85 (1985)), d) Shi et al. (shi05 (2005)), e) Maiolino et al. (maiolino95 (1995)), f) Hardcastle et al. (hardcastle09 (2009)), g) Golombek et al. (golombek88 (1988)), h) Frogel et al. (frogel75 (1975)), i) Tang et al. (tang09 (2009)), j) Temi et al. (temi09 (2009)), k) Moshir et al. (moshir90 (1990)), l) Siebenmorgen et al. (siebenmorgen04 (2004)), m)Deo et al. (deo09 (2009)), n) Sargsyan et al. (sargsyan11 (2011)), o) Elvis et al. (elvis84 (1984)), p) Xilouris et al. (xilouris04 (2004)), q) Temi et al. (temi04 (2004)), and r) Willmer et al. (willmer09 (2009)). Sources for which these additional IR data are available are 3C 192 (a, b), 3C 219 (a, c, d), 3C 234 (a, c, k, m, n, o), 3C 264 (e, f, g,), 3C 272.1 (h, i, j, k), 3C 285 (b, k), 3C 296 (l), 3C 305 (b, g, l), 3C 321 (d, f, k, l, m, n), B2 0648+27 (g), B2 1122+39 (g,k), B2 1217+29 (i, j, k, p, q), B2 1350+31 (b, f, g, k, l), B2 1615+32 (d, k), and B2 1621+38 (r).
Although these data are very heterogenous and taken from various instruments (e.g. IRAS, ISO, and Spitzer), they appear to give a very good idea of the extension of the SED up to 100 or 200 m.
We list in Table LABEL:tab:phot the GALEX, SDSS, and 2MASS photometry of the B2 and 3C objects. Either the far-UV (FUV) or the near-UV (NUV) magnitudes (or both) are missing for a few objects. In the table we list in Col. 1 the B2 or 3C name, in Cols. 2 and 3 the GALEX magnitudes FUV and NUV as found in the GALEX data base with their respective one- uncertainties, and in Cols. 4-8 we provide the SDSS magnitudes (, , , and ). No errors are shown, since these are, at least formally, of the order of 0.01 at most. This is quite possibly much lower than the real values because we study extended nearby galaxies; in the fitting procedure described below, we adopted a minimum uncertainty of 0.02 mag. Finally, in Cols. 9-11 the 2MASS J, H, and K magnitudes with their one- uncertainties are listed. To investigate the spectral energy distribution, we made use of a set of models of early-type galaxies calculated by Bruzual & Charlot (bruzual03 (2003)). The models are characterized by i) an instantaneous starburst, with ii) an IMF as given by Chabrier (chabrier03 (2003)) and iii) solar metallicity. The oldest model galaxies have an age of years, while the youngest ones have an age of a few times years. We did not try to interpolate between the models, which are based on a discrete series of ages. However, this probably only has a weak effect because any improvement on the final obtained best fits can only be marginal.
We proceeded in two steps. First we checked whether a single old elliptical galaxy model was sufficient and resulted in a satisfactory fit to the photometric data. A minimum reduced lower than 20 was considered to represent a good fit. This value might appear to be quite high, but this is undoubtedly due to the (unrealistically) small formal errors on the photometry, especially in the SDSS bands.
Many galaxies do not need an extra YSP or AGN component, meaning that there is no trace of either star formation or non-thermal emission coming from the nucleus; excellent fits were then obtained with only an old galaxy model (ages around years).
Since we studied sometimes very extended objects, this might add some uncertainty in the magnitudes as derived by the various surveys. In a number of cases we also have slightly deviating 2MASS bands, which are systematically displaced compared to the other bands of GALEX and SDSS, and this strongly contributes to increase the value of , up to values . However, about three quarters of the one-component fits have , which illustrates that the old galaxy model of Bruzual & Charlot (bruzual03 (2003)) represents the actual SED of the inactive galaxies quite well.
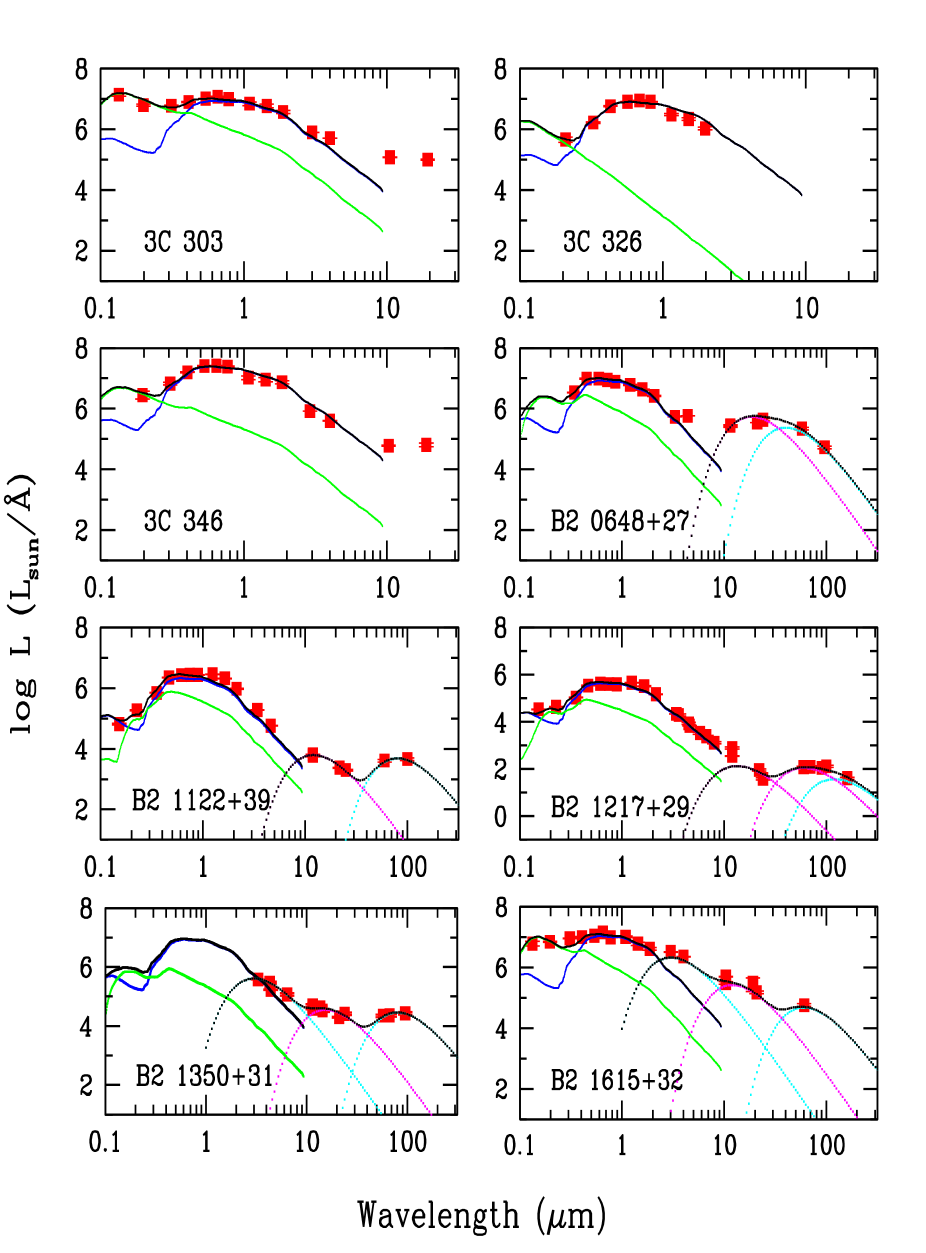
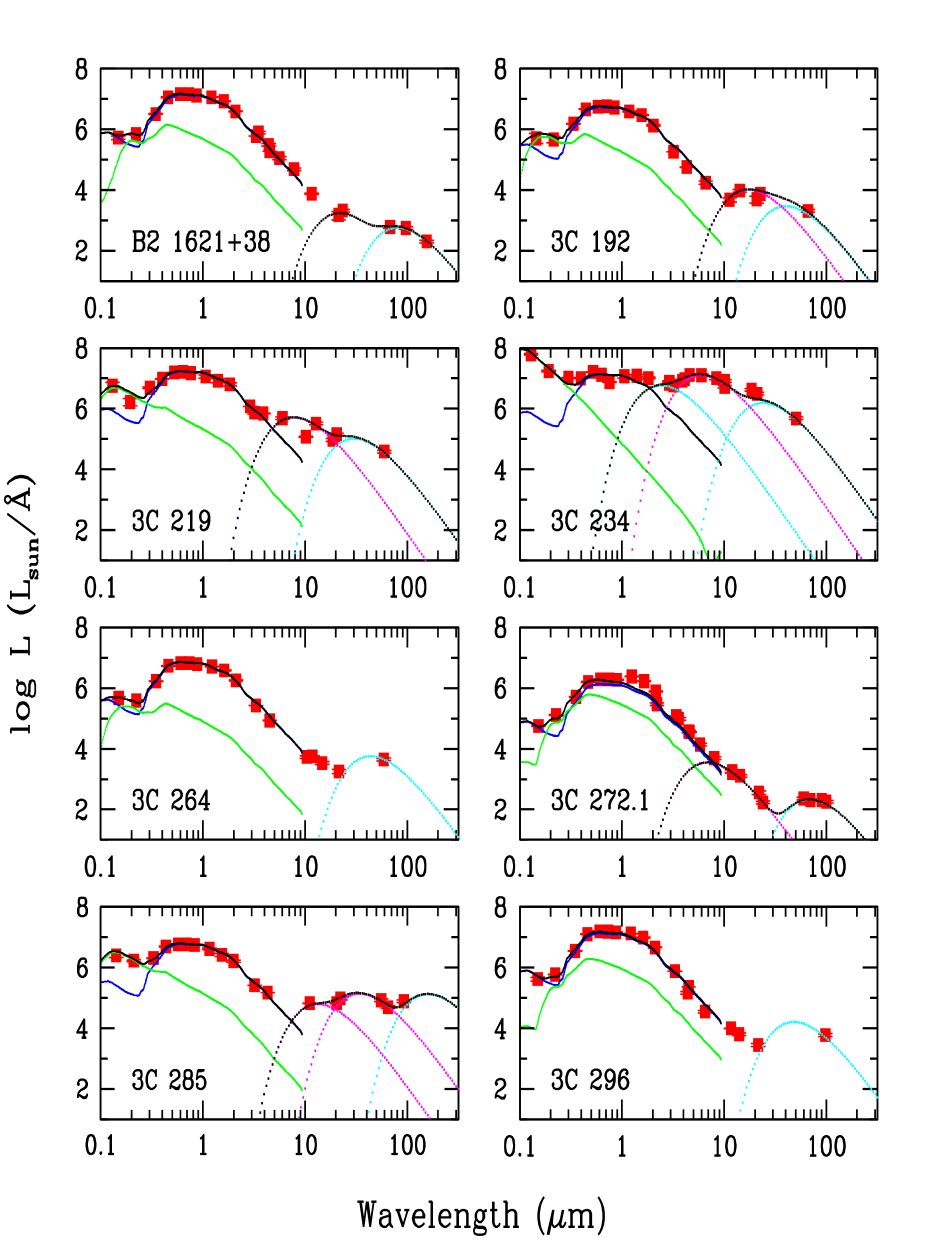
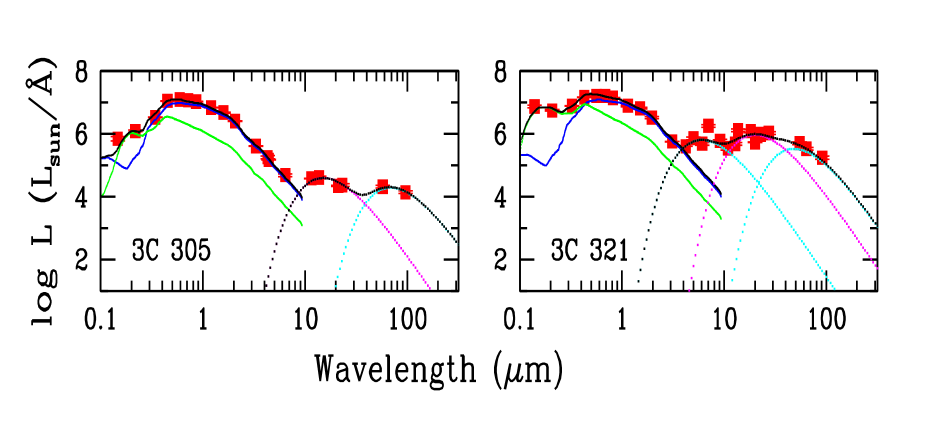
If no satisfactory fit could be obtained with a single galaxy component, a second component was introduced, either a second younger stellar population (YSP) or a power-law component, due to the AGN. Of course, there might be more than one additional component, for example, two YSPs of different ages or a YSP and a power-law component (see for example Tadhunter et al. tadhunter98 (1998); Tadhunter et al. tadhunter11 (2011)). However, we did not consider this possibility as the data are not sufficiently detailed to allow such a treatment. As to the choice of a power-law or young galaxy (star-forming) component, it usually is difficult to choose which of the two gives a better fit. If a power-law component appears to be a serious alternative, the fitting power-law parameters are also listed in Table 3, although we did not plot them in Fig. 1. A small minority of objects did not allow convergence to a satisfactory fit, and it therefore appears impossible to decompose the SED using two simple components. We investigate the question whether the UV excess is due to light from the AGN or from a young stellar population in Sect. 4.
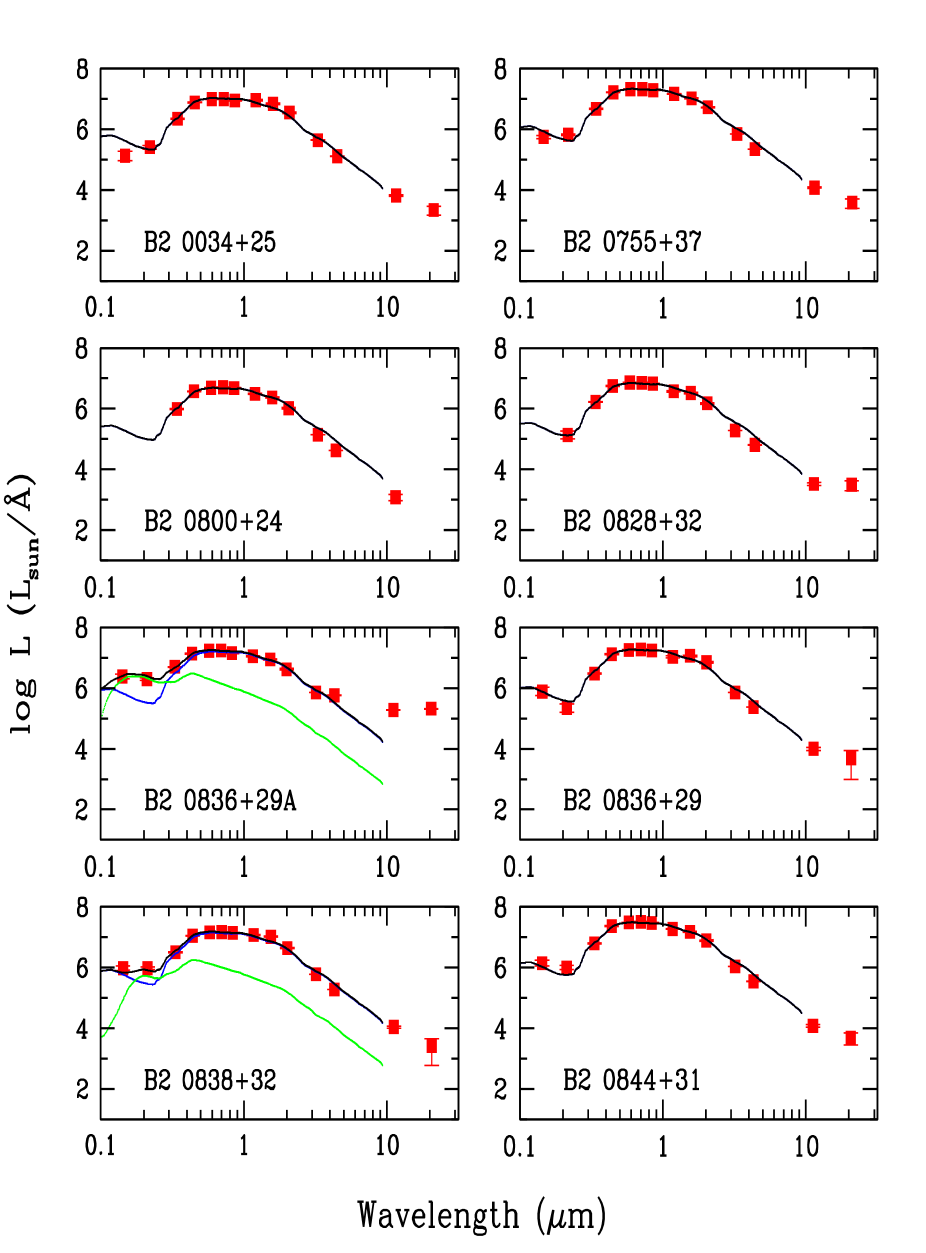
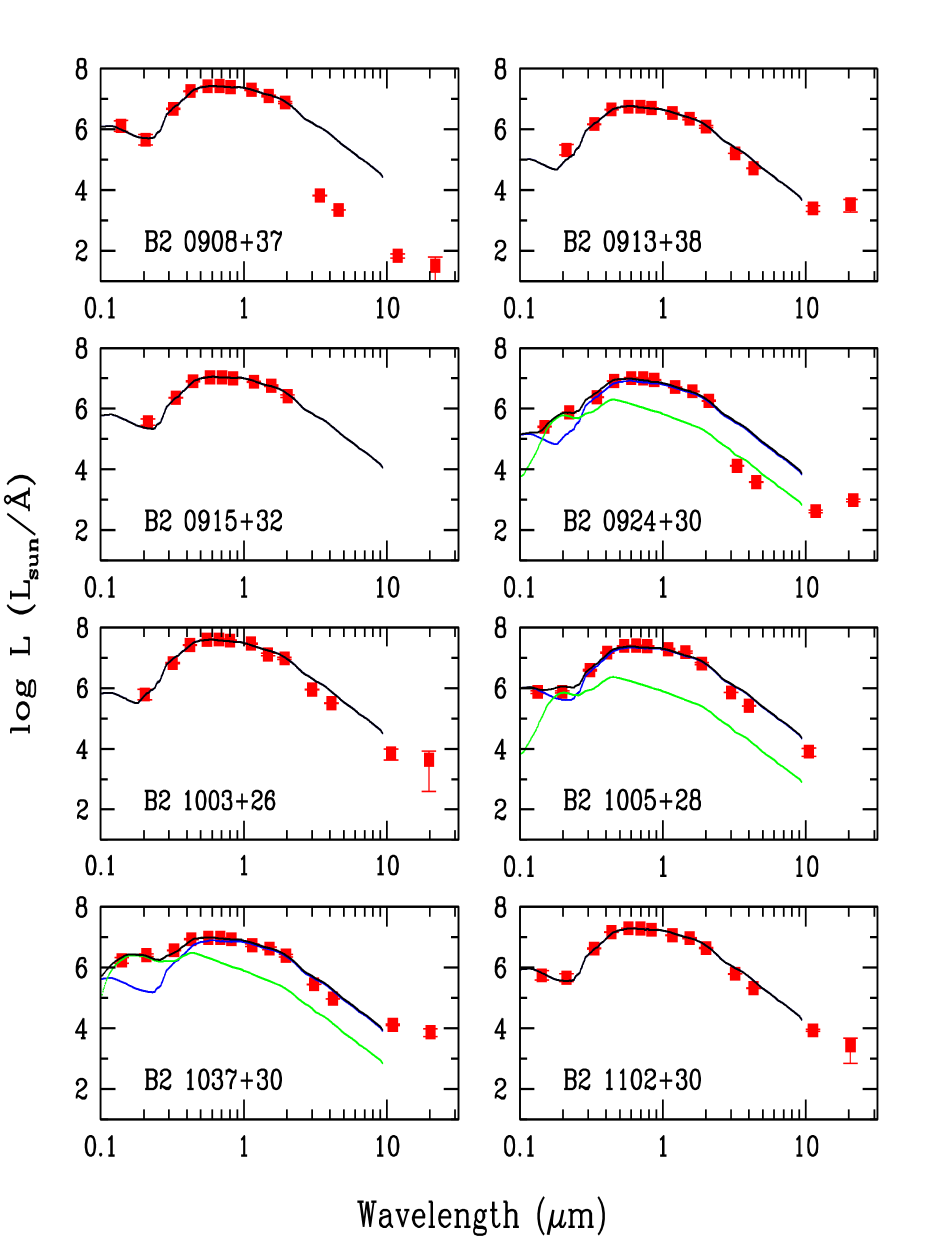
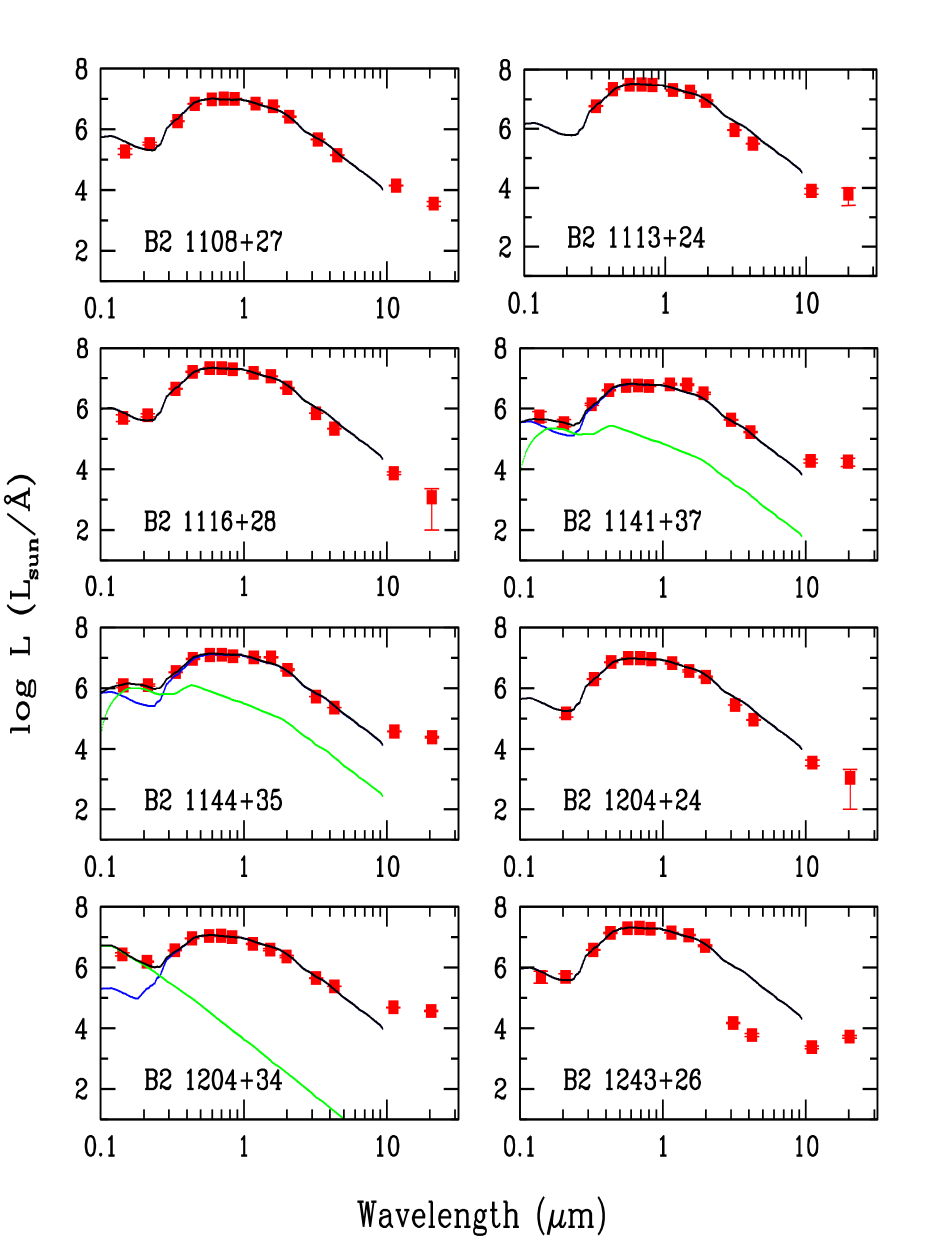
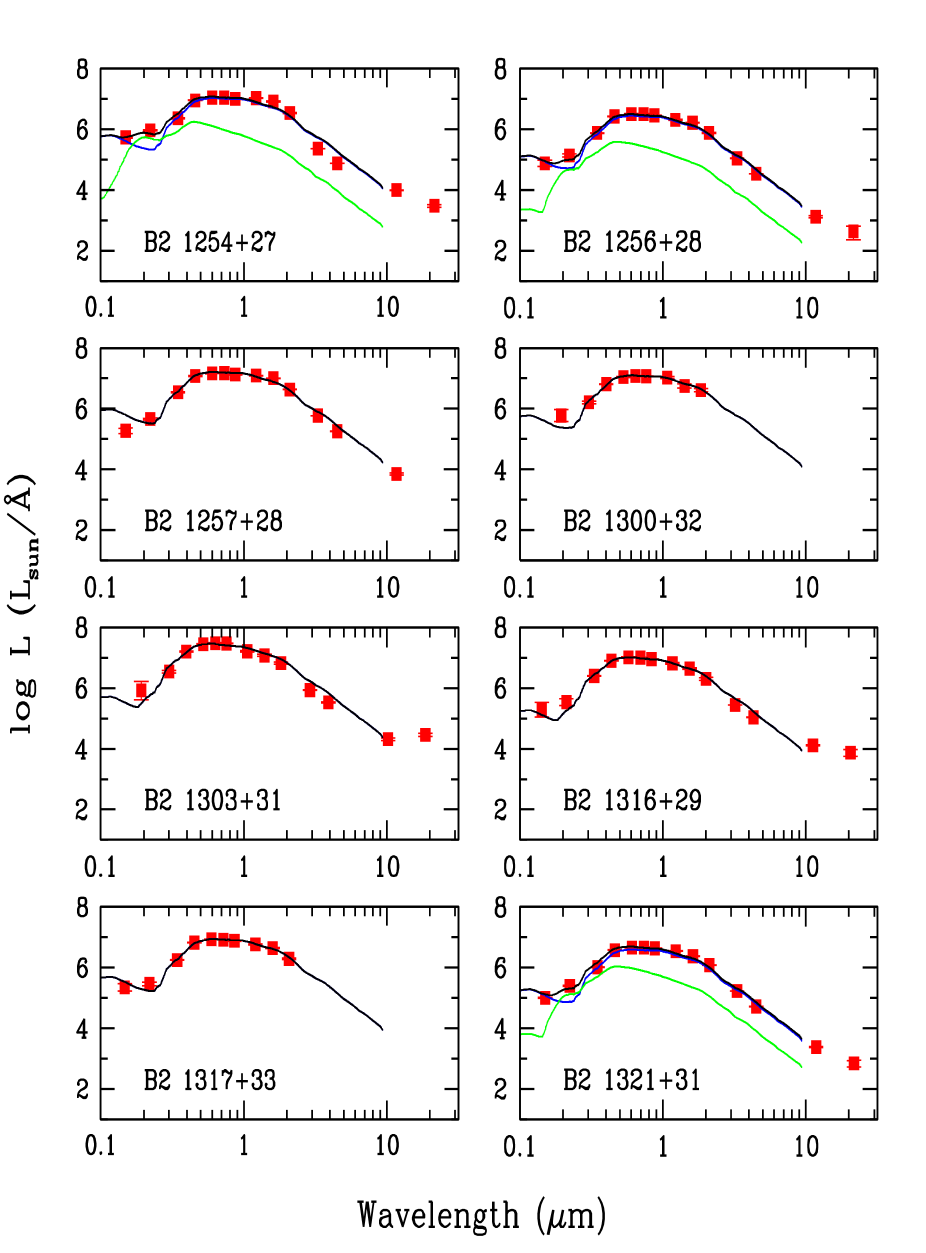
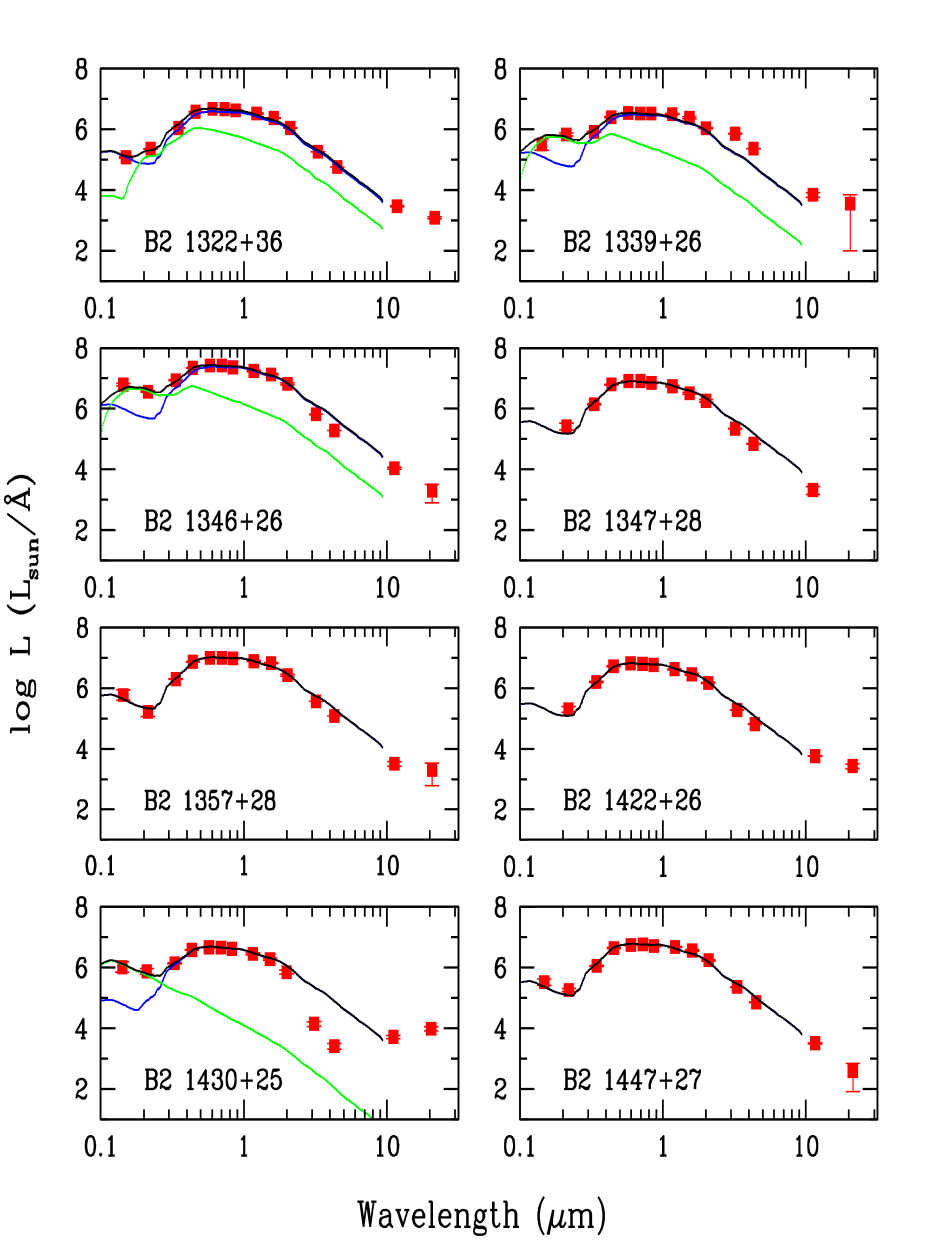
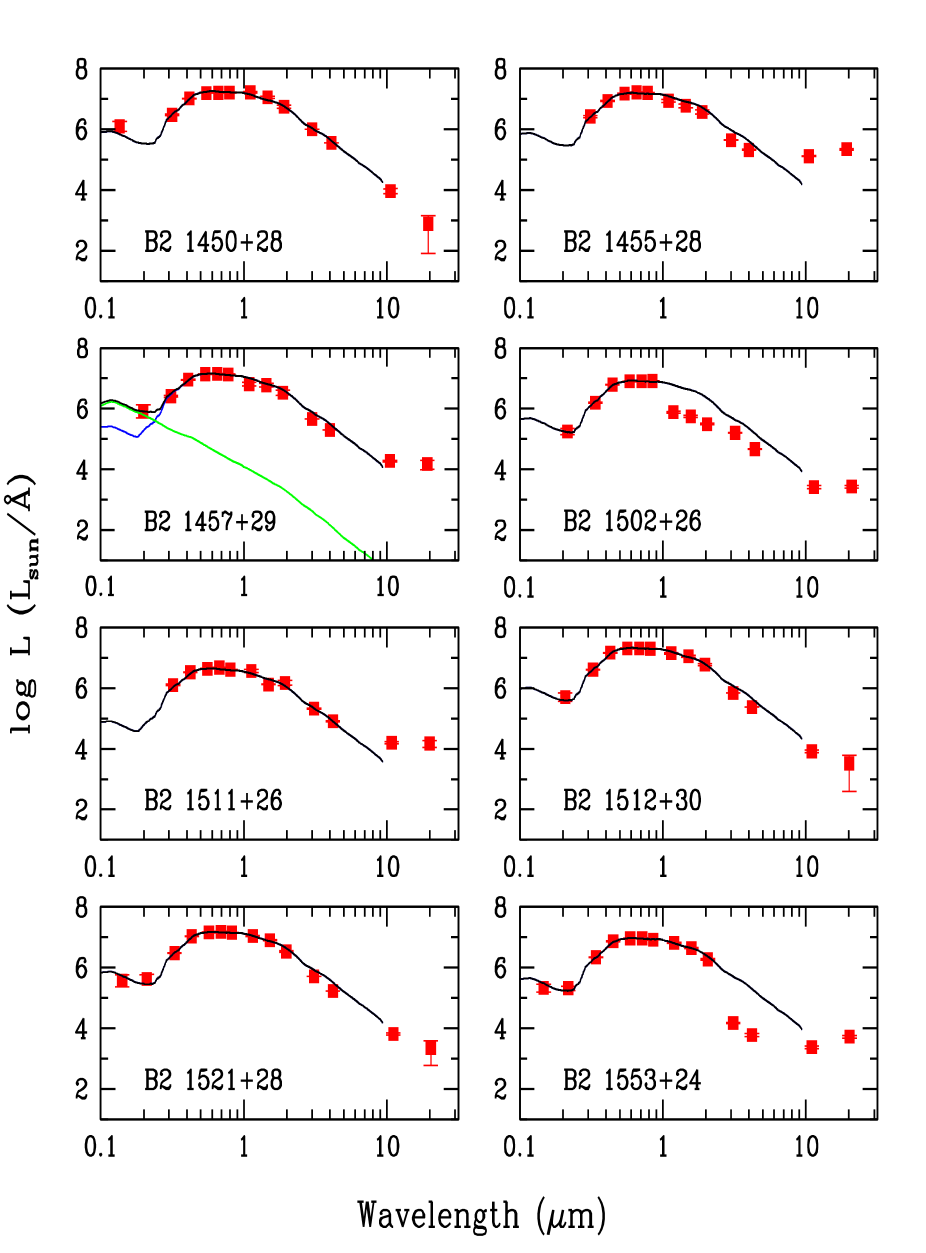
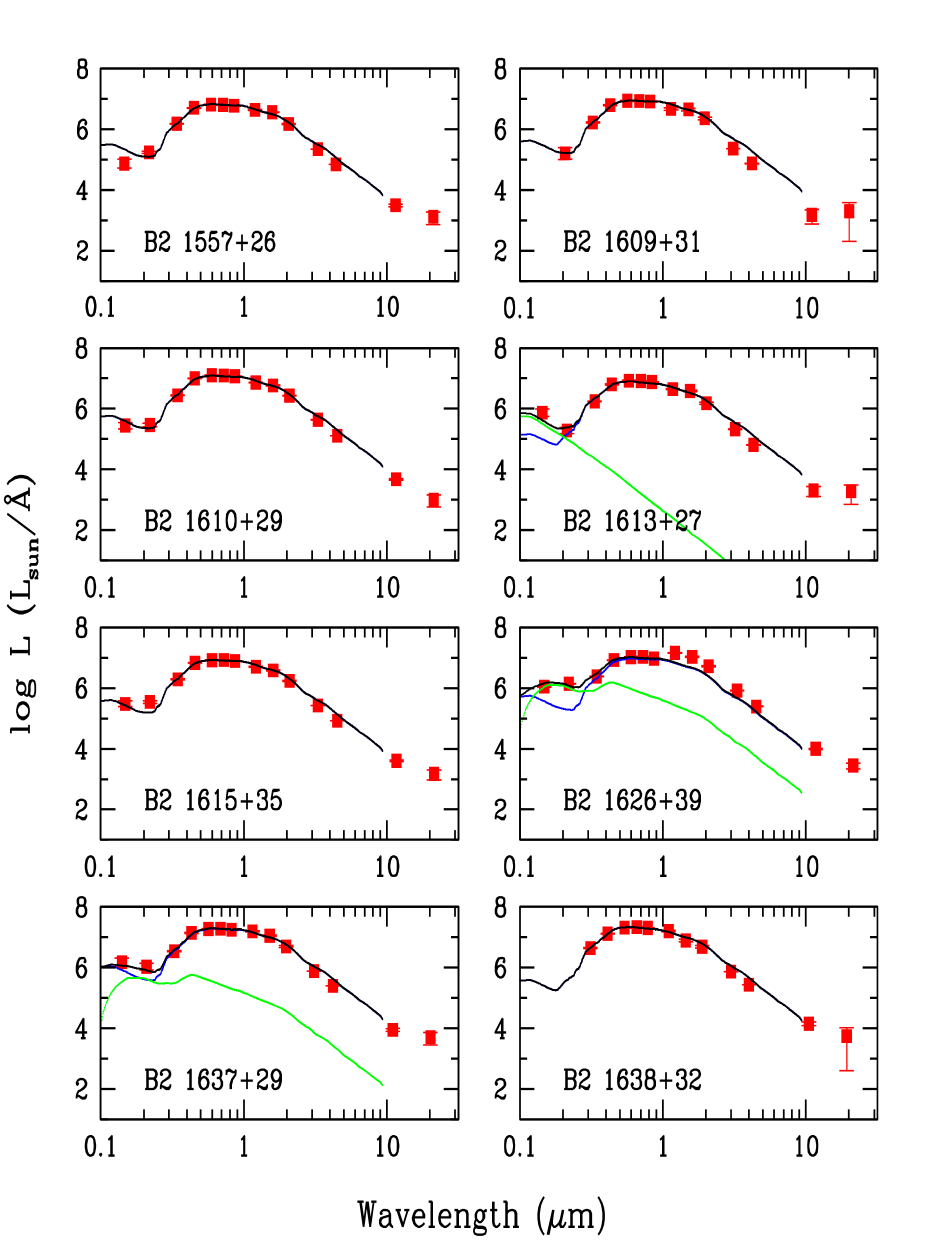
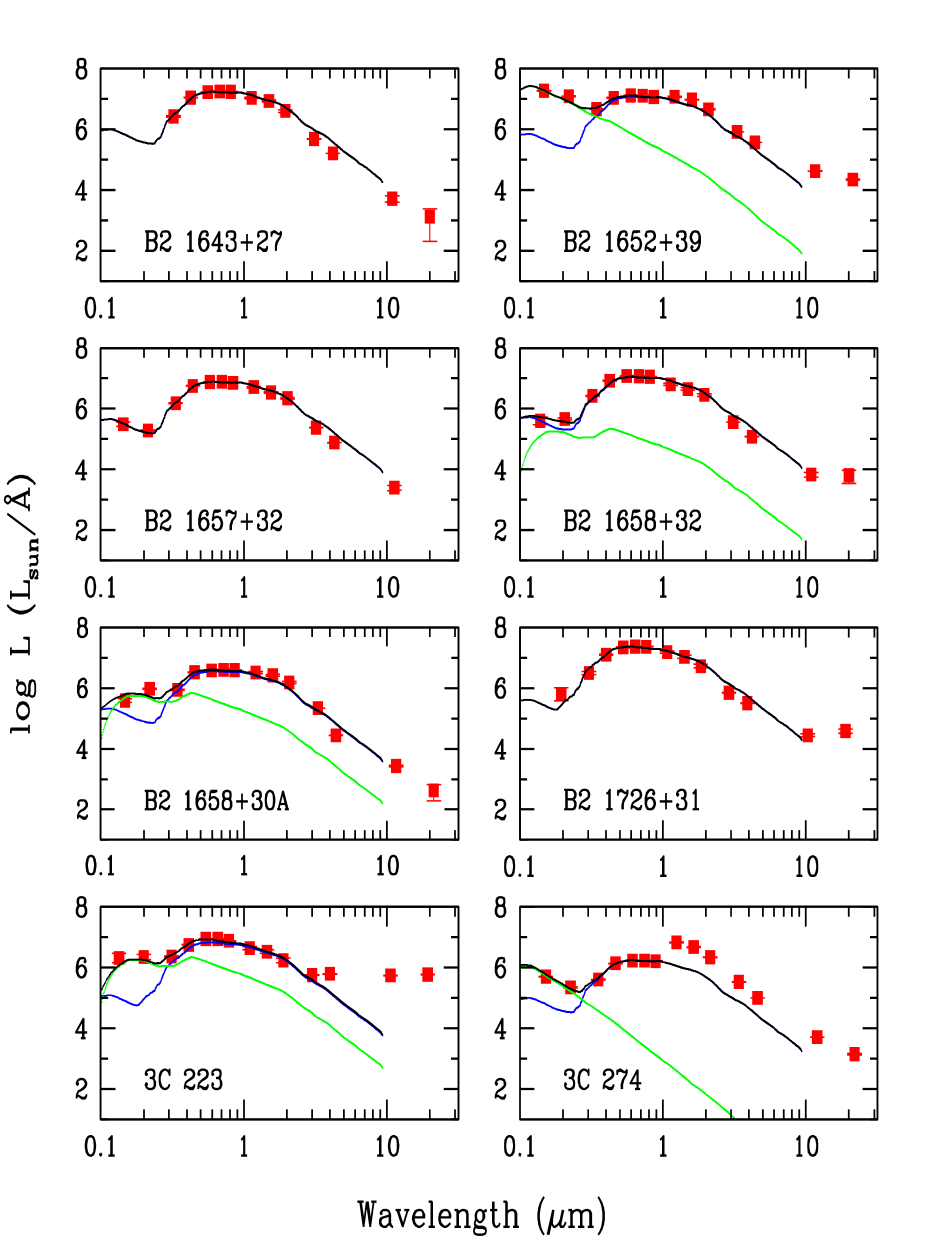
In Fig. 1 we show fits with only one component, or, if necessary, a second younger galaxy component. Sources with additional far-IR data are given at the end.
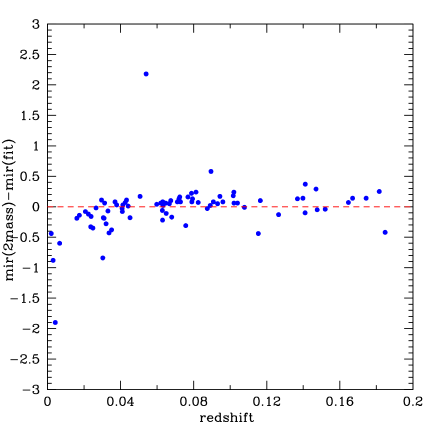
High values may partly be due to a discrepancy between the SDSS and 2MASS, as mentioned above (see e.g. the cases of 3C 274 and B2 1502+26), but not always (e.g. 3C 234). In general, never reaches values close to unity because the formal errors in the magnitudes of SDSS and 2MASS are much smaller than the actual errors. A more realistic estimate of the magnitude errors can be obtained by plotting the difference of the 2MASS magnitudes and the magnitudes of the galaxy model used to fit the photometric data. These are shown in Fig. 2.
From this figure one can draw four conclusions: i) only very few objects have a large difference between 2MASS and model magnitudes (the latter being strongly constrained by the SDSS data); ii) one object, B2 1502+26 (3C 310) is quite different, the 2MASS value being as much as two magnitudes fainter than expected from the model fit. In this case, the reason is very simple: 3C 310 is only present in the 2MASS point source catalogue and not in the extended catalogue. Therefore the 2MASS magnitudes were determined using a point source model. Moreover, the WISE data are based on a point source fit in determining the magnitudes, and they therefore agree well with 2MASS; iii) with few exceptions, all other magnitudes agree within a few tenths of a magnitude, which probably tells us that a more realistic estimate of the magnitude errors should be of that order; iv) there appears to be a very weak correlation with redshift. This correlation can be safely ignored for redshifts above , but may cause some problems for the most nearby galaxies (e.g. 3C 274, for which 2MASS and WISE agree well, but SDSS appears to be low). Leaving out the low-redshift objects and the deviating point of 3C 310, we find that . WISE and 2MASS generally agree well, perhaps surprisingly so, because WISE was optimized for point-like sources (Jarrett et al. jarrett13 (2013)): flux mismatches should therefore be possible considering that the objects discussed here are extended. Indeed, there are a few cases where the WISE luminosities appear to be discrepant (B2 0908+37, B2 0924+30, B2 1243+26, B2 1430+25 and B2 1553+24) and significantly lower than the extrapolated luminosities from the SDSS and 2MASS. For three of these five sources, the WISE luminosities were determined using a point source fit, but not B2 0908+37 and B2 1553+25, which were fitted with an extended source model. The discrepancy of the WISE luminosities remains unaccounted for only in these two sources.
Nevertheless, we stress that in the large majority of objects the continuity between 2MASS and the two near-IR bands of WISE is excellent. This is different for the two mid-IR bands of WISE (at 12 and 22 m), and this has interesting implications, as we discuss below.
3 Results
It is well known that FRI sources tend to have low-excitation spectra, often with only few weak emission lines, and these are fitted very well with a single-galaxy model spectrum with an age of the order of years. This can be seen in Table LABEL:tab:results, in which we have collected a number of useful data on the objects studied in this paper. The presence of a low-luminosity radio source therefore often has no influence whatsoever on the optical spectral energy distribution of the galaxy as a whole. This is, of course, in stark contrast to high-luminosity radio sources, which are usually accompanied by high-excitation spectral lines.
Several articles have recently dealt with the UV properties of early-type galaxies: Jeong et al. (jeong12 (2012)) reported an unexpectedly rising UV flux towards shorter wavelengths (in early-type galaxies in general), while Allen et al. (allen02 (2002)) and Baldi & Capetti (baldi08 (2008)) attributed the (excess) UV flux found in 3CR radio galaxies to recent star formation. We here mainly concentrate on galaxies with lower radio luminosities than those discussed by Allen et al. (allen02 (2002)) and Baldi & Capetti (baldi08 (2008)), and such galaxies may, at least in the optical, resemble the group of X-ray bright galaxies with optically ”dull” AGN analysed by Trump (trump09 (2009)). We note that according to the latter authors, such galaxies do have weak but significant UV emission, like an unobscured AGN.
Fanti et al. (fanti11 (2011)) introduced a measure of the excess ultraviolet radiation that provides a quantitative indication of the amount of additional radiation in the ultraviolet region, as compared to the passive SED of an early-type galaxy. We use a similar but slightly different parameter, . To be precise,
such that measures the observed excess, in magnitudes, in the slope between 4500 and 2000 Å with respect to the SED of a passively evolving early-type galaxy. The uncertainty in , which depends on the uncertainties in FUV and NUV (see Table LABEL:tab:phot), is usually mag. We list together with its uncertainty in Col. 13 of Table LABEL:tab:results.
measures the mean UV excess, based on both FUV and NUV. The behaviour of FUV and NUV individually does not necessarily tell us something about the shape of an excess: even in the SED of an old elliptical galaxy there is more FUV than NUV (see the model SEDs in Fig. 1), although may be close to zero. However, once the reality of a UV excess is determined, the presence or absence of an increase may tell us something about the cause of the excess; in particular, if FUV is lower than NUV, this may be hard to explain with an AGN component in the form of a power law. If there is an increase in UV that is accompanied with a UV excess, it is impossible to distinguish between a power law and a YSP with age years, and we need to turn to other methods to determine whether the prime cause is the AGN or star formation. We discuss this in Sect. 4.
In Table LABEL:tab:results we also list some other parameters such as the galaxy model that produced the best fit to the observed SED in Cols. 2 (logarithm of the galaxy mass, in solar masses) and 3 (age of the galaxy model), and, if necessary, a second component in Cols. 4 and 5. A best fit obtained with a power law is indicated by a ”p” in Col. 6: Column 4 then gives the luminosity density (in solar luminosities per ) at the reference point Å, and Col. 5 the slope of the power law. A second galaxy component is indicated by a ”g” in Col. 6; in that case, we list in Col. 4 the logarithm of the mass expressed in solar masses and the age of this galaxy component in Col. 5. The reduced minimum in Col. 7 refers to the final fit adopted, either with one or two components. We recall again that these values may in general appear to be high, which is simply due to the probably too optimistic estimates of the SDSS photometric uncertainties. Since for a number of sources the IR data do not agree very well with the SED in the optical, we have indicated these cases by footnotes to Col. 7.
For completeness we also list some older data, which can be found in Fanti et al. (fanti87 (1987)) and de Ruiter et al. (deruiter90 (1990)): the total power at 1.4 GHz, (recalculated with the concordance model) in Col. 8, the FR type in Col. 9 (we note that FR 3 refers to compact sources, while in a few cases no FR type could be assigned).
We determined the spectral type of the radio galaxies from the SDSS spectra (if available) from Buttiglione et al. (2009b ) or from NED. We can distinguish the following cases: i) spectra without any sign of emission lines. The overall spectrum shows the typical absorption features of an inactive early-type galaxy. Such objects are coded by a ”0” in Col. 10. There often is only very weak emission in or [N II] but not much else, and these objects have a ”1”. A discussion of weak-emission line galaxies has recently been given by Cid Fernandes et al. (cid10 (2010); cid11 (2011)), aiming at distinguishing between genuine and false AGNs. As we here consider radio galaxies, no ambiguity should arise concerning the AGN nature (in a broad sense) of our objects.
Other possible spectral classifications are ”2”, which stands for low-excitation galaxies (LEGs; but with enough emission lines present to allow the use of diagnostic diagrams), ”3” for high-excitation galaxies (HEGs), and ”4” if broad-line components are present as well. Since we only consider radio galaxies, LEG and HEG can be used instead of LERG and HERG without creating confusion. For the definitions of LEG and HEG, see Laing et al. (laing94 (1994)) or Buttiglione, Capetti & Celotti (buttiglione08 (2008)), for instance; an excellent discussion on the use of line ratios in the classification of optical spectra can be found in Kewley et al. (kewley06 (2006)). Following their analysis, we report in Col. 11 a classification of the spectral type according to the emission line ratios determined here: ”H” for HII, that is, star forming, ”L” for liner, ”S” for Seyfert, ”S1” for Seyfert type 1. In a number of cases the information from the diagnostical line-ratio diagrams was not detailed enough to distinguish between liners and Seyferts, and such objects are generically classified as ”A” (AGN). A few objects fall in the zone of composite spectra, in which there is probably both star formation and an AGN; such objects are classified as ”C” in Col. 11. We note that one object, B2 1652+39, which is a compact radio source with one of the highest values (4.05), is classified as a BLLac (Ulrich et al. ulrich75 (1975)); its spectrum is featureless.
In Col. 12 we list the luminosity (in Watt) of the emission.
In Col. 13 we list the parameter that describes the ultraviolet excess, , as discussed above, and also its one- uncertainty. The logarithm of the ratio of the two near-IR (W1 plus W2) and the two mid-IR (W3 and W4) WISE luminosities is given in Col. 14 (for a detailed discussion of this parameter, see Sect. 3.7). Finally, in Col. 15 we list the central black hole masses wherever available. They were taken from Bettoni et al. (bettoni03 (2003), bettoni09 (2009)), the HYPERLEDA222URL: http://leda.univ-lyon1.fr database (Paturel et al. paturel03 (2003)), or Snellen et al. (snellen03 (2003)), as indicated, and using the relation between central velocity dispersion and black hole mass of Tremaine et al. (tremaine02 (2002)).
3.1 Comments on individual sources
B2 0648+27. Unfortunately, no GALEX data are available, but an additional young population does improve the fit (see Fig. 1). Moreover, spectral data show that this galaxy is a HEG (see Emonts et al. emonts06 (2006)). MIR and FIR data are available, which can be fitted by a mixture of dust with temperatures of 60 K (dust mass ) and 130 K ().
B2 0836+29A. A young stellar component is necessary to explain the UV excess (both in FUV and NUV). It is hard to fit the excess using a power-law component coming from the AGN, but we note that this source is a HEG and also rather powerful in radio (FR type in the transition range between types I and II).
B2 0838+32. The moderate UV excess can be very well explained by a young stellar component. Unfortunately, no optical spectra are available (to our knowledge). We note that the WISE data follow the old stellar population model quite well, up to and including the 22 m point.
B2 0908+37. The WISE data fall well below the values expected from GALEX, SDSS, and 2MASS data, although the slope appears to be consistent. This is one of the few cases in which the WISE flux determination has failed to account correctly for the extendedness of the object.
B2 0924+30. A young stellar component gives a good fit to the spectrum, including NUV and FUV. The WISE data are different by a large factor, but again, as in B2 0908+37, the slope appears to be consistent. We note that the WISE luminosities were derived using a point-source model.
B2 1005+28. A young stellar component improves the fit, but there is no trace of a UV excess. The optical spectrum is devoid of emission features. The WISE data follow the old stellar component very well.
B2 1037+30. The blue and UV data can only be fitted (and well) by a young galaxy component. This object has a typical (post-)starburst spectrum, with the higher Balmer lines present in absorption. In the diagnostic diagrams it falls in the liner region.
B2 1122+39. A young stellar component is needed to fit the UV excess. No plausible power-law component would be able to do this. MIR and FIR data are available, which can be fitted by a mixture of dust with temperatures of 30 K () and 200 K ().
B2 1141+37. A young stellar population yields a good fit to the UV data. In principle, a power-law component might produce an equally plausible fit, but we note that the spectrum has clear star burst characteristics (higher Balmer lines present in absorption). The optical spectrum is otherwise lacking emission features.
B2 1144+35. This source has strong Seyfert 1-like broad emission lines. No signs of star formation are present.
B2 1204+34. The UV excess may be caused by a young stellar or power-law component. As discussed below (Sect. 4), both may be present.
B2 1217+29 (NGC 4278). The fit with a YSP has a rather high value that is due to the systematically higher 2MASS points, as compared to the GALEX and SDSS data. We note that NGC 4278 is at very low redshift (z=0.0021), which probably causes this discrepancy. The decrease in luminosity from SDSS via NUV to FUV can be reproduced well by a YSP, but not by a power law. MIR and FIR data are available, which can be fitted by a mixture of dust with temperatures of 20 K (), 40 K () and 180 K ().
B2 1243+26. The WISE luminosities are low because they were determined with a point-source model.
B2 1254+27. As in B2 1217+29, the decrease in luminosity reaching from SDSS via NUV to FUV is easily reproducible by a YSP, but not by a power law.
B2 1256+28. As in B2 1217+29 and B2 1254+27, only a YSP produces a satisfactory fit.
B2 1317+33. One of the very few sources for which no WISE data are available.
B2 1321+31 and B2 1322+36. Only a YSP can explain the UV behaviour of the spectral energy distribution.
B2 1339+26. The UV excess ( mag) is high and clearly significant. A YSP reproduces the UV well, but there are no other signs of star formation in the optical spectrum; emission lines are absent.
B2 1350+31 (3C 293). According to Tadhunter et al. (tadhunter11 (2011)), a YSP is present. MIR and FIR data are available, which can be fitted by a mix of dust with temperatures of 60 K (), 155 K () and 800 K ().
B2 1430+25. The mismatch of the WISE data is due to their being based on a point source model. The UV excess () and the distribution the SDSS and GALEX points allow both a YSP or a power law as a plausible candidate. We note, however, that the spectrum shows some moderately strong Balmer lines in absorption.
B2 1455+28. Only a one-component fit was possible because UV information is lacking. However, the source is a HEG and also a strong FRII radio source. It is therefore likely that this source has a significant UV excess.
B2 1457+29. FUV is lacking, therefore fitting with a YSP or a power law is equally possible. No spectral data are available.
B2 1502+26 (3C 310). In this case, both the 2MASS and WISE luminosities were obtained by using a point-source model, undoubtedly the reason for their discrepancy with SDSS and GALEX.
B2 1553+24. This is one of the two sources (the other being B2 0908+37) for which the mismatch of WISE luminosities remains unexplained (an extended model was used to determine the fluxes).
B2 1613+27. Although there formally is no UV excess (), there appears to be a strong increase towards FUV. The reason for this is that , which refers to the emitted luminosity at 2000 Å, is in this case mostly determined by NUV, which still follows the old stellar population (see Fig. 1). Therefore a fit that takes the increase into account can only be achieved with a very young stellar component or a power law. There are no obvious signs of either in the optical spectrum (there is only H emission).
B2 1615+32 (3C 332). This is a Seyfert 1, with strong broad emission lines. The continuum is probably due to the AGN, as discussed in Sect. 3.7. MIR and FIR data are available, which can be fitted by a mix of dust with temperatures of 40 K (), 200 K (), and 800 K ().
B2 1621+38. MIR and FIR data are available, which can be fitted by a mix of dust with temperatures of 30 K () and 110 K ().
B2 1626+39. The UV excess can be well reproduced by a YSP. The of the fit is high as a result of somewhat deviating 2MASS points.
B2 1637+29. The slight UV excess can be explained well as being caused by a YSP. The optical spectrum shows no emission features or signs of star formation.
B2 1652+39. The UV excess is the second highest () in our sample. The increase towards the far UV means that power-law emission from the AGN is more probable than the YSP plotted in Fig. 1. This object is a well-known BL Lac (Mrk 501). It is also worth noting that the spectral index between the red (between 7000 and 8000 Å, from HST data) and 2000 Å, , which is virtually identical to the slope between FUV and NUV, , thus confirming the power-law nature of the continuum in this BL Lac.
B2 1658+32. A YSP produces a good fit to the model spectrum.
B2 1658+30A. This is a LEG, for which only a YSP gives a good fit in the UV.
3C 192. This source has a moderate UV excess (). The optical spectrum shows the strong emission lines typical of a HEG. No signs of star formation are apparent, and AGN emission producing the UV excess is more probable. We also note that 3C 192 is an FRII radio source. MIR and FIR data are available, which can be fitted by a mixture of dust with temperatures of 60 K () and 140 K ().
3C 219. Like 3C192, this is a HEG, with . The radio source is of FR type II. The evidence for AGN emission is strong (see Sect. 4). MIR and FIR data are available, which can be fitted by a mix of dust with temperatures of 80 K () and 310 K ().
3C 223. A YSP produces an excellent fit in the ultraviolet. This is one of the few sources with all four WISE luminosities at the same level (see also Sect. 3.7).
3C 234. An unusual SED, almost flat from the far-IR to the ultraviolet (which even increases toward the far-UV). This source has the highest (4.18) in our sample. Excellent fits are allowed either by a YSP or by a power-law component. (see Sect. 4 for a more detailed discussion). MIR and FIR data are available, which can be fitted by a mix of dust with temperatures of 100 K (), 400 K (), and 1000 K ().
3C 264. MIR and FIR data are available. The FIR data can be fitted by dust with a temperature of 55 K (), while the WISE luminosities appear to follow the old stellar model spectrum out to at least 10 m.
3C 272.1. The FUV and NUV data suggest that a YSP is present and not a power-law component. The high value is due to the 2MASS data being systematically higher than the model SED (see Fig. 1). We note that 3C 272.1 is at very low redshift (z=0.0031), which may have contributed to the difficulty of correctly scaling all photometric bands. MIR and FIR data are available, which can be fitted by a mix of dust with temperatures of 35 K () and 350 K ().
3C 274 (M87, Virgo A). The poor fit with a very high value is due to the systematically higher 2MASS luminosities. WISE data appear to agree better with 2MASS, however. Like 3C 272.1, this source is at very low redshift (z=0.0043).
3C 285. Although a power law would be enough, there are good reasons to assume that significant star formation occurs (see Sect. 4). An excellent fit is obtained with a YSP, and according to Tadhunter et al. (tadhunter11 (2011)), a YSP is present. MIR and FIR data are available, which can be fitted by a mix of dust with temperatures of 15 K (), 70 K (), and 180 K ().
3C 296. A YSP provides a satisfactory fit with the model SED. MIR and FIR data are available. As in 3C264, it can be fitted by dust, in this case with a temperature of 50 K (), while the WISE luminosities appear to follow the old stellar model spectrum out to 20 m.
3C 303. This source has a large UV excess (), which can be explained equally well by a YSP or a power law.
3C 305. The far-UV can only be produced with the help of YSP, which, according to Tadhunter et al. (tadhunter11 (2011)), is indeed present. MIR and FIR data are available, which can be fitted by a mixture of dust with temperatures of 35 K () and 160 K ().
3C 321. An excellent fit in the UV is obtained with a YSP, in agreement with Tadhunter et al. (tadhunter11 (2011)). There is an abundance of MIR and FIR data, which can be fitted by a mixture of dust with temperatures of 50 K (), 120 K (), and 400 K ().
3C 326 and 3C 346. Unfortunately, FUV is lacking for both objects, so it is impossible to distinguish between a YSP and a power law.
3.2 Distribution of XUV
In Fig. 3 the histograms of clearly show that the ultraviolet excess may be as high as 4-5 magnitudes, and such objects all need a second component to be satisfactorily fitted. As several galaxies do not need a second component, or, to be more precise, a second component does not improve the fit significantly, the histogram of these objects is centered on , as of course it should. The accuracy of is determined by NUV and FUV. We mention in passing that we never found a significant ultraviolet deficit. The 3C sources, which are more often of the FRII type than B2 sources, do have in general more extreme values of : about one half of them have , while this is true for only % of the B2 sources. This is a first indication that high radio luminosity comes together with an ultraviolet excess.

It is well known that high-luminosity radio sources have optical spectra that usually exhibit strong emission lines like , , and (see e.g. Zirbel & Baum zirbel95 (1995); Buttiglione et al. 2009a , 2009b ; Hardcastle, Evans & Croston hardcastle09 (2009); Capetti et al. capetti11 (2011)).
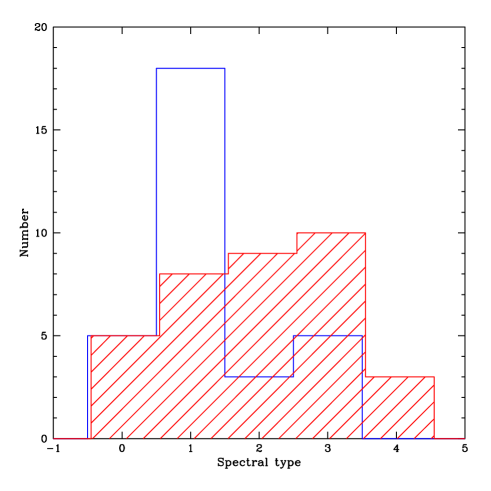
3.3 Distribution of spectral type and line luminosity
One might expect that the majority of one-component fits corresponds to objects without significant emission features in their spectra, as can be seen in Fig. 4. However, this is no one-to-one correspondence because some one-component galaxies are of the HEG type. Therefore highly excited emission lines do not always guarantee a strong UV continuum component, although high values are seen more frequently in HEGs. Conversely, some of the objects that needed two components have no emission lines at all.
We collected the data on the line luminosities of our sample of radio galaxies from the SDSS whenever possible. If necessary, the luminosities were measured directly from the SDSS spectra, with an accuracy that we estimate to be of the order of 5%. In addition, there may be calibration errors, but these are hard to estimate. We used the strengths of a number of lines (, , and ) to determine the spectral type, but considered only the line luminosity in the further analysis.
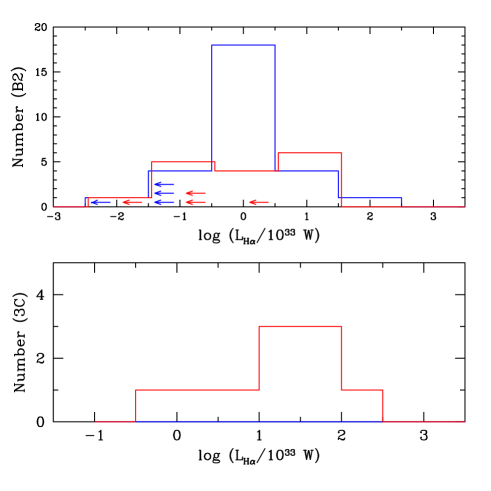
We show the histograms of the line luminosity for B2 and 3C galaxies in Fig. 5. As expected, two-component galaxies tend to have significant emission lines with W, particularly so the 3C radio galaxies. Therefore both the emission luminosity and the UV excess appear to behave (roughly) in a similar way, and both are somehow related to radio power and consequently FRI type. That this is true is shown in Figs. 6 and 7.
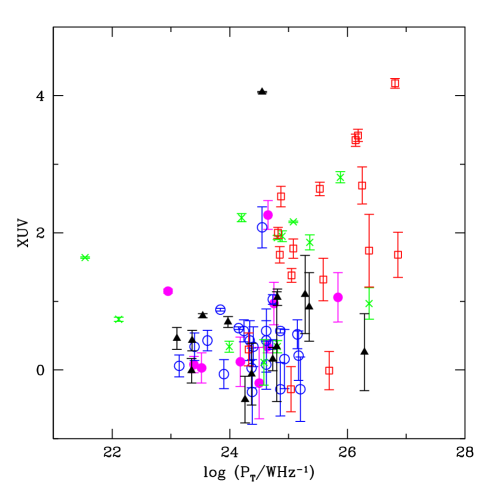
3.4 Correlation of XUV with radio power
In Fig. 6 we plot as a function of radio power. The scatter is rather large, but there appears to be a clear dichotomy between low- and high-luminosity sources. Although there is a dividing line separating FR I and FR II (see Ledlow and Owen ledlow96 (1996)), at the typical optical magnitude of the B2 sources this separation occurs at approximately WHz-1: the sources below this value (indeed mostly FRI sources) have no significant UV excess, and the large majority have no or only weak line emission. In contrast, the higher luminosity sources (mostly FRII, but also some transition types) may have a UV excess, but not necessarily very prominent. It rather looks as if in the FRI range (with perhaps a few rare exceptions). The distribution abruptly widens at the division of FRI and FRII. The correlation between radio power and is thus not simply linear over the whole power range, but more complex. As shown in Fig. 6, the high-luminosity galaxies predominantly are HEGs. We note, however, that the distinction is not sharp, because LEGs are in reality present over the whole range of radio power. Nevertheless, the LEGs follow the general trend that they mostly do not have an UV excess below WHz-1, while they do at higher luminosities. If we take only HEG sources, a linear regression gives , which means that the excess UV luminosity depends only weakly on total radio power (), but is absent below . The correlation is also not very significant, which is expected considering the large scatter in Fig. 6.
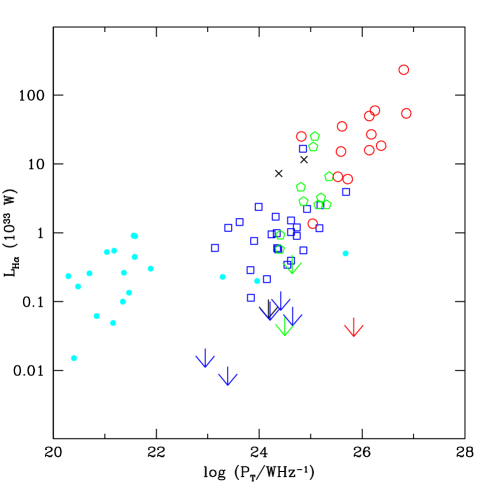
The correlation between the luminosity and radio power is clearly more pronounced, as can be seen in Fig. 7. This well-known correlation is part of a more general correlation between the strength of various emission lines and radio strength (be it total power or jet luminosity); see e.g. Zirbel & Baum (zirbel95 (1995)), Rawling & Saunders (rawlings89 (1989), Hine & Longair (hine79 (1979)). In this figure we have also plotted sources (Bureau et al. bureau11 (2011)) that have been detected in the radio. Here we also see a clear separation in the properties of high- and low-luminosity sources.
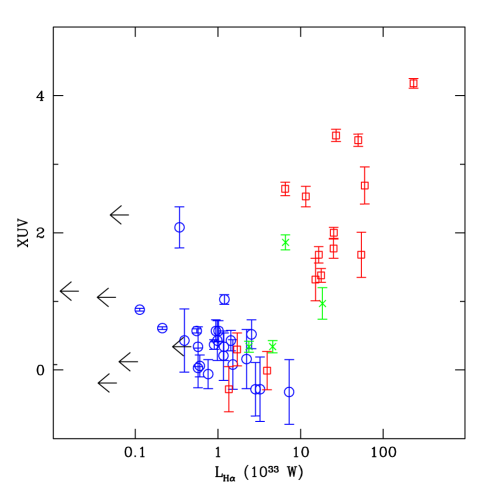
3.5 Correlation of XUV with luminosity
The similarity in the behaviour of and with respect to radio luminosity suggests that there may be a strong correlation between them. We show this in Fig. 8. To be more precise, there is a strong correlation for galaxies with W, but no correlation at all below that value. Therefore our data suggest that the dichotomy in between FRI and FRII is genuine and more profound than has been suspected up till now. The correlation between and line luminosity is strictly true for HEGs and LEGs only (see Fig. 8); below an luminosity of W no significant appears to be present, although there is, admittedly, a large scatter in , which is due to a few objects that have but very weak or even absent emission.
3.6 Are there enough ionizing photons?
Baum, Zirbel & O’Dea (baum95 (1995)) have suggested that the emission lines (including ) in FR I radio galaxies are produced directly by the parent galaxy itself and not by the AGN. This possibility (albeit in non-radio elliptical galaxies) was discussed by Binette et al. (binette94 (1994)); therefore we verify first that the emission lines observed in our FR I objects may be produced by the galaxy itself.
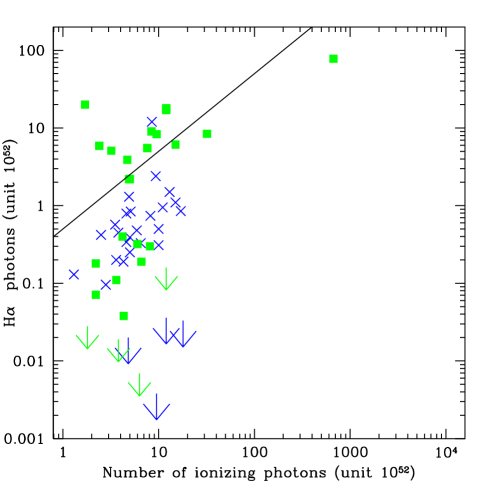
Is the ultraviolet radiation sufficiently strong to produce in emission? We investigated this by calculating the amount of UV radiation capable of ionizing the gas, which can then recombine to produce photons. As a rule of thumb, there should be roughly two ionizing photons available to produce one photon (see e.g. Osterbrock & Ferland osterbrock06 (2006)). Using the fitted galaxy models given in Table LABEL:tab:results, we calculated the number of available ionizing photons.
For objects that could be fitted by an old elliptical galaxy SED without the need to invoke any other component, we computed from the old galaxy model the number of such photons and compared this directly with the number of photons present. These objects are plotted in Fig. 9 as blue crosses. None of these galaxies except B2 1455+28 has very strong emission, and for that reason, they lie well below the line , so that there is no contradiction between available and requested number of ionizing photons. B2 1455+28 was fitted with a single model because GALEX data are lacking. However, it is known to be a FRII radio source associated with a HEG galaxy, and not a typical FRI galaxy without strong optical emission lines.
The situation is slightly different for galaxies that needed a two-component fit. We plot these objects as green squares in Fig. 9. It is clear that in a number of cases the old galaxy component plus a young stellar component alone are not able to produce a sufficient number of ionizing photons.
Of the 26 two-component galaxies, 9 exceed the ratio . These are HEGs or broad-line radio galaxies. In these cases it is plausible that part of the UV output is due to the AGN and not to young stars. If we attribute even a minor fraction (in the range of 10 to 30 %, for example) of this radiation in the form of a power law, a realistic power-law slope () then results in a sufficiently high amount of photons to explain the H strength.
3.7 XUV and the mid- to far-IR
Some articles concerning WISE data of radio galaxies have appeared recently. For example, Xiao-hong, Pei-sheng, & Yan (xiao15 (2015)) discussed a large sample of radio-luminous galaxies and concluded that galaxies in which star-formation is dominant are redder (in the 4.6-12 m colour) than AGN dominated radio galaxies. There also is a separation of LEGs and HEGs in the WISE colour-colour diagram. Gürkan, Hardcastle, & Jarvis (gurkan14 (2014)) also used WISE data. They found that quasars are stronger in the mid-IR than radio galaxies. Is there any evidence in our data of a difference in IR properties between the various types of radio galaxies in our sample, and can this be related to the UV properties?
Inspection of Fig. 1 reveals that the two shorter wavelength bands (3.4 and 4.6 m, W1 and W2) of WISE closely follow the profile of the old stellar population, at least in the large majority of galaxies, while the two longer wavelength bands at 12 and 22 m (W3 and W4) do not: W3 and W4 tend to flatten the SED beyond 10 m. The WISE bands were not used in the model fitting, so that W1 and W2 confirm that the SED follows that of an old stellar population out to about 10 m.
Is the flattening beyond 10 m correlated with the strength of the UV excess? To investigate this, we constructed the parameter , which is the ratio of the mean luminosity of the W1 and W2 bands, and the mean of W3 and W4, that is, . We plot against in Fig. 10.
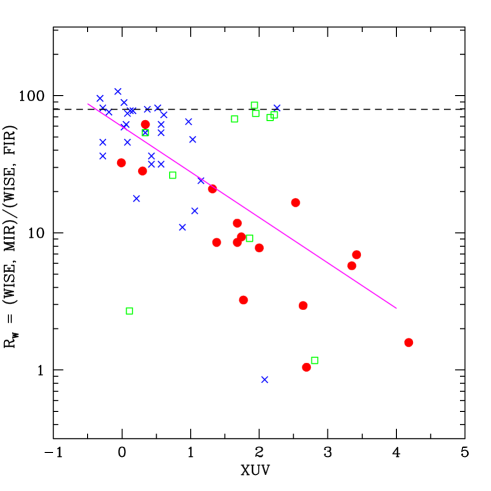
The correlation seen in Fig. 10 is quite striking. A linear regression based on all points gives
which is very significant (at the level of almost ). Since is expressed in magnitude units, this result means that the excess IR luminosity is practically directly proportional to the excess UV luminosity. At the W1 and W2 luminosities are almost one hundred times higher than those of W3 and W4. This is what would be expected for an SED based purely on an old stellar population up to m. Such objects show hardly any emission features in their spectrum, in other words, they are standard elliptical galaxies. However, at higher the ratio progressively diminishes and becomes for the objects with the highest . Such objects are mostly of the HEG type. We can conclude that the UV excess and the IR flattening are closely related. All objects appear to have the same behaviour: if we consider only HEGs, the linear regression remains practically the same and is still highly significant () , even if there are fewer objects.
For some objects (shown at the end in Fig. 1), additional far-IR data, up to 100 or even 200 m, are available. They can be easily interpreted as radiation from dust with temperatures in the range of a few tens up to almost 1000 K. According to Dicken et al. (dicken10 (2010); dicken12 (2012); dicken14 (2014)), the warm dust must be heated by the AGN and not by young stars. They mainly used powerful radio galaxies, and these also show conspicuous dust emission in our sample. Dicken et al. (dicken12 (2012)) stated that only about 35 % of their sample galaxies showed signs of recent star formation. As we show in Sect. 4, this is not true for the present sample, which contains many more FR I radio galaxies.
3.8 XUV and black hole masses
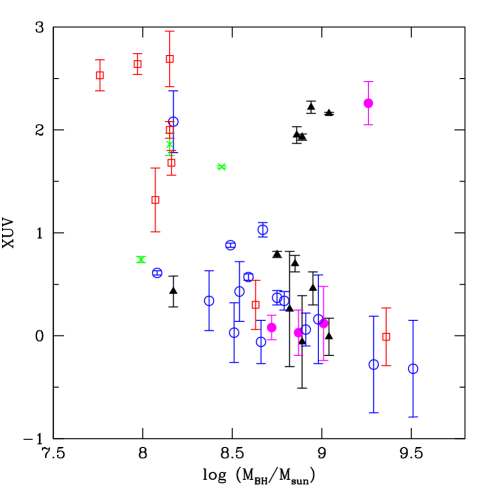
It is known that the more massive central black holes are found in low-luminosity radio sources (see for a detailed discussion Best & Heckman best12 (2012)), and, considering our previous results on the dependence of on radio power, we may expect that there is also a dependence of black hole mass on . Using the data given in Table LABEL:tab:results, we plot the black hole mass against for objects with known values of both parameters. Some interesting trends can be seen in Fig. 11. If we consider only HEGs (open squares), there is a strong anti-correlation: in galaxies without a UV excess (, for instance) the black hole (BH) mass tends to be high, of the order of , while the galaxies with have . Of the galaxies with only weak emission lines (open circles), all except one have and cover on average the same region as the HEGs without large UV excess. We note that a similar but much weaker anti-correlation between BH mass and may also be present for these objects.
A group of objects deviates from this trend, with black hole masses of the order of , but also strong UV excess, of the order of 2 magnitudes. Their UV excess is genuine, however.
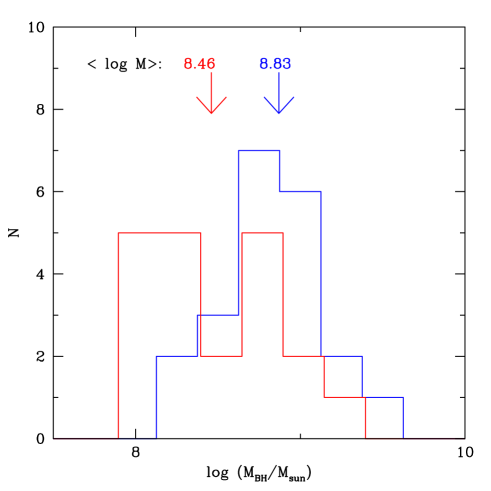
In spite of this complication, higher values of tend to be accompanied by lower black holes masses, as can be seen in Fig. 12. Here we plot two histograms of objects with and 0.6. The particular value of 0.6 was chosen to obtain similar numbers in the two histograms. The distributions are clearly different. Objects with not very different from zero have , while galaxies with higher have , a difference at the level. Thus, on average, a high is accompanied by a black hole mass that is about 2.5 times lower than the black hole masses of galaxies without an additional UV component.
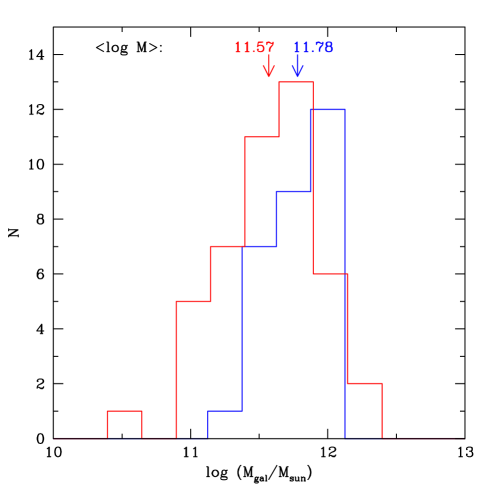
It is known that galaxies hosting FRII radio sources tend to be less massive (Best & Heckman best12 (2012); Kauffmann et al. kauffmann08 (2008)). More precisely, Kauffmann et al. (kauffmann08 (2008)) found lower galaxy masses for galaxies that display (strong) emission lines, that is, for HEGs. As remarked by Best & Heckman (best12 (2012)), the different spectral types are also related to the FRI/FRII type (see also Fig. 7), but the precise relations between all these parameters remains uncertain. Because of the limited amount of data used in this paper, we cannot provide more detail, except to draw attention to the fact that we also found a difference in galaxy mass between objects with high and low values. This is shown in Fig. 13; we have taken a slightly different separation value of to again obtain a similar number of objects in the two histograms. As in Fig. 12, we obtain a difference at a similar significance level (in this case ). This is therefore in line with the findings of Kauffmann et al. (kauffmann08 (2008)) and Best & Heckman (best12 (2012)), if we remember that high values correspond roughly to HEG and LEG type spectra, which in turn approximately correspond to FRII-type radio sources.
The histograms of Figs. 12 and 13 suggest that there may be a relation between and , which would of course be expected on the basis of the famous relation between and (Ferrarese & Merritt ferrarese00 (2000); Marconi & Hunt marconi03 (2003); Häring & Rix haring04 (2004)). Indeed, there is such a relation, but this is strictly valid only for objects with weak emission lines. Moreover, the scatter is quite large, and this is easy to infer from the histograms in Figs. 12 and 13.
4 Discussion
The first far-UV detections of a few selected galaxies were made about 45 years ago, when dedicated satellites (like the Orbiting Astronomical Observatory-2; see Code code69 (1969)) opened up the UV window. It was discovered very soon that some elliptical galaxies surprisingly showed an increase in flux from the visible to the far UV (Code & Welch code79 (1979); Bertola et al. bertola80 (1980); a recent introduction on the subject can be found in Jeong et al. jeong12 (2012)). Various explanations have been put forward, usually based on specific stellar populations or metallicity effects. It is not clear whether this is a general property of early-type galaxies that is also shared by other types of ellipticals, for example those that are radio-loud or X-ray bright. Trump et al. (trump09 (2009)) found that about 30 % of X-ray bright, but optically ”dull” early-type galaxies (passive red galaxies) exhibit weak but significant blue emission, presumably originating in the (unabsorbed) nucleus.
That UV emission and the morphology of radio sources may be closely connected has been known since the work of McCarthy et al. (mccarthy87 (1987)): they found that in distant radio sources the UV emission is aligned with the radio structure. However, this result is based on very high redshift sources.
Only very recently, far-UV data are routinely available, thanks to the very powerful GALEX mission, and therefore different types of radio-loud objects can now be studied easily down to about 1000 Å. Fanti et al. (fanti11 (2011)) performed such a study and analysed compact steep spectrum (CSS) radio sources. They concluded that an ultraviolet excess (with respect to the SED of a passively evolving elliptical galaxy) is present in most of these galaxies. This UV excess is, according to them, due to a young stellar population, which is not directly caused by the radio source: both the young stars and the radio source are the result of a recent wet major merger.
We here analysed the overall SED of low-redshift () B2 and 3C radio galaxies from the far-UV to the near-IR. It is immediately clear (Fig. 6) that weaker radio galaxies, basically FR I type radio galaxies, show little evidence for a UV excess. These FRI galaxies mainly have few, if any, emission lines (except for a few LEGs) and can therefore be considered to be the radio equivalent of the X-ray bright optically dull galaxies of Trump et al. (trump09 (2009)). However, the UV behaviour is quite different because the weak but significant UV component seen by Trump et al. (trump09 (2009)) is absent from the ”optically dull” FRI radio galaxies.
Several parameters appear to be closely linked, viz. the strength of the emission lines, or more specifically, the spectral type, the UV excess as measured by our parameter and the radio power. The parameter correlation is shown in Figs. 6 - 8. These figures strongly suggest that there is a fundamental difference between FRI and FRII sources, as the behaviour in the various plots is very different below and above WHz-1, which is the standard luminosity (at 1.4 GHz) that separates FRI from FRII sources. Below this, there is no correlation at all in any of the figures, while above this, all plots show a rather abrupt onset of UV excess and strong line luminosities. Especially remarkable is the close correlation of and luminosity (if W), while at lower luminosity a correlation is entirely absent. Therefore the spectral features typical of HEGs, and less obviously LEGs, appear to be closely related to an excess UV flux. In fact, Baldi & Capetti (baldi08 (2008)) concluded that only HEGs are associated with powerful AGN, probably triggered by a recent wet major merger. They ascribed the enhanced UV flux to recent star formation and stated that LEGs do not show enhanced SF with respect to quiescent galaxies. We note, however, that B2 1141+37, B2 1430+25, B2 1350+31 (3C 293), and 3C 321 (Holt et al. holt07 (2007); Tadhunter et al. tadhunter11 (2011)) are LEGs with enhanced star formation (see Table 5).
So far, we have only indirectly dealt with the question of AGN vs. star formation. However, for a number of galaxies more information exists that can be used to obtain a more definite answer. To this end, we used four different methods, the results of which are summarized in Table 5. In Cols. 1 and 7 we list the names of the radio galaxies. We inspected the SDSS spectra, if available, to determine whether there are (post-)starburst signs. In some cases, higher Balmer lines in absorption are clearly present. These galaxies are denoted by ”SF” in Cols. 2 and 8 (”Balmer”).
|
||||||||||||||||||||||||||||||||||||||||||||||||||||||||||||||||||||||||||||||||||||||||||||||||||||||||||||||||||||||||||||||||||||||||||||||||||||||||||||||||||||||||||||||||||||||||||||||||||||||||||||||||||||||||||||||||||||||||||||||||||||||||||||||
We also used emission-line diagnostics (see Table LABEL:tab:results). If a galaxy has a typical HEG or Seyfert-like spectrum, it is classified as AGN in Cols. 3 and 9. Some galaxies with classification ”H” for an HII-like spectrum are also listed in Cols. 3 and 9 (”Diagn.”). We note that many FR I galaxies have very few if any emission lines and thus cannot be classified.
Another empirical test, first introduced by de Grijp et al. (degrijp85 (1985)) and revisited by Dicken et al. (dicken12 (2012)), concerns the ratio of far- and mid-IR. If this ratio is higher than 5, it indicates star formation, below 2.5 it indicates an AGN, and in between a mixture between the two. We show the result in Cols. 4 and 10 (”FIR/MIR”).
Finally, we can make use of the strengths of the nucleus in the optical and radio, provided we have HST data, which we have taken for a number of the B2 and 3C sources from Capetti et al. (capetti02 (2002)) and Chiaberge, Capetti, & Celotti (chiaberge99 (1999)). Assuming a power-law and extrapolating the observed HST strength down to 2000 Å using the mean spectral index 1.3 found between the radio and HST, we compared this with the UV excess found at 2000 Å. If a power law reaches % of the observed UV excess, we conclude that the radiation from an AGN is dominant. We note that the choice of 1.3 for the spectral index is not critical if we assume that a non-thermal power-law slope should be in the interval 1-1.5. Any variation will not be larger than 30 %. The results are given in Cols. 5 and 11 (”P.L.”). An overall assessment, based on these four methods, is given in Cols. 6 and 12 (”Overall”).
Most HEG sources in this table tend to have IR emission originating in AGN heated dust, while in other types of sources (with weak emission lines) the origin tends to be young stars. There are a few exceptions, however, like 3C 285. In the large majority of FR I sources, there is no sign of an AGN continuum either in the UV or in IR, and at most some star formation may be present.
The available data on black hole masses point to a relatively clear anti-correlation between and black hole mass (see Fig. 11): high black hole masses tend to have no UV excess, while the highest , , for example, on average have ten times lower ( instead of ). The only deviation comes from a group of five galaxies (four of which have no known spectral type, while the fifth does not have emission lines), with relatively high and high black hole mass. In any case, the correlations involving the mass of black hole or galaxy mass have a large scatter, as can be inferred from Figs. 11 and 12. This is to be expected, since in the mass (black hole or galaxy) - radio power plane the FR I and FRII sources occupy a wide range in both these parameters (see Ghisellini & Celotti ghisellini01 (2001)), while the dividing line between FRI and FRII is tilted in a way such that radio sources remain FR I type at high radio powers if the galaxy mass (and by extrapolation the black hole mass) is higher (Ledlow & Owen ledlow96 (1996)). The net result would be that FRI sources have on average a higher galaxy and black hole mass than FR II sources, even if the scatter should be large since both types cover large parts of the mass-radio power plane. Therefore the systematic difference in black hole mass and galaxy mass discussed by Kauffmann et al. (kauffmann08 (2008)) and Best & Heckman (best12 (2012)) may be a selection effect.
The FRI-FRII dichotomy may be directly related to different accretion rates (Ghisellini & Celotti ghisellini01 (2001)), which in turn may be due to the merger history of the parent galaxy (Baldi & Capetti baldi08 (2008)); therefore low- and high-luminosity radio sources are fundamentally different not only in their radio and optical properties, but also in the way they were formed.
5 Summary
We summarize here the main points that have been treated in this paper.
-
•
We used GALEX, SDSS, and 2MASS photometry to fit SEDs of nearby radio galaxies taken from a compound B2/3C sample. We first attempted a fit with a model of a passively evolving old elliptical galaxy. In many cases, a second component was needed to produce a satisfactory fit (we tried both a young stellar component and a power-law type).
-
•
We used the parameter to quantify the excess in the UV over the basic, old, passively evolving galaxy SED (usually years old).
-
•
The behaviour of is very similar to that of the emission lines strength as measured by . Both correlate with radio power in the FRII regime.
-
•
At low radio powers no correlation is found at all, basically being close to zero. This same kind of behaviour is also seen for the luminosity.
-
•
In contrast with X-ray bright ”optically dull” galaxies (Trump trump09 (2009)), for instance, in the FRI dull galaxies (without a trace of AGN or SF activity in the optical spectrum), no UV excess radiation is seen.
-
•
In many FRII/HEG radio galaxies with strong emission, a young stellar component may result in a satisfactory fit, but this does not necessarily provide enough ionizing UV photons that would justify the strength the emission.
-
•
A correlation exists between the UV excess, as measured by , and the ratio of near- and far-IR WISE bands: flattening of the SED in the IR is accompanied by an increasingly strong . This correlation is close to linear, in the sense that the excess UV luminosity is directly proportional to the excess IR luminosity (both measured with respect to the underlying old elliptical galaxy).
-
•
Analysis of a number of parameters based on the optical spectra, the ratio of far- and near-IR strengths, and of the ratio of the strength of the nucleus in the optical and radio led to the conclusion that the HEG sources (which are in general the most powerful radio sources as well) show AGN radiation in both the UV and IR, while sources with weaker emission lines and typically FR I sources tend to have star formation signatures and little evidence for AGN radiation.
-
•
There appears to be a general (inverse) correlation between the mass of the central black hole and (although with the caution that a few objects appear to deviate from this general trend; it is not clear if this deviation is genuine or due to problems with the derivation of ).
-
•
We confirm some trends that are known from the literature: there is evidence that the mass of black holes is higher (by a factor of about 2-3) for objects without excess, and this translates, via the correlation of and radio power or spectral type, into the known fact that LEGs, ”dull”, and FRI radio galaxies have on average higher black hole masses than HEGs and FRII radio galaxies (Best & Heckman best12 (2012) and references therein). A similar effect is seen for the mass of the galaxy instead of the black hole mass: again the FRI radio galaxies are more massive than FRII/HEGs by about a factor 2.
-
•
We conclude that all these points indicate a fundamental difference between FRI and FRII galaxies.
Acknowledgements.
We thank the referee, whose comments forced us to rethink many parts of this work, but were stimulating and in the end very helpful. We made use of a number of on-line data bases. The Galactic Evolution Explorer (GALEX) is operated for NASA by the California Institute of Technology under NASA contract NAS5-98034. URL: http://www.galex.caltech.edu. Funding for the SDSS and SDSS-II has been provided by the Alfred P. Sloan Foundation, the Participating Institutions, the National Science Foundation, the U.S. Department of Energy, the National Aeronautics and Space Administration, the Japanese Monbukagakusho, the Max Planck Society, and the Higher Education Funding Council for England. The SDSS Web Site is http://www.sdss.org/. The SDSS is managed by the Astrophysical Research Consortium for the Participating Institutions. The Participating Institutions are the American Museum of Natural History, Astrophysical Institute Potsdam, University of Basel, University of Cambridge, Case Western Reserve University, University of Chicago, Drexel University, Fermilab, the Institute for Advanced Study, the Japan Participation Group, Johns Hopkins University, the Joint Institute for Nuclear Astrophysics, the Kavli Institute for Particle Astrophysics and Cosmology, the Korean Scientist Group, the Chinese Academy of Sciences (LAMOST), Los Alamos National Laboratory, the Max-Planck-Institute for Astronomy (MPIA), the Max-Planck-Institute for Astrophysics (MPA), New Mexico State University, Ohio State University, University of Pittsburgh, University of Portsmouth, Princeton University, the United States Naval Observatory, and the University of Washington. This publication makes use of data products from the Two Micron All Sky Survey, which is a joint project of the University of Massachusetts and the Infrared Processing and Analysis Center/California Institute of Technology, funded by the National Aeronautics and Space Administration and the National Science Foundation. URL: http://www.ipac.caltech.edu/2mass/. This publication makes use of the data products from the Wide-field Infrared Explorer, which is a joint project of the University of California, Los Angeles, and the Jet Propulsion Laboratory/California Institute of Technology, funded by the National Aeronautics and Space Administration. URL: http://wise2.ipac.caltech.edu/docs/release/allsky/expsup/. We acknowledge the usage of the HyperLeda database (http://leda.univ-lyon1.fr). This research has made use of the NASA/IPAC Extragalactic Database (NED) which is operated by the Jet Propulsion Laboratory, California Institute of Technology, under contract with the National Aeronautics and Space Administration.References
- (1) Abazijian, K. N., Adelman-McCarthy, J. K., Agueros, M. A., et al. 2009, ApJS, 182, 543
- (2) Allen, M. G., Sparks, W. B., Koekemoer, A., et al. 2002, ApJS, 139, 411
- (3) Allen, S. W., Dunn, R. J. H., Fabian, A. C., Taylor, G. B., & Reynolds, C. S. 2006, MNRAS, 372, 21
- (4) Baldi, R. D. & Capetti, A. 2008, A&A, 489, 989
- (5) Baldi, R. D., & Capetti, A. 2009, A&A, 508, 603
- (6) Baum, A. S., Zirbel, E. Z., & O’Dea, C. P. 1995, ApJ, 451, 88
- (7) Bertola, F., Capaccioli, M., Holm, A. V., & Oke, J. B. 1980, ApJ, 237, L65
- (8) Best, P. N. & Heckman, T. M. 2012, MNRAS, 421, 1569
- (9) Bettoni, D., Falomo, R., Fasano, G., & Govoni, F. 2003, A&A, 399, 869
- (10) Bettoni, D., Falomo, R., Parma, P., de Ruiter, H., & Fanti, R. 2009, A&A, 508, 1253
- (11) Binette, L., Magris, C. G., Stanińska, G., & Bruzual, A. G. 1994, A&A, 292, 13
- (12) Bruzual, G. & Charlot, S. 2003, MNRAS, 344, 1000
- (13) Budavári, T., Heinis, S., Szalay, A. S., et al. 2009, ApJ, 694, 1281
- (14) Bureau, M., Jeong, H., Yi, S. K., et al. 2011, MNRAS, 414, 1887
- (15) Buttiglione, S., Capetti, A., & Celotti, A. 2008, Mem. S. A. It., 79, 1018
- (16) Buttiglione, S., Celotti, A., Capetti, A., Dallacasa, D., D’Odorico, V., & Giovannini, G. 2009a, Astron. Nachr., 330, 237
- (17) Buttiglione, S., Capetti, A., Celotti, A. et al. 2009b, A&A, 495, 1033
- (18) Buttiglione, S., Capetti, A., Celotti, A., et al. 2010, A&A, 509, A6
- (19) Capetti, A., de Ruiter, H. R., Fanti, R., Morganti, R., Parma, P., & Ulrich, M.-H. 2000, A&A, 362, 871
- (20) Capetti, A., Celotti, A., Chiaberge, M., et al. 2002, A&A, 383, 104
- (21) Capetti, A., Buttiglione, S., Axon, D. J., et al. 2011, A&A, 527, L2
- (22) Chabrier, G. 2003, PASP, 115, 763
- (23) Chiaberge, M., Capetti, A., & Celotti, A. 1999, A&A, 349, 77
- (24) Cid Fernandes, R., Stasińska, G., Schlickmann, M. S., et al. 2010, MNRAS, 403, 1036
- (25) Cid Fernandes, R., Stasińska, G., Mateus, A., Vale Asari, N., 2011, MNRAS, 413, 1687
- (26) Code, A. D. 1969, PASP, 81, 475
- (27) Code, A. D. & Welch, G. A. 1979, ApJ, 228,95
- (28) de Grijp, M. H. K., Miley, G. K., Lub, J., & de Jong, T. 1985, Nature, 314, 240
- (29) de Koff, S., Best, P., Baum, S. A., et al. 2000, ApJS, 129, 33
- (30) Deo, R. P., Richards, G. T., Crenshaw, D. M., Kraemer, S. B. 2009, ApJ, 705, 14
- (31) de Ruiter, H. R., Parma, P., Fanti, C., & Fanti, R. 1990, A&A, 227, 351
- (32) de Ruiter, H. R., Parma, P., Capetti, A., Fanti, R., Morganti, R. 2002, A&A, 396, 857
- (33) Dicken, D., Tadhunter, C., Axon, D., Robinson, A., Morganti, R., & Kharb, P. 2010, ApJ, 722, 1333
- (34) Dicken, D., Tadhunter, C., Axon, D., et al. 2012, ApJ, 745, 172
- (35) Dicken, D., Tadhunter, C., Morganti, R., et al. 2014, ApJ, 788, 98
- (36) Elvis, M., Willner, S. P., Fabbiano, G., Carleton, N. P., Lawrence, A., & Ward, M. 1984, ApJ, 280, 574
- (37) Emonts, B. H. C., Morganti, R., Tadhunter, C. N., et al. 2006, A&A, 454,125
- (38) Evans, D. A., Hardcastle, M. J., & Croston, J. H. 2008, in Extragalactic jets: theory and observations from radio to gamma ray, eds. T. A. Rector, D. S. de Young, ASPC, 386, 161
- (39) Fanaroff, B. L. & Riley, J. M. 1974,MNRAS, 167, 31
- (40) Fanti, C., Fanti, R., de Ruiter, H. R., & Parma, P. 1987, A&AS, 69, 57
- (41) Fanti, C., Fanti, R., Zanichelli, A., Dallacasa, D., & Stanghellini, C. 2011, A&A, 528, A110
- (42) Ferrarese, L. & Merritt, D. 2000, ApJ, 539, L9
- (43) Frogel, J. A., Becklin, E. E., Neugebauer, G., Matthews, W. G., Persson, S. E., & Aaronson, M. 1975, ApJ, 200L,123
- (44) Ghisellini, G. & Celotti, A. 2001, A&A, 379, L1
- (45) Golombek, D., Miley, G. K., & Neugebauer, G. 1988, AJ, 95, 26
- (46) Gürkan, G., Hardcastle, M. J., & Jarvis, M. J. 2014, MNRAS, 438, 1149
- (47) Hardcastle, M. J., Evans, D. A., & Croston, J. H. 2007, MNRAS, 376, 1849
- (48) Hardcastle, M. J., Evans, D. A., & Croston, J. H. 2009, MNRAS, 396, 1929
- (49) Häring, N. & Rix, H.-W. 2004, ApJ, 604, L89
- (50) Hildebrand, R. H. 1983, QJRAS, 24, 267
- (51) Hine, R. G. & Longair, M. S. 1979, MNRAS, 188, 111
- (52) Holt, J., Tadhunter, C. N., González Delgado, R. M., et al., 2007, MNRAS, 381, 611
- (53) Jarrett, T. H., Masci, F., Tsai, C.W., et al. 2013, AJ, 145, 6
- (54) Jeong, H., Yi, S., Bureau, M., et al. 2012, MNRAS, 423, 1921
- (55) Kauffmann, G., Heckman, T.M., & Best, P.N. 2008, MNRAS, 384, 953
- (56) Kewley, L. J., Groves, B., Kauffmann, G., & Heckman, T. 2006, MNRAS, 372, 961
- (57) Knapp, G. R., Bies, W. E., & van Gorkom, J. H. 1990, AJ, 99, 476
- (58) Laing, R. A., Riley, J. M., & Longair, M. S. 1983, MNRAS, 125, 75
- (59) Laing, R. A., Jenkins, C. R., Wall, J. V., & Unger, S. W. 1994, Spectrophotometry of a Complete Sample of 3CR radio sources: implications for Unified Models, in The first Stromlo Symposium: Physics of Active Galaxies, ed. Bicknell, G. V., Dopita, M. A., Quinn, P. J. (Cambridge University Press, Cambridge), p. 201
- (60) Ledlow, M. J. & Owen, F. N. 1996, AJ, 112, 9
- (61) Leon, S., Lim, J., & Dinh-v-Trung 2003, in Active Galactic Nuclei: from central engine to host galaxy, ed. S. Collin, F. Combes & I. Shlosman, ASPC, 290, 525
- (62) Lilly, S. J., Longair, M. S., & Miller, L. 1985, MNRAS, 214, 109L
- (63) Lim, J., Leon, S., Combes, F., & Dinh-v-Trung 2003, in Active Galactic Nuceli: from central engine to host galaxy, ed. S. Collin, F. Combes & I. Shlosman, ASPC, 290, 529
- (64) Maiolino, R., Ruiz, M., Rieke, G. H., & Keller, L. D. 1995, ApJ, 446, 501
- (65) Marconi, A. & Hunt, L. K. 2003, ApJ, 589, L21
- (66) Martin, D. C., Fanson, J., Schiminovich, D., et al. 2005, ApJ, 619, L1
- (67) McCarthy, P. J., van Breugel, W., Spinrad, H., & Djorgovski, S. 1987, ApJ, 321, L29
- (68) Mezcua, M., Lobanov, A. P., Chavushyan, V., & León-Tavares, J. 2011, A&A, 527, 38
- (69) Moshir,M., Kopan, G., Conrow, T., et al. 1990, BAAS, 22, 1325
- (70) Ocaña Flaquer, B., Leon, S., Combes, F., & Lim, J. 2010, A&A, 518, A9
- (71) Ogle, P., Whysong, D., & Antonucci, R. 2006, ApJ, 647, 161
- (72) Osterbrock, D. E. & Ferland, G. J. 2006, Astrophysics of gaseous nebulae and active galactic nuclei, University Science Books
- (73) Paturel, G., Petit C., Prugniel P., et al. 2003, A&A, 412, 45
- (74) Prandoni, I., Laing, R. A., Parma, P., de Ruiter, H. R., Montenegro-Montes, F. M., & Wilson, T. L. 2007, New A Rev., 51, 43
- (75) Prandoni, I., Laing, R. A., de Ruiter, H. R., & Parma, P. 2010, A&A, 523, A38
- (76) Rawlings, S. & Saunders, R. 1989, Using narrow emission lines to test physical models unifying AGNs, in Active Galactic Nuclei, IAU Symposium 134, ed. Osterbrock, D. A. and Miller, J. S. (Kluwer, Dordrecht), p. 305
- (77) Sargsyan, L., Weedman, D., Lebouteiller, V., et al. 2011, ApJ, 730, 19
- (78) Saripalli, L. 2012, AJ, 144, 85
- (79) Shi,Y., Rieke, G. H., Heines, D. C., et al. 2005, ApJ, 629, 88
- (80) Siebenmorgen, R., Freudling, W., Krugel, E., & Haas, M. 2004, A&A, 421, 129
- (81) Skrutskie, M. F., Cutri, R. M., Stiening, R., et al. 2006, AJ, 131, 1163
- (82) Snellen, I. A. G., Lehnert, M. D., Bremer, M. N., & Schilizzi, R. T. 2003, MNRAS, 342, 889
- (83) Tadhunter, C. N., Morganti, R., Robinson, A., Dickson, R. D., Villar-Martín. M., & Fosbury, R. A. E. 1998, MNRAS, 298, 1035
- (84) Tadhunter, C., Holt, J., González Delgado, R., et al. 2011, MNRAS, 412, 960
- (85) Tang Yuping, Gu, Q.-S., Huang, J.-S., & Wang, Y.-P. 2009, MNRAS, 397, 1966
- (86) Temi, P., Brighenti, F., Mathews, W., & Bregman, J. D. 2004, ApJS, 151, 237
- (87) Temi, P., Brighenti, F., & Mathews, W. G. 2009, ApJ, 695, 1
- (88) Tremaine, S., Gebhardt, K, Bender, R., et al. 2002, ApJ, 574, 740
- (89) Trump, J. R., Impey, C. D., Taniguchi, Y., et al. 2009, ApJ, 706, 797
- (90) Ulrich, M.-H., Kinman, T. D., Lynds, C. R., Rieke, G. H., & Ekers, R. D. 1975, ApJ, 198, 261
- (91) van Dokkum, P. G. & Franx, M. 1995, AJ, 110, 2027
- (92) Verdoes-Kleijn, G. A., Baum, S. A., de Zeeuw, P. T., & O’Dea, C. P. 1999, AJ, 118, 2592
- (93) Willmer, C. N. A., Rieke, G. H., LeFloc’h, E. et al. 2009, AJ, 138, 146
- (94) Wright, E. L., Eisenhardt, P. R. M., Mainzer, A. K., et al. 2010, AJ, 140, 1868
- (95) Wyder, T. K., Martin, D. C., Schiminovich, D., et al. 2007, ApJS, 173, 293
- (96) Xiao-hong, Pei-sheng, C., & Yan, H. 2015, Archiv:1502.05800v1
- (97) Xilouris, E. M., Madden, S. C., Galliano, F., Vigroux, L., & Sauvage, M. 2004, A&A, 416, 41
- (98) Zirbel, E. L. & Baum, S. A. 1995, ApJ, 448, 521
| Source | ||||||||
|---|---|---|---|---|---|---|---|---|
| 0034+25 | 10.08 | 0.01 | 10.11 | 0.01 | 9.34 | 0.06 | 7.87 | 0.37 |
| 0648+27 | 10.40 | 0.01 | 9.07 | 0.01 | 5.80 | 0.01 | 2.88 | 0.01 |
| 0755+37 | 10.12 | 0.01 | 10.10 | 0.01 | 9.22 | 0.05 | 7.81 | 0.37 |
| 0800+24 | 11.97 | 0.01 | 12.01 | 0.01 | 11.87 | 0.26 | 0.00 | 0.00 |
| 0828+32 | 11.99 | 0.01 | 11.95 | 0.01 | 11.11 | 0.12 | 8.50 | 0.38 |
| 0836+29 | 11.10 | 0.01 | 11.03 | 0.01 | 10.41 | 0.13 | 8.56 | 0.85 |
| 0836+29A | 11.54 | 0.01 | 10.53 | 0.01 | 7.71 | 0.01 | 4.93 | 0.02 |
| 0838+32 | 11.42 | 0.01 | 11.38 | 0.01 | 10.48 | 0.09 | 9.35 | 0.85 |
| 0844+31 | 10.80 | 0.01 | 10.75 | 0.01 | 10.39 | 0.10 | 8.65 | 0.45 |
| 0908+37 | 12.09 | 0.01 | 12.00 | 0.01 | 11.75 | 0.18 | 9.88 | 0.99 |
| 0913+38 | 12.96 | 0.01 | 12.91 | 0.02 | 12.15 | 0.24 | 9.15 | 0.48 |
| 0924+30 | 13.55 | 0.02 | 13.60 | 0.03 | 11.94 | 0.00 | 8.36 | 0.00 |
| 1003+26 | 12.20 | 0.01 | 12.07 | 0.02 | 12.16 | 0.43 | 10.00 | 1.68 |
| 1005+28 | 12.96 | 0.01 | 12.84 | 0.01 | 12.56 | 0.32 | - | - |
| 1037+30 | 12.91 | 0.01 | 12.83 | 0.01 | 10.97 | 0.07 | 8.87 | 0.31 |
| 1102+30 | 11.50 | 0.01 | 11.45 | 0.01 | 10.85 | 0.10 | 9.45 | 0.83 |
| 1108+27 | 10.10 | 0.01 | 10.11 | 0.01 | 8.59 | 0.02 | 7.42 | 0.20 |
| 1113+24 | 11.88 | 0.01 | 11.79 | 0.01 | 11.74 | 0.25 | 9.32 | 0.65 |
| 1116+28 | 11.19 | 0.01 | 11.19 | 0.01 | 10.84 | 0.12 | 10.14 | 2.44 |
| 1122+39 | 7.68 | 0.01 | 7.69 | 0.01 | 6.01 | 0.01 | 4.45 | 0.04 |
| 1141+37 | 12.97 | 0.02 | 12.73 | 0.03 | 11.07 | 0.14 | 8.42 | 0.32 |
| 1144+35 | 11.38 | 0.01 | 11.02 | 0.01 | 8.97 | 0.02 | 6.78 | 0.06 |
| 1204+24 | 12.50 | 0.01 | 12.48 | 0.02 | 11.98 | 0.22 | 10.54 | 1.98 |
| 1204+34 | 12.05 | 0.01 | 11.49 | 0.01 | 9.16 | 0.02 | 6.80 | 0.05 |
| 1217+29 | 7.25 | 0.01 | 7.28 | 0.01 | 6.44 | 0.02 | 5.25 | 0.13 |
| 1243+26 | 15.99 | 0.05 | 15.76 | 0.13 | 12.73 | 0.00 | 9.17 | 0.00 |
| 1254+27 | 10.22 | 0.01 | 10.20 | 0.01 | 8.35 | 0.02 | 6.97 | 0.10 |
| 1256+28 | 10.71 | 0.01 | 10.78 | 0.01 | 10.30 | 0.08 | 8.80 | 0.49 |
| 1257+28 | 9.12 | 0.01 | 9.15 | 0.01 | 8.63 | 0.07 | - | - |
| 1303+31 | 13.25 | 0.02 | 13.02 | 0.03 | 12.02 | 0.00 | 8.97 | 0.00 |
| 1316+39 | 12.39 | 0.01 | 12.16 | 0.01 | 10.45 | 0.06 | 8.35 | 0.27 |
| 1321+31 | 9.57 | 0.01 | 9.62 | 0.01 | 8.93 | 0.05 | 7.57 | 0.26 |
| 1322+36 | 9.77 | 0.01 | 9.77 | 0.01 | 8.97 | 0.03 | 7.22 | 0.09 |
| 1339+26 | 11.48 | 0.01 | 11.44 | 0.01 | 11.20 | 0.19 | 9.27 | 1.05 |
| 1346+26 | 11.16 | 0.01 | 11.21 | 0.01 | 10.33 | 0.08 | 9.47 | 0.64 |
| 1347+28 | 12.65 | 0.01 | 12.63 | 0.02 | 12.39 | 0.31 | - | - |
| 1350+31 | 10.98 | 0.01 | 10.59 | 0.01 | 8.19 | 0.03 | 6.21 | 0.04 |
| 1357+28 | 11.76 | 0.01 | 11.76 | 0.01 | 11.61 | 0.18 | 9.47 | 0.74 |
| 1422+26 | 11.30 | 0.01 | 11.21 | 0.01 | 9.79 | 0.03 | 7.94 | 0.19 |
| 1430+25 | 15.90 | 0.11 | 16.02 | 0.32 | 11.65 | 0.19 | 8.20 | 0.27 |
| 1447+27 | 10.70 | 0.01 | 10.71 | 0.01 | 10.04 | 0.04 | 9.65 | 0.84 |
| 1450+28 | 12.25 | 0.01 | 12.14 | 0.01 | 12.05 | 0.20 | 12.09 | 5.04 |
| 1455+28 | 13.40 | 0.03 | 12.95 | 0.04 | 9.46 | 0.04 | 6.17 | 0.07 |
| 1457+29 | 13.44 | 0.01 | 13.08 | 0.01 | 11.63 | 0.07 | 9.20 | 0.37 |
| 1502+26 | 12.35 | 0.02 | 12.41 | 0.02 | 11.51 | 0.13 | 8.80 | 0.00 |
| 1511+26 | 13.60 | 0.03 | 13.37 | 0.03 | 11.07 | 0.10 | 8.47 | 0.27 |
| 1512+30 | 11.95 | 0.01 | 11.86 | 0.01 | 11.47 | 0.10 | 9.78 | 0.94 |
| 1521+28 | 12.04 | 0.01 | 11.99 | 0.01 | 11.48 | 0.09 | 9.95 | 0.75 |
| 1553+24 | 11.33 | 0.01 | 11.33 | 0.01 | 10.69 | 0.08 | 10.14 | 1.38 |
| 1557+26 | 11.54 | 0.01 | 11.52 | 0.01 | 10.86 | 0.10 | 9.10 | 0.48 |
| 1609+31 | 13.19 | 0.01 | 13.15 | 0.02 | 13.38 | 0.55 | 10.34 | 1.23 |
| 1610+29 | 10.04 | 0.01 | 10.06 | 0.01 | 9.64 | 0.07 | 8.59 | 0.43 |
| 1613+27 | 12.44 | 0.01 | 12.48 | 0.02 | 12.21 | 0.39 | 9.56 | 0.68 |
| 1615+32 | 11.40 | 0.02 | 10.51 | 0.02 | 8.12 | 0.02 | 5.97 | 0.50 |
| 1615+35 | 10.46 | 0.01 | 10.48 | 0.01 | 9.73 | 0.07 | 8.11 | 0.38 |
| 1621+38 | 9.67 | 0.01 | 9.68 | 0.01 | 9.13 | 0.03 | 8.20 | 0.34 |
| 1626+39 | 9.24 | 0.01 | 9.29 | 0.01 | 8.70 | 0.04 | 7.44 | 0.24 |
| 1637+29 | 11.74 | 0.01 | 11.68 | 0.01 | 11.27 | 0.11 | 9.20 | 0.48 |
| 1638+32 | 12.83 | 0.01 | 12.65 | 0.01 | 11.80 | 0.14 | 10.17 | 1.00 |
| 1643+27 | 12.56 | 0.01 | 12.48 | 0.01 | 12.19 | 0.26 | 11.04 | 2.41 |
| 1652+39 | 9.52 | 0.01 | 9.15 | 0.01 | 7.45 | 0.01 | 5.46 | 0.03 |
| 1657+32 | 12.24 | 0.01 | 12.23 | 0.01 | 11.91 | 0.21 | - | - |
| 1658+32 | 12.89 | 0.01 | 12.82 | 0.02 | 11.90 | 0.20 | 9.28 | 0.50 |
| 1658+30A | 11.02 | 0.01 | 11.02 | 0.01 | 10.50 | 0.06 | 9.81 | 0.60 |
| 1726+31 | 13.27 | 0.01 | 12.90 | 0.02 | 11.47 | 0.11 | 8.45 | 0.18 |
| 3C192 | 12.44 | 0.01 | 12.43 | 0.02 | 11.08 | 0.17 | 8.35 | 0.27 |
| 3C219 | 12.82 | 0.01 | 12.13 | 0.01 | 10.02 | 0.04 | 7.58 | 0.13 |
| 3C223 | 13.05 | 0.03 | 11.71 | 0.02 | 7.80 | 0.02 | 5.04 | 0.03 |
| 3C234 | 11.07 | 0.00 | 9.59 | 0.00 | 6.03 | 0.00 | 3.61 | 0.00 |
| 3C264 | 9.68 | 0.01 | 9.66 | 0.01 | 8.56 | 0.04 | 7.15 | 0.17 |
| 3C272.1 | 6.32 | 0.01 | 6.37 | 0.01 | 5.69 | 0.02 | 4.66 | 0.14 |
| 3C274 | 5.81 | 0.01 | 5.88 | 0.01 | 5.08 | 0.01 | 3.78 | 0.07 |
| 3C285 | 12.64 | 0.01 | 12.00 | 0.01 | 8.83 | 0.01 | 6.15 | 0.03 |
| 3C296 | 8.85 | 0.01 | 8.90 | 0.01 | 8.21 | 0.02 | 6.94 | 0.12 |
| 3C303 | 12.77 | 0.01 | 11.99 | 0.01 | 9.53 | 0.01 | 7.02 | 0.04 |
| 3C305 | 10.99 | 0.01 | 10.75 | 0.01 | 7.98 | 0.01 | 5.60 | 0.03 |
| 3C321 | 12.24 | 0.01 | 11.37 | 0.01 | 7.46 | 0.01 | 4.33 | 0.01 |
| 3C346 | 13.01 | 0.01 | 12.56 | 0.02 | 10.55 | 0.05 | 7.82 | 0.15 |
| Source | ||||||||||
|---|---|---|---|---|---|---|---|---|---|---|
| B2 0034+25 | 21.20 | 19.63 | 16.14 | 14.19 | 13.29 | 12.84 | 12.54 | 10.84 | 10.11 | 9.73 |
| 0.38 | 0.16 | 0.04 | 0.06 | 0.06 | ||||||
| B2 0648+27 | .. | .. | 16.03 | 14.32 | 13.74 | 13.42 | 13.17 | 11.82 | 11.16 | 10.59 |
| .. | .. | 0.04 | 0.04 | 0.04 | ||||||
| B2 0755+37 | 20.27 | 19.23 | 15.93 | 13.96 | 13.05 | 12.60 | 12.28 | 10.89 | 10.22 | 9.87 |
| 0.13 | 0.07 | 0.02 | 0.03 | 0.03 | ||||||
| B2 0800+24 | .. | .. | 17.51 | 15.50 | 14.61 | 14.16 | 13.82 | 12.70 | 11.95 | 11.75 |
| .. | .. | 0.04 | 0.06 | 0.06 | ||||||
| B2 0828+32 | .. | 21.42 | 17.53 | 15.60 | 14.68 | 14.25 | 13.90 | 12.85 | 11.94 | 11.71 |
| .. | 0.31 | 0.05 | 0.05 | 0.07 | ||||||
| B2 0836+29 | 21.05 | 21.54 | 17.52 | 15.28 | 14.28 | 13.78 | 13.44 | 12.27 | 11.16 | 10.60 |
| 0.34 | 0.35 | 0.10 | 0.07 | 0.07 | ||||||
| B2 0836+29A | 20.26 | 19.61 | 17.42 | 15.69 | 14.81 | 14.32 | 14.12 | 12.68 | 11.91 | 11.62 |
| 0.19 | 0.11 | 0.04 | 0.04 | 0.06 | ||||||
| B2 0838+32 | 20.77 | 19.91 | 17.47 | 15.50 | 14.58 | 14.12 | 13.77 | 12.28 | 11.38 | 11.22 |
| 0.18 | 0.10 | 0.04 | 0.05 | 0.05 | ||||||
| B2 0844+31 | 20.30 | 19.80 | 16.69 | 14.67 | 13.74 | 13.25 | 12.93 | 11.76 | 10.97 | 10.59 |
| 0.24 | 0.18 | 0.04 | 0.04 | 0.05 | ||||||
| B2 0908+37 | 21.29 | 21.57 | 17.95 | 15.91 | 14.91 | 14.45 | 14.13 | 12.71 | 12.19 | 11.64 |
| 0.44 | 0.42 | 0.05 | 0.07 | 0.08 | ||||||
| B2 0913+38 | .. | 21.55 | 18.34 | 16.54 | 15.69 | 15.26 | 14.96 | 13.73 | 13.15 | 12.72 |
| .. | 0.43 | 0.06 | 0.08 | 0.10 | ||||||
| B2 0915+32 | .. | 20.58 | 17.51 | 15.56 | 14.63 | 14.20 | 13.89 | 12.52 | 11.81 | 11.58 |
| .. | 0.27 | 0.05 | 0.07 | 0.09 | ||||||
| B2 0924+30 | 19.95 | 17.92 | 15.57 | 13.64 | 12.78 | 12.37 | 12.09 | 11.03 | 10.35 | 10.03 |
| 0.03 | 0.02 | 0.03 | 0.03 | 0.04 | ||||||
| B2 1003+26 | .. | 21.67 | 17.95 | 15.86 | 14.79 | 14.32 | 14.00 | 12.57 | 12.43 | 11.66 |
| .. | 0.44 | 0.04 | 0.10 | 0.08 | ||||||
| B2 1005+28 | 22.84 | 21.98 | 19.08 | 17.03 | 15.86 | 15.38 | 15.02 | 13.62 | 12.83 | 12.70 |
| 0.11 | 0.08 | 0.05 | 0.07 | 0.09 | ||||||
| B2 1037+30 | 20.66 | 19.36 | 17.89 | 16.39 | 15.67 | 15.24 | 14.96 | 13.79 | 13.04 | 12.54 |
| 0.25 | 0.11 | 0.09 | 0.11 | 0.11 | ||||||
| B2 1102+30 | 21.36 | 20.69 | 17.20 | 15.27 | 14.33 | 13.91 | 13.62 | 12.43 | 11.63 | 11.35 |
| 0.38 | 0.31 | 0.03 | 0.04 | 0.06 | ||||||
| B2 1108+27 | 20.77 | 19.28 | 16.32 | 14.31 | 13.32 | 12.83 | 12.46 | 11.19 | 10.38 | 10.13 |
| 0.24 | 0.11 | 0.02 | 0.02 | 0.03 | ||||||
| B2 1113+24 | .. | .. | 17.58 | 15.59 | 14.62 | 14.18 | 13.84 | 12.65 | 11.76 | 11.42 |
| .. | .. | 0.06 | 0.06 | 0.08 | ||||||
| B2 1116+28 | 21.29 | 20.20 | 16.95 | 14.97 | 14.04 | 13.62 | 13.31 | 11.96 | 11.21 | 11.06 |
| 0.27 | 0.13 | 0.03 | 0.03 | 0.04 | ||||||
| B2 1122+39 | 18.33 | 16.33 | 13.82 | 11.98 | 11.18 | 10.72 | 10.32 | 8.62 | 7.93 | 7.68 |
| 0.07 | 0.02 | 0.01 | 0.01 | 0.01 | ||||||
| B2 1141+37 | 22.49 | 22.17 | 19.53 | 17.78 | 16.81 | 16.35 | 15.99 | 14.21 | 13.21 | 12.82 |
| 0.43 | 0.30 | 0.07 | 0.07 | 0.08 | ||||||
| B2 1144+35 | 20.17 | 19.29 | 17.14 | 15.46 | 14.53 | 14.08 | 13.81 | 12.25 | 11.20 | 11.14 |
| 0.21 | 0.09 | 0.04 | 0.04 | 0.07 | ||||||
| B2 1204+24 | .. | 22.15 | 18.22 | 16.23 | 15.27 | 14.84 | 14.52 | 13.20 | 12.80 | 12.20 |
| .. | 0.32 | 0.05 | 0.08 | 0.08 | ||||||
| B2 1204+34 | 19.78 | 19.52 | 17.52 | 15.97 | 15.17 | 14.72 | 14.43 | 13.35 | 12.78 | 12.25 |
| 0.13 | 0.06 | 0.05 | 0.08 | 0.07 | ||||||
| B2 1217+29 | 16.60 | 15.47 | 13.38 | 11.52 | 10.70 | 10.30 | 9.92 | 8.09 | 7.42 | 7.18 |
| 0.01 | 0.01 | 0.01 | 0.01 | 0.01 | ||||||
| B2 1243+26 | 21.94 | 21.08 | 17.79 | 15.81 | 14.80 | 14.37 | 14.03 | 12.72 | 11.89 | 11.67 |
| 0.49 | 0.26 | 0.04 | 0.04 | 0.06 | ||||||
| B2 1254+27 | 18.87 | 17.42 | 15.38 | 13.33 | 12.50 | 12.07 | 11.80 | 10.09 | 9.33 | 9.20 |
| 0.04 | 0.02 | 0.03 | 0.03 | 0.04 | ||||||
| B2 1256+28 | 20.77 | 19.26 | 16.37 | 14.43 | 13.62 | 13.20 | 12.91 | 11.64 | 10.84 | 10.61 |
| 0.26 | 0.11 | 0.03 | 0.03 | 0.04 | ||||||
| B2 1257+28 | 19.92 | 18.10 | 14.84 | 12.93 | 12.10 | 11.66 | 11.39 | 9.85 | 9.02 | 8.86 |
| 0.22 | 0.08 | 0.02 | 0.02 | 0.03 | ||||||
| B2 1300+32 | .. | 22.39 | 20.23 | 18.15 | 16.97 | 16.44 | 16.07 | 14.54 | 14.21 | 13.45 |
| .. | 0.50 | 0.10 | 0.17 | 0.14 | ||||||
| B2 1303+31 | .. | 22.22 | 19.62 | 17.40 | 16.18 | 15.68 | 15.31 | 14.33 | 13.63 | 13.17 |
| .. | 0.76 | 0.08 | 0.09 | 0.11 | ||||||
| B2 1316+29 | 22.46 | 20.97 | 17.75 | 15.92 | 15.04 | 14.63 | 14.36 | 13.07 | 12.48 | 12.23 |
| 0.60 | 0.27 | 0.06 | 0.06 | 0.12 | ||||||
| B2 1317+33 | 20.82 | 19.69 | 16.64 | 14.63 | 13.75 | 13.34 | 13.04 | 11.70 | 10.97 | 10.76 |
| 0.29 | 0.16 | 0.03 | 0.03 | 0.05 | ||||||
| B2 1321+31 | 19.76 | 17.90 | 15.30 | 13.32 | 12.50 | 12.07 | 11.75 | 10.34 | 9.72 | 9.36 |
| 0.04 | 0.01 | 0.02 | 0.03 | 0.03 | ||||||
| B2 1322+36 | 19.74 | 18.18 | 15.40 | 13.49 | 12.66 | 12.25 | 11.96 | 10.58 | 9.90 | 9.64 |
| 0.06 | 0.02 | 0.01 | 0.02 | 0.02 | ||||||
| B2 1339+26 | 22.01 | 20.33 | 19.06 | 17.27 | 16.32 | 15.93 | 15.56 | 13.96 | 13.22 | 12.99 |
| 0.46 | 0.12 | 0.06 | 0.08 | 0.06 | ||||||
| B2 1346+26 | 18.38 | 18.08 | 16.08 | 14.50 | 13.70 | 13.26 | 13.03 | 11.69 | 10.92 | 10.60 |
| 0.11 | 0.06 | 0.06 | 0.06 | 0.08 | ||||||
| B2 1347+28 | .. | 21.30 | 18.39 | 16.19 | 15.29 | 14.86 | 14.61 | 13.25 | 12.81 | 12.33 |
| .. | 0.27 | 0.06 | 0.08 | 0.10 | ||||||
| B2 1350+31 | 20.28 | 18.62 | 17.02 | 15.12 | 14.24 | 13.77 | 13.42 | 11.89 | 11.15 | 10.84 |
| 0.26 | 0.05 | 0.03 | 0.04 | 0.04 | ||||||
| B2 1357+28 | 20.92 | 21.43 | 17.67 | 15.68 | 14.75 | 14.30 | 13.97 | 12.55 | 11.69 | 11.57 |
| 0.42 | 0.40 | 0.04 | 0.04 | 0.08 | ||||||
| B2 1422+26 | .. | 20.04 | 16.72 | 14.84 | 13.99 | 13.60 | 13.29 | 11.99 | 11.39 | 11.00 |
| .. | 0.23 | 0.04 | 0.06 | 0.06 | ||||||
| B2 1430+25 | 21.07 | 20.56 | 18.77 | 17.07 | 16.22 | 15.81 | 15.50 | 14.24 | 13.65 | 13.62 |
| 0.43 | 0.24 | 0.07 | 0.09 | 0.16 | ||||||
| B2 1447+27 | 20.05 | 19.83 | 16.73 | 14.66 | 13.78 | 13.29 | 13.01 | 11.44 | 10.67 | 10.40 |
| 0.27 | 0.12 | 0.04 | 0.06 | 0.07 | ||||||
| B2 1450+28 | 21.87 | .. | 18.97 | 17.03 | 15.95 | 15.50 | 15.09 | 13.41 | 12.79 | 12.45 |
| 0.42 | .. | 0.08 | 0.10 | 0.13 | ||||||
| B2 1455+28 | .. | .. | 19.24 | 17.41 | 16.21 | 15.68 | 15.33 | 14.38 | 13.75 | 13.18 |
| .. | .. | 0.12 | 0.16 | 0.17 | ||||||
| B2 1457+29 | .. | 21.78 | 19.47 | 17.53 | 16.45 | 16.00 | 15.64 | 14.79 | 13.85 | 13.38 |
| .. | 0.54 | 0.16 | 0.16 | 0.20 | ||||||
| B2 1502+26 | .. | 21.24 | 17.71 | 15.61 | 14.70 | 14.24 | 13.82 | 14.71 | 14.01 | 13.56 |
| .. | 0.26 | 0.07 | 0.09 | 0.07 | ||||||
| B2 1511+26 | .. | .. | 19.37 | 17.76 | 16.88 | 16.36 | 16.16 | 14.64 | 14.72 | 13.50 |
| .. | .. | 0.14 | 0.10 | 0.20 | ||||||
| B2 1512+30 | .. | 21.28 | 17.90 | 15.91 | 14.93 | 14.49 | 14.11 | 12.83 | 12.05 | 11.65 |
| .. | 0.34 | 0.06 | 0.07 | 0.08 | ||||||
| B2 1521+28 | 22.19 | 21.19 | 17.95 | 15.97 | 15.02 | 14.54 | 14.20 | 12.82 | 12.13 | 11.95 |
| 0.50 | 0.37 | 0.05 | 0.06 | 0.07 | ||||||
| B2 1553+24 | 21.52 | 20.68 | 16.91 | 14.96 | 14.06 | 13.61 | 13.28 | 11.84 | 11.24 | 11.08 |
| 0.32 | 0.17 | 0.03 | 0.04 | 0.07 | ||||||
| B2 1557+26 | 22.75 | 20.97 | 17.41 | 15.46 | 14.52 | 14.09 | 13.73 | 12.36 | 11.52 | 11.41 |
| 0.36 | 0.09 | 0.03 | 0.04 | 0.05 | ||||||
| B2 1609+31 | .. | 22.63 | 18.94 | 16.91 | 15.91 | 15.48 | 15.12 | 14.06 | 13.06 | 12.71 |
| .. | 0.49 | 0.10 | 0.10 | 0.11 | ||||||
| B2 1610+29 | 20.34 | 19.43 | 15.84 | 13.84 | 12.95 | 12.51 | 12.18 | 11.02 | 10.23 | 9.97 |
| 0.25 | 0.15 | 0.02 | 0.02 | 0.03 | ||||||
| B2 1613+27 | 21.00 | 21.61 | 18.04 | 16.03 | 15.08 | 14.65 | 14.33 | 13.22 | 12.35 | 12.25 |
| 0.32 | 0.25 | 0.05 | 0.05 | 0.09 | ||||||
| B2 1615+32 | 20.57 | 19.57 | 18.20 | 17.50 | 16.77 | 16.06 | 16.07 | 14.37 | 13.90 | 13.24 |
| 0.20 | 0.05 | 0.07 | 0.13 | 0.10 | ||||||
| B2 1615+35 | 19.99 | 18.97 | 16.01 | 14.08 | 13.23 | 12.79 | 12.48 | 11.29 | 10.57 | 10.32 |
| 0.24 | 0.11 | 0.03 | 0.03 | 0.04 | ||||||
| B2 1621+38 | 19.43 | 18.29 | 15.55 | 13.59 | 12.73 | 12.29 | 12.02 | 10.51 | 9.80 | 9.55 |
| 0.15 | 0.05 | 0.02 | 0.02 | 0.03 | ||||||
| B2 1626+39 | 18.54 | 17.44 | 15.78 | 13.85 | 13.00 | 12.54 | 12.30 | 10.20 | 9.49 | 9.17 |
| 0.04 | 0.02 | 0.02 | 0.03 | 0.03 | ||||||
| B2 1637+29 | 20.87 | 20.37 | 17.97 | 15.85 | 14.89 | 14.44 | 14.12 | 12.56 | 11.89 | 11.68 |
| 0.33 | 0.27 | 0.04 | 0.05 | 0.07 | ||||||
| B2 1638+32 | .. | .. | 18.67 | 16.92 | 15.84 | 15.37 | 15.04 | 13.69 | 13.43 | 12.85 |
| .. | .. | 0.06 | 0.13 | 0.13 | ||||||
| B2 1643+27 | .. | .. | 18.43 | 16.32 | 15.28 | 14.80 | 14.44 | 13.32 | 12.55 | 12.28 |
| .. | .. | 0.07 | 0.07 | 0.10 | ||||||
| B2 1652+39 | 15.79 | 15.38 | 15.35 | 13.84 | 13.03 | 12.62 | 12.33 | 10.67 | 9.87 | 9.57 |
| 0.01 | 0.01 | 0.02 | 0.02 | 0.03 | ||||||
| B2 1657+32 | 21.76 | 21.42 | 18.05 | 16.03 | 15.09 | 14.64 | 14.30 | 13.01 | 12.40 | 11.80 |
| 0.18 | 0.05 | 0.06 | 0.07 | 0.07 | ||||||
| B2 1658+32 | 22.60 | 21.59 | 18.58 | 16.74 | 15.73 | 15.31 | 14.95 | 13.92 | 13.26 | 12.66 |
| 0.33 | 0.10 | 0.09 | 0.11 | 0.10 | ||||||
| B2 1658+30A | 20.15 | 18.32 | 17.30 | 15.26 | 14.48 | 13.99 | 13.61 | 12.15 | 11.35 | 10.84 |
| 0.14 | 0.04 | 0.08 | 0.08 | 0.10 | ||||||
| B2 1726+31 | .. | 22.62 | 19.71 | 17.58 | 16.34 | 15.82 | 15.42 | 14.17 | 13.53 | 13.20 |
| .. | 0.53 | 0.09 | 0.12 | 0.16 | ||||||
| 3C 192 | 21.32 | 20.55 | 18.06 | 16.23 | 15.38 | 14.88 | 14.56 | 13.19 | 12.47 | 12.21 |
| 0.43 | 0.25 | 0.04 | 0.04 | 0.07 | ||||||
| 3C 219 | 20.96 | 21.45 | 19.21 | 17.89 | 16.74 | 16.26 | 15.98 | 14.61 | 13.92 | 13.12 |
| 0.26 | 0.30 | 0.14 | 0.16 | 0.15 | ||||||
| 3C 223 | 21.41 | 20.47 | 19.36 | 17.83 | 16.73 | 16.30 | 16.08 | 15.04 | 14.29 | 13.93 |
| 0.38 | 0.22 | 0.14 | 0.16 | 0.20 | ||||||
| 3C 234 | 18.54 | 19.05 | 18.53 | 17.99 | 16.85 | 16.64 | 16.85 | 14.74 | 13.66 | 12.74 |
| 0.07 | 0.06 | 0.13 | 0.10 | 0.07 | ||||||
| 3C 264 | 18.72 | 18.07 | 15.38 | 13.53 | 12.68 | 12.26 | 11.95 | 10.48 | 9.77 | 9.49 |
| 0.10 | 0.06 | 0.03 | 0.03 | 0.04 | ||||||
| 3C 272.1 | 17.00 | 15.22 | 12.59 | 10.74 | 9.89 | 9.45 | 9.08 | 7.12 | 6.47 | 6.22 |
| 0.04 | 0.02 | 0.02 | 0.02 | 0.02 | ||||||
| 3C 274 | 15.19 | 15.20 | 13.48 | 11.56 | 10.70 | 10.27 | 9.92 | 6.72 | 6.07 | 5.81 |
| 0.02 | 0.01 | 0.02 | 0.02 | 0.02 | ||||||
| 3C 285 | 19.92 | 19.50 | 18.21 | 16.67 | 15.88 | 15.45 | 15.11 | 13.78 | 13.24 | 12.65 |
| 0.17 | 0.08 | 0.07 | 0.12 | 0.09 | ||||||
| 3C 296 | 19.16 | 17.93 | 14.90 | 12.92 | 12.06 | 11.64 | 11.30 | 9.75 | 9.04 | 8.76 |
| 0.15 | 0.04 | 0.01 | 0.01 | 0.02 | ||||||
| 3C 303 | 19.49 | 19.49 | 18.45 | 17.56 | 16.66 | 16.09 | 15.88 | 14.61 | 13.75 | 13.17 |
| 0.11 | 0.08 | 0.14 | 0.16 | 0.13 | ||||||
| 3C 305 | 19.82 | 18.35 | 16.16 | 14.27 | 13.54 | 13.16 | 12.88 | 11.70 | 11.05 | 10.64 |
| 0.18 | 0.07 | 0.03 | 0.04 | 0.04 | ||||||
| 3C 321 | 19.40 | 18.86 | 17.36 | 16.05 | 15.30 | 14.84 | 14.58 | 13.54 | 12.70 | 12.34 |
| 0.11 | 0.06 | 0.06 | 0.07 | 0.09 | ||||||
| 3C 326 | .. | 21.47 | 18.89 | 16.91 | 15.90 | 15.35 | 15.03 | 14.41 | 13.73 | 13.41 |
| .. | 0.22 | 0.09 | 0.11 | 0.13 | ||||||
| 3C 346 | .. | 21.08 | 18.90 | 17.32 | 16.14 | 15.66 | 15.29 | 14.49 | 13.61 | 12.74 |
| .. | 0.33 | 0.15 | 0.17 | 0.12 |
| Galaxy | 2nd component | |||||||||||||
|---|---|---|---|---|---|---|---|---|---|---|---|---|---|---|
| Source | age | C1a𝑎aa𝑎aM | C2b𝑏bb𝑏bT | FR | Spec. | XUV | ||||||||
| yr | W | mag | (B.H.) | |||||||||||
| B2 0034+25 | 11.799 | 13.0 | .. | .. | 14.4 | 23.52 | 1.0 | 0 | .. | .. | 1.95 | 8.87e | ||
| B2 0648+27 | 11.690 | 13.0 | 9.620 | 2.9E8 | g | 6.8 | 23.94 | 3.0 | 3 | S | .. | .. | 0.25 | 7.49 |
| B2 0755+37 | 12.102 | 13.0 | .. | .. | 7.5 | 24.81 | 1.5 | 2 | H: | 4.65 | 1.79 | 8.79 | ||
| B2 0800+24 | 11.451 | 13.0 | .. | .. | 6.2 | 23.83 | 1.0 | 1 | L: | 0.29 | .. | .. | .. | |
| B2 0828+32 | 11.505 | 10.0 | .. | .. | 8.2 | 25.04 | 2.0 | 3 | L | 1.37 | 1.56 | .. | ||
| B2 0836+29 | 12.036 | 13.0 | .. | .. | 12.9 | 24.86 | 1.5 | 1 | H | 2.88 | 1.66 | .. | ||
| B2 0836+29A | 11.975 | 13.0 | 9.640 | 2.9E8 | g | 5.9 | 25.08 | 1.5 | 3 | S | 25.30 | 0.51 | .. | |
| B2 0838+32 | 11.920 | 13.0 | 9.700 | 5.7E8 | g | 11.7 | 24.81 | 1.0 | .. | .. | .. | 1.80 | .. | |
| B2 0844+31 | 12.151 | 10.0 | .. | .. | 7.6 | 25.15 | 1.5 | 1 | L: | 2.52 | 1.91 | .. | ||
| B2 0908+37 | 12.087 | 10.0 | .. | .. | 3.3 | 25.20 | 1.5 | 1 | L | 3.26 | 1.91 | 9.29 | ||
| B2 0913+38 | 11.174 | 5.0 | .. | .. | 2.3 | 24.62 | 1.0 | 1 | ? | 0.40 | 1.50 | .. | ||
| B2 0915+32 | 11.814 | 13.0 | .. | .. | 1.9 | 24.34 | 1.0 | 1 | L: | 1.00 | .. | 8.54 | ||
| B2 0924+30 | 11.330 | 5.0 | 9.750 | 5.7E8 | g | 38.3 | 23.84 | 1.0 | 1 | A | 0.12 | 1.04 | 8.49 | |
| B2 1003+26 | 12.011 | 5.0 | .. | .. | 8.0 | 24.38 | .. | 1 | H | 7.36 | 1.98 | 9.51 | ||
| B2 1005+28 | 12.000 | 10.0 | 9.820 | 5.7E8 | g | 13.0 | 24.64 | 1.5 | 0 | - | 0.48 | 1.73 | .. | |
| B2 1037+30 | 11.660 | 13.0 | 9.650 | 2.9E8 | g | 7.9 | 24.87 | .. | 3 | L: | 11.70 | 1.22 | 7.76f | |
| B2 1102+30 | 11.941 | 10.0 | .. | .. | 7.7 | 24.62 | 1.0 | 1 | A | 1.53 | 1.87 | .. | ||
| B2 1108+27 | 11.775 | 13.0 | .. | .. | 15.2 | 23.62 | 1.0 | 1 | A | 1.45 | 1.56 | .. | ||
| B2 1113+24 | 12.168 | 10.0 | .. | .. | 5.2 | 24.21 | 1.0 | 0 | - | 0.10 | .. | .. | 9.25 | |
| B2 1116+28 | 11.998 | 10.0 | .. | .. | 6.7 | 24.73 | 1.0 | .. | .. | .. | 2.12 | .. | ||
| B2 1122+39 | 11.100 | 13.0 | 9.600 | 1.0E9 | g | 162.0c | 22.11 | 1.0 | 2 | .. | .. | 1.42 | 7.99e | |
| B2 1141+37 | 11.580 | 13.0 | 8.600 | 2.9E8 | g | 18.7c | 25.84 | 2.0 | 0 | .. | 0.06 | 1.16 | .. | |
| B2 1144+35 | 11.880 | 13.0 | 9.250 | 2.9E8 | g | 22.2 | 24.85 | 1.0 | 4 | S1 | 16.74 | 1.07 | 8.16g | |
| B2 1204+24 | 11.641 | 10.0 | .. | .. | 4.9 | 24.26 | 1.0 | .. | .. | .. | 1.91 | .. | ||
| B2 1204+34 | 11.485 | 5.0 | 6.800 | 1.0E6 | g | 9.5 | 24.82 | 2.0 | 3 | S | 25.42 | 0.89 | 8.15 | |
| B2 1217+29 | 10.400 | 13.0 | 8.400 | 5.7E8 | g | 134.0c | 21.54 | 3.0 | 2 | L | .. | 1.83 | 8.44e | |
| B2 1243+26 | 11.971 | 10.0 | .. | .. | 4.1 | 24.58 | 1.0 | 2 | L | .. | 0.43 | .. | ||
| B2 1254+27 | 11.800 | 13.0 | 9.700 | 5.7E8 | g | 78.0c | 22.95 | 1.0 | 0 | - | 0.02 | 1.38 | .. | |
| B2 1256+28 | 11.100 | 10.0 | 9.300 | 1.0E9 | g | 11.9 | 23.36 | 1.0 | .. | .. | .. | 1.91 | 8.17e | |
| B2 1257+28 | 11.982 | 13.0 | .. | .. | 24.5 | 23.39 | 1.0 | 0 | - | 0.01 | 1.66 | 8.72e | ||
| B2 1300+32 | 11.755 | 10.0 | .. | .. | 3.4 | 25.35 | 1.0 | .. | .. | .. | .. | .. | ||
| B2 1303+31 | 11.878 | 5.0 | .. | .. | 10.3 | 24.80 | 1.0 | .. | .. | .. | 1.34 | .. | ||
| B2 1316+29 | 11.436 | 5.0 | .. | .. | 3.4 | 25.17 | 1.0 | 1 | L | 1.28 | 1.25 | .. | ||
| B2 1317+33 | 11.700 | 13.0 | .. | .. | 3.6 | 23.40 | 1.0 | 1 | L: | 1.20 | .. | .. | ||
| B2 1321+31 | 11.250 | 10.0 | 9.750 | 1.0E9 | g | 43.9 | 24.15 | 1.0 | 1 | L: | 0.22 | 1.86 | 8.08e | |
| B2 1322+36 | 11.250 | 10.0 | 9.750 | 1.0E9 | g | 21.0 | 24.86 | 1.0 | 1 | L: | 0.56 | 1.73 | 8.59 | |
| B2 1339+26 | 11.250 | 13.0 | 9.000 | 2.9E8 | g | 13.0c | 24.65 | 1.0 | 0 | - | 0.08 | 1.91 | 9.26 | |
| B2 1346+26 | 12.150 | 13.0 | 9.900 | 2.9E8 | g | 4.9 | 24.89 | 1.0 | 2 | L | .. | 1.87 | 8.86e | |
| B2 1347+28 | 11.561 | 10.0 | .. | .. | 8.5 | 24.40 | 1.5 | 1 | L: | 0.58 | 1.76 | 8.37 | ||
| B2 1350+31 | 11.700 | 13.0 | 9.100 | 2.9E8 | g | 31.8 | 25.36 | 1.5 | 2 | L | 6.63 | 0.96 | 8.15e | |
| B2 1357+28 | 11.789 | 13.0 | .. | .. | 5.3 | 24.37 | 1.0 | .. | .. | .. | 1.92 | 8.89 | ||
| B2 1422+26 | 11.475 | 10.0 | .. | .. | 2.4 | 24.32 | 1.0 | 3 | S | 1.72 | 1.45 | 8.63 | ||
| B2 1430+25 | 11.100 | 5.0 | 6.700 | 6.0E6 | g | 2.6 | 24.55 | 1.0 | 1 | L | 0.36 | -0.07 | 8.17 | |
| B2 1447+27 | 11.552 | 13.0 | .. | .. | 12.2 | 23.10 | 3.0 | .. | .. | .. | 2.06 | 8.95 | ||
| B2 1450+28 | 11.909 | 10.0 | .. | .. | 4.5 | 24.88 | 1.0 | .. | .. | .. | .. | 2.35 | 9.38 | |
| B2 1455+28 | 11.852 | 10.0 | .. | .. | 5.2 | 25.61 | 2.0 | 3 | S | 35.48 | .. | 0.25 | .. | |
| B2 1457+29 | 11.579 | 5.0 | 6.700 | 6.0E6 | g | 3.1 | 25.28 | 1.0 | .. | .. | .. | 1.25 | .. | |
| B2 1502+26 | 11.690 | 13.0 | .. | .. | 327.0d | 25.69 | 1.0 | 3 | S | 3.98 | 1.51 | 9.36 | ||
| B2 1511+26 | 11.072 | 5.0 | .. | .. | 37.8c | 25.71 | 1.0 | 3 | .. | .. | .. | 0.93 | .. | |
| B2 1512+30 | 11.988 | 10.0 | .. | .. | 2.8 | 24.18 | .. | 0 | - | 0.11 | 1.89 | 9.01 | ||
| B2 1521+28 | 11.838 | 10.0 | .. | .. | 3.5 | 24.93 | 1.0 | 1 | L: | 2.24 | 1.89 | 8.98 | ||
| B2 1553+24 | 11.625 | 10.0 | .. | .. | 2.4 | 23.90 | 1.0 | 1 | L: | 0.77 | 2.03 | 8.66 | ||
| B2 1557+26 | 11.480 | 10.0 | .. | .. | 7.0 | 23.14 | 1.0 | 1 | A | 0.61 | 1.79 | 8.91 | ||
| B2 1609+31 | 11.606 | 10.0 | .. | .. | 4.5 | 24.50 | 1.5 | 0 | - | 0.06 | 1.88 | .. | ||
| B2 1610+29 | 11.745 | 10.0 | .. | .. | 6.2 | 23.35 | 1.0 | .. | .. | .. | 2.04 | 9.04e | ||
| B2 1613+27 | 11.320 | 5.0 | 5.900 | 1.3E5 | g | 14.7 | 24.37 | 1.0 | 1 | L: | 0.58 | 1.77 | 8.51 | |
| B2 1615+32 | 11.330 | 5.0 | 6.850 | 0.40 | p | 15.3 | 26.18 | 2.0 | 4 | S1 | 27.14 | 0.84 | .. | |
| 11.800 | 13.0 | 9.400 | 1.0E8 | g | 66.2 | |||||||||
| B2 1615+35 | 11.586 | 10.0 | .. | .. | 11.7 | 24.62 | 1.0 | 1 | C | 1.03 | 1.79 | .. | ||
| B2 1621+38 | 11.900 | 13.0 | 9.600 | 5.7E8 | g | 39.5 | 23.97 | 1.0 | .. | .. | .. | 2.00 | 8.85e | |
| B2 1626+39 | 11.750 | 13.0 | 9.350 | 2.9E8 | g | 268.0c | 24.81 | 1.0 | 2 | L: | .. | 1.93 | 8.89e | |
| B2 1637+29 | 12.050 | 13.0 | 8.920 | 2.9E8 | g | 5.7 | 24.75 | 1.0 | 0 | .. | .. | 1.81 | .. | |
| B2 1638+32 | 11.750 | 5.0 | .. | .. | 2.3 | 25.19 | 1.0 | 1 | L: | 2.55 | .. | 1.70 | .. | |
| B2 1643+27 | 12.001 | 13.0 | .. | .. | 8.4 | 24.41 | 1.5 | 1 | L: | 0.94 | .. | 2.03 | .. | |
| B2 1652+39 | 11.850 | 13.0 | 7.050 | 2.0 | p | 90.8c | 24.55 | 3.0 | .. | .. | .. | 1.26 | .. | |
| 11.850 | 13.0 | 7.900 | 6.0E6 | g | 97.9 | |||||||||
| B2 1657+32 | 11.661 | 13.0 | .. | .. | 3.5 | 23.99 | 1.0 | 2 | L | 2.40 | 1.73 | .. | ||
| B2 1658+32 | 11.700 | 10.0 | 8.500 | 2.9E8 | g | 14.5 | 24.24 | 1.0 | 1 | L: | 0.96 | 1.50 | .. | |
| B2 1658+30A | 11.330 | 13.0 | 9.000 | 2.9E8 | g | 52.7c | 24.20 | 1.5 | 2 | L | .. | 1.86 | 8.94 | |
| B2 1726+31 | 11.786 | 5.0 | .. | .. | 3.9 | 26.29 | 2.0 | .. | .. | .. | 1.16 | 8.82 | ||
| 3C 192 | 11.410 | 10.0 | 5.550 | 0.50 | p | 3.1 | 25.59 | 2.0 | 3 | S | 15.32 | 1.32 | 8.07e | |
| 11.500 | 13.0 | 9.000 | 2.9E8 | g | 2.0 | |||||||||
| 3C 219 | 11.975 | 13.0 | 6.400 | 0.60 | p | 6.2 | 26.86 | 2.0 | 3 | S | 54.94 | 0.93 | .. | |
| 12.000 | 13.0 | 8.700 | 5.7E7 | g | 9.9 | |||||||||
| 3C 223 | 11.270 | 5.0 | 6.240 | 0.50 | p | 7.8 | 26.25 | 2.0 | 3 | S | 60.34 | 0.02 | 8.15e | |
| 11.250 | 5.0 | 9.500 | 2.9E8 | g | 7.4 | |||||||||
| 3C 234 | 11.900 | 13.0 | 7.200 | 2.00 | p | 80.0c | 26.81 | 2.0 | 3 | S | 235.86 | 0.20 | .. | |
| 11.900 | 13.0 | 8.100 | 1.3E5 | g | 1060 | |||||||||
| 3C 264 | 11.620 | 13.0 | 8.650 | 2.9E8 | g | 7.4 | 24.73 | 1.0 | 1 | H: | 1.21 | 1.68 | 8.67e | |
| 3C 272.1 | 10.900 | 13.0 | 9.500 | 1.0E9 | g | 294.0c | 23.54 | 1.0 | .. | .. | .. | 1.94 | 8.75e | |
| 3C 274 | 11.000 | 13.0 | 6.200 | 1.3E5 | g | 1380.0c | 25.08 | 1.0 | 2 | L | .. | 1.84 | 9.04e | |
| 3C 285 | 11.550 | 13.0 | 8.520 | 5.7E7 | g | 4.7 | 25.53 | 2.0 | 3 | S: | 6.59 | 0.47 | 7.97e | |
| 3C 296 | 11.900 | 13.0 | 10.000 | 1.0E9 | g | 47.6c | 24.73 | 1.0 | 1 | L: | 0.91 | 1.90 | 8.75e | |
| 3C 303 | 11.400 | 5.0 | 6.800 | 1.30 | p | 3.9 | 26.14 | 2.0 | 4 | S1 | 50.24 | 0.76 | .. | |
| 11.700 | 13.0 | 9.200 | 5.7E7 | g | 11.9 | |||||||||
| 3C 305 | 11.400 | 5.0 | 10.000 | 5.7E8 | g | 17.1 | 25.05 | 1.5 | 3 | S | 17.88 | 0.93 | 8.08e | |
| 3C 321 | 11.500 | 5.0 | 10.100 | 2.9E8 | g | 10.3 | 25.88 | 2.0 | 2 | .. | .. | 0.07 | .. | |
| 3C 326 | 11.320 | 5.0 | 6.400 | 1.3E5 | g | 23.7 | 26.37 | 2.0 | 2 | C | 18.60 | .. | .. | |
| 3C 346 | 11.800 | 5.0 | 6.300 | 0.30 | p | 4.5 | 26.37 | 3.0 | 3 | S | .. | 0.97 | .. | |
| 11.800 | 5.0 | 8.700 | 5.7E7 | g | 7.6 | |||||||||