DESY 15-120 ISSN 0418-9833
August 2015
Exclusive Meson Photoproduction with a Leading Neutron at HERA
H1 Collaboration
A first measurement is presented of exclusive photoproduction of mesons associated with leading neutrons at HERA. The data were taken with the H1 detector in the years and at a centre-of-mass energy of GeV and correspond to an integrated luminosity of pb-1. The mesons with transverse momenta GeV are reconstructed from their decays to charged pions, while leading neutrons carrying a large fraction of the incoming proton momentum, , are detected in the Forward Neutron Calorimeter. The phase space of the measurement is defined by the photon virtuality GeV2, the total energy of the photon-proton system GeV and the polar angle of the leading neutron mrad. The cross section of the reaction is measured as a function of several variables. The data are interpreted in terms of a double peripheral process, involving pion exchange at the proton vertex followed by elastic photoproduction of a meson on the virtual pion. In the framework of one-pion-exchange dominance the elastic cross section of photon-pion scattering, , is extracted. The value of this cross section indicates significant absorptive corrections for the exclusive reaction .
Accepted by Eur. Phys. J. C
V. Andreev21, A. Baghdasaryan33, K. Begzsuren30, A. Belousov21, A. Bolz12, V. Boudry24, G. Brandt44, V. Brisson23, D. Britzger10, A. Buniatyan2, A. Bylinkin20,41, L. Bystritskaya20, A.J. Campbell10, K.B. Cantun Avila19, K. Cerny27, V. Chekelian22, J.G. Contreras19, J. Cvach26, J.B. Dainton16, K. Daum32,37, C. Diaconu18, M. Dobre4, V. Dodonov10, G. Eckerlin10, S. Egli31, E. Elsen10, L. Favart3, A. Fedotov20, J. Feltesse9, J. Ferencei14, M. Fleischer10, A. Fomenko21, E. Gabathuler16, J. Gayler10, S. Ghazaryan10, L. Goerlich6, N. Gogitidze21, M. Gouzevitch38, C. Grab35, A. Grebenyuk3, T. Greenshaw16, G. Grindhammer22, D. Haidt10, R.C.W. Henderson15, J. Hladkỳ26, D. Hoffmann18, R. Horisberger31, T. Hreus3, F. Huber12, M. Jacquet23, X. Janssen3, H. Jung10,3, M. Kapichine8, C. Kiesling22, M. Klein16, C. Kleinwort10, R. Kogler11, P. Kostka16, J. Kretzschmar16, K. Krüger10, M.P.J. Landon17, W. Lange34, P. Laycock16, A. Lebedev21, S. Levonian10, K. Lipka10, B. List10, J. List10, B. Lobodzinski22, E. Malinovski21, H.-U. Martyn1, S.J. Maxfield16, A. Mehta16, A.B. Meyer10, H. Meyer32, J. Meyer10, S. Mikocki6, A. Morozov8, K. Müller36, Th. Naumann34, P.R. Newman2, C. Niebuhr10, G. Nowak6, J.E. Olsson10, D. Ozerov10, C. Pascaud23, G.D. Patel16, E. Perez39, A. Petrukhin38, I. Picuric25, H. Pirumov10, D. Pitzl10, R. Plačakytė10, B. Pokorny27, R. Polifka27,42, B. Povh13, V. Radescu12, N. Raicevic25, T. Ravdandorj30, P. Reimer26, E. Rizvi17, P. Robmann36, R. Roosen3, A. Rostovtsev45, M. Rotaru4, S. Rusakov21,†, D. Šálek27, D.P.C. Sankey5, M. Sauter12, E. Sauvan18,43, S. Schmitt10, L. Schoeffel9, A. Schöning12, F. Sefkow10, S. Shushkevich10, Y. Soloviev10,21, P. Sopicki6, D. South10, V. Spaskov8, A. Specka24, M. Steder10, B. Stella28, U. Straumann36, T. Sykora3,27, P.D. Thompson2, D. Traynor17, P. Truöl36, I. Tsakov29, B. Tseepeldorj30,40, J. Turnau6, A. Valkárová27, C. Vallée18, P. Van Mechelen3, Y. Vazdik21, D. Wegener7, E. Wünsch10, J. Žáček27, Z. Zhang23, R. Žlebčík27, H. Zohrabyan33, and F. Zomer23
1 I. Physikalisches Institut der RWTH, Aachen, Germany
2 School of Physics and Astronomy, University of Birmingham,
Birmingham, UKb
3 Inter-University Institute for High Energies ULB-VUB, Brussels and
Universiteit Antwerpen, Antwerpen, Belgiumc
4 Horia Hulubei National Institute for R&D in Physics and
Nuclear Engineering (IFIN-HH) , Bucharest, Romaniaj
5 STFC, Rutherford Appleton Laboratory, Didcot, Oxfordshire, UKb
6 Institute of Nuclear Physics Polish Academy of Sciences,
PL-31342 Krakow, Polandd
7 Institut für Physik, TU Dortmund, Dortmund, Germanya
8 Joint Institute for Nuclear Research, Dubna, Russia
9 Irfu/SPP, CE Saclay, GIF-SUR-YVETTE, CEDEX, France
10 DESY, Hamburg, Germany
11 Institut für Experimentalphysik, Universität Hamburg,
Hamburg, Germanya
12 Physikalisches Institut, Universität Heidelberg,
Heidelberg, Germanya
13 Max-Planck-Institut für Kernphysik, Heidelberg, Germany
14 Institute of Experimental Physics, Slovak Academy of
Sciences, Košice, Slovak Republice
15 Department of Physics, University of Lancaster,
Lancaster, UKb
16 Department of Physics, University of Liverpool,
Liverpool, UKb
17 School of Physics and Astronomy, Queen Mary, University of London,
London, UKb
18 Aix Marseille Université, CNRS/IN2P3, CPPM UMR 7346,
13288 Marseille, France
19 Departamento de Fisica Aplicada,
CINVESTAV, Mérida, Yucatán, Méxicoh
20 Institute for Theoretical and Experimental Physics,
Moscow, Russiai
21 Lebedev Physical Institute, Moscow, Russia
22 Max-Planck-Institut für Physik, München, Germany
23 LAL, Université Paris-Sud, CNRS/IN2P3, Orsay, France
24 LLR, Ecole Polytechnique, CNRS/IN2P3, Palaiseau, France
25 Faculty of Science, University of Montenegro,
Podgorica, Montenegrok
26 Institute of Physics, Academy of Sciences of the Czech Republic,
Praha, Czech Republicf
27 Faculty of Mathematics and Physics, Charles University,
Praha, Czech Republicf
28 Dipartimento di Fisica Università di Roma Tre
and INFN Roma 3, Roma, Italy
29 Institute for Nuclear Research and Nuclear Energy,
Sofia, Bulgaria
30 Institute of Physics and Technology of the Mongolian
Academy of Sciences, Ulaanbaatar, Mongolia
31 Paul Scherrer Institut,
Villigen, Switzerland
32 Fachbereich C, Universität Wuppertal,
Wuppertal, Germany
33 Yerevan Physics Institute, Yerevan, Armenia
34 DESY, Zeuthen, Germany
35 Institut für Teilchenphysik, ETH, Zürich, Switzerlandg
36 Physik-Institut der Universität Zürich, Zürich, Switzerlandg
37 Also at Rechenzentrum, Universität Wuppertal,
Wuppertal, Germany
38 Now at IPNL, Université Claude Bernard Lyon 1, CNRS/IN2P3,
Villeurbanne, France
39 Now at CERN, Geneva, Switzerland
40 Also at Ulaanbaatar University, Ulaanbaatar, Mongolia
41 Also at Moscow Institute of Physics and Technology, Moscow, Russia
42 Also at Department of Physics, University of Toronto,
Toronto, Ontario, Canada M5S 1A7
43 Also at LAPP, Université de Savoie, CNRS/IN2P3,
Annecy-le-Vieux, France
44 Now at II. Physikalisches Institut, Universität Göttingen,
Göttingen, Germany
45 Now at Institute for Information Transmission Problems RAS,
Moscow, Russial
† Deceased
a Supported by the Bundesministerium für Bildung und Forschung, FRG,
under contract numbers 05H09GUF, 05H09VHC, 05H09VHF, 05H16PEA
b Supported by the UK Science and Technology Facilities Council,
and formerly by the UK Particle Physics and
Astronomy Research Council
c Supported by FNRS-FWO-Vlaanderen, IISN-IIKW and IWT
and by Interuniversity Attraction Poles Programme,
Belgian Science Policy
d Partially Supported by Polish Ministry of Science and Higher
Education, grant DPN/N168/DESY/2009
e Supported by VEGA SR grant no. 2/7062/ 27
f Supported by the Ministry of Education of the Czech Republic
under the project INGO-LG14033
g Supported by the Swiss National Science Foundation
h Supported by CONACYT,
México, grant 48778-F
i Russian Foundation for Basic Research (RFBR), grant no 1329.2008.2
and Rosatom
j Supported by the Romanian National Authority for Scientific Research
under the contract PN 09370101
k Partially Supported by Ministry of Science of Montenegro,
no. 05-1/3-3352
l Russian Foundation for Sciences,
project no 14-50-00150
1 Introduction
Measurements of leading baryon production in high energy particle collisions, i.e. the production of protons and neutrons at very small polar angles with respect to the initial hadron beam direction (forward direction), are important inputs for the theoretical understanding of strong interactions in the soft, non-perturbative regime. In collisions at HERA, a hard scale may be present in such reactions if the photon virtuality, , is large, or if objects with high transverse momenta, , are produced in addition to the leading baryon. In such cases the process usually can be factorised into short-distance and long-distance phenomena and perturbative QCD often is applicable for the description of the hard part of the process.
Previous HERA measurements [1, 2, 3, 4, 5, 6, 7] have demonstrated that in the semi-inclusive reaction the production of neutrons carrying a large fraction of the proton beam energy is dominated by the pion exchange process. In this picture a virtual photon, emitted from the beam electron, interacts with a pion from the proton cloud, thus giving access to the cross section and, in the deep-inelastic scattering regime, to the pion structure function.
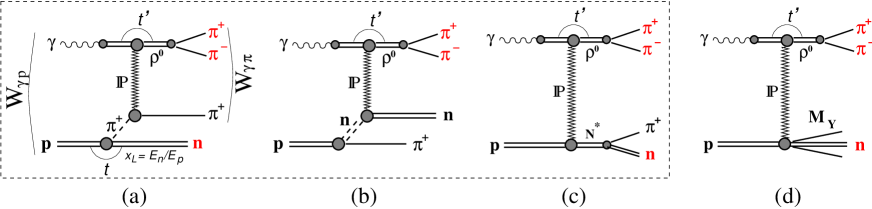
The aim of the present analysis is to measure exclusive production on virtual pions in the photoproduction regime at HERA and to extract the quasi-elastic cross section for the first time. Since no hard scale is present, a phenomenological approach, such as Regge theory [8], is most appropriate to describe the reaction. In the Regge framework such events are explained by the diagram shown in figure 1a which involves an exchange of two Regge trajectories in the process , known as a Double Peripheral Process (DPP), or Double-Regge-pole exchange reaction [9]. This process can also be seen as a proton dissociating into system which scatters elastically on the via the exchange of the Regge trajectory with the vacuum quantum numbers, called the “Pomeron”.
In the past, similar reactions were studied at lower energies in nucleon-nucleon and meson-nucleon collisions [10, 11, 12, 13, 14]. Most of the experimental properties of these reactions were successfully explained by the generalised Drell-Hiida-Deck model (DHD) [15, 16, 17], in which in addition to the pion exchange (figure 1a) two further contributions (figure 1b, 1c) are included. The graphs depicted in figures 1b and 1c give contributions to the total scattering amplitude with similar magnitude but opposite sign [18, 19]. Therefore they largely cancel in most of the phase space, in particular at small momentum transfer squared at the proton vertex, , such that the pion exchange diagram dominates the cross section [17]. One of the specific features observed in these experiments is a characteristic dependence at the ‘elastic’ vertex111In the present analysis elastic vertex corresponds to the vertex, figure 1., with the slope dependent on the mass of the system produced at the other, , vertex, and changing in a wide range of approximately GeV-2. The Deck model in its original formulation cannot fully describe such a strong mass-slope correlation and interference between the amplitudes corresponding to the first three graphs in figure 1 has to be taken into account to explain the experimental data [20, 21].
In the analysis presented here only the two charged pions from the decay and the leading neutron are observed directly. The pion from the proton vertex is emitted under very small angles with respect to the proton beam and escapes detection. This leads to a background contamination from events with a different final state, which originate from diffractive dissociation of the proton into a system containing a neutron (figure 1d). Using the H1 detector capabilities in the forward region such processes can be suppressed to a certain extent. The residual background contribution is estimated from a Monte Carlo model tuned to describe vector meson production in diffractive dissociation at HERA.
The analysis is based on a data sample corresponding to an integrated luminosity of pb-1 collected with the H1 detector in the years and . During this period HERA collided positrons and protons with energies of and , respectively, corresponding to a centre-of-mass energy of . The photon virtuality is limited to with an average value of .
2 Cross Sections Definitions
The kinematics of the process
| (1) |
where the symbols in parentheses denote the four-momenta of the corresponding particles, is described by the following invariants:
-
•
the square of the centre-of-mass energy ,
-
•
the modulus of the four-momentum transfer squared at the lepton vertex
, -
•
the inelasticity ,
-
•
the square of the centre-of-mass energy ,
-
•
the fraction of the incoming proton beam energy carried by the leading neutron
, -
•
the four-momentum transfer squared at the proton vertex
, and -
•
the four-momentum transfer squared at the photon vertex .
Here represent the energy and the mass of the incoming proton and the outgoing leading neutron, respectively. The square of the centre-of-mass energy is then given by .
Experimentally, the kinematic variables at the photon vertex (the mass , the pseudorapidity and the transverse momentum squared of the meson) are determined from the decay pions, while those at the proton vertex ( and ) are deduced from the measured energy and scattering angle of the leading neutron.
In the limit of photoproduction, i.e. , the beam positron is scattered at small angles and escapes detection. In this regime the square of the centre-of-mass energy can be reconstructed via the variable , where is the reconstructed inelasticity, measured as . Here, and denote the reconstructed energy and the momentum along the proton beam direction (-axis) of the meson and is the positron beam energy. The variable can be estimated from the transverse momentum of the meson in the laboratory frame via the observable to a very good approximation222A correction accounting for the small, but non-zero values is applied, based on the Monte Carlo generator information, as explained in section 3.3..
The cross section of the exclusive reaction (1) can be expressed as a product of a virtual photon flux and a photon-proton cross section :
| (2) |
In the Vector Dominance model (VDM) [22, 23] taking into account both transversely and longitudinally polarised virtual photons the effective photon flux is given by
| (3) |
where is the fine structure constant and , with being the mass of the electron and is the meson mass.
In the one-pion-exchange (OPE) approximation [24], which is valid for very small , the photon-proton cross section can be further decomposed into a pion flux, describing splitting, convoluted with a photon-pion cross section:
| (4) |
A generic expression for the pion flux factor can be written as follows:
| (5) |
where is the Pomeron intercept, is the pion trajectory, is the coupling constant known from phenomenological analysis [25] of low energy data, and is a form factor accounting for off mass-shell corrections and normalised to unity at the pion pole, . There exists a variety of models for the exact form of the pion flux [26, 27, 28, 29, 30, 31, 32] which typically leads to a spread in the predicted cross section according to equation (4). Most of models use a non-Reggeized version of equation (5), i.e. and .
3 Experimental Procedure and Data Analysis
3.1 H1 detector
A detailed description of the H1 detector can be found elsewhere [33]. Only those components relevant for the present analysis are described here. The origin of the right-handed H1 coordinate system is the nominal interaction point. The direction of the proton beam defines the positive –axis; the polar angle is measured with respect to this axis. Transverse momenta are measured in the – plane. The pseudorapidity is defined by and is measured in the laboratory frame.
The central region of the detector is equipped with a tracking system. It included a set of two large coaxial cylindrical drift chambers (CJC), interleaved by a chamber, and the central silicon tracker (CST) [34] operated in a solenoidal magnetic field of . This provides a measurement of the transverse momentum of charged particles with resolution ( measured in GeV), for particles emitted from the nominal interaction point with polar angle . The interaction vertex is reconstructed from the tracks. The five central inner proportional chambers (CIP) [35] are located between the inner CJC and the CST. The CIP has an angular acceptance in the range . The forward tracking detector is used to supplement track reconstruction in the region and improves the hadronic final state reconstruction of forward going low momentum particles.
The tracking system is surrounded by a finely segmented liquid argon (LAr) calorimeter, which covers the polar angle range with full azimuthal acceptance. The LAr calorimeter is used to measure the scattered electron and to reconstruct the energy of the hadronic final state. The backward region () is covered by a lead/scintillating-fibre calorimeter (SpaCal) [36]; its main purpose is the detection of scattered positrons.
A set of “forward detectors” is sensitive to the energy flow close to the outgoing proton beam direction. It consists of the forward muon detector (FMD), the Plug calorimeter and the forward tagging system (FTS). The lead–scintillator Plug calorimeter enables energy measurements to be made in the pseudorapidity range . It is positioned around the beam-pipe at m. The FMD is a system of six drift chambers which are grouped into two three-layer sections separated by a toroidal magnet. Although the nominal coverage of the FMD is , particles with pseudorapidity up to can be detected indirectly through their interactions with the beam transport system and detector support structures. The very forward region, , is covered by an FTS station which is used in this analysis. It consists of scintillator detectors surrounding the beam pipe at m. The forward detectors together with the LAr calorimeter are used here to suppress inelastic and proton dissociative background by requiring a large rapidity gap (LRG) void of activity between the leading neutron and the pions from the decay.
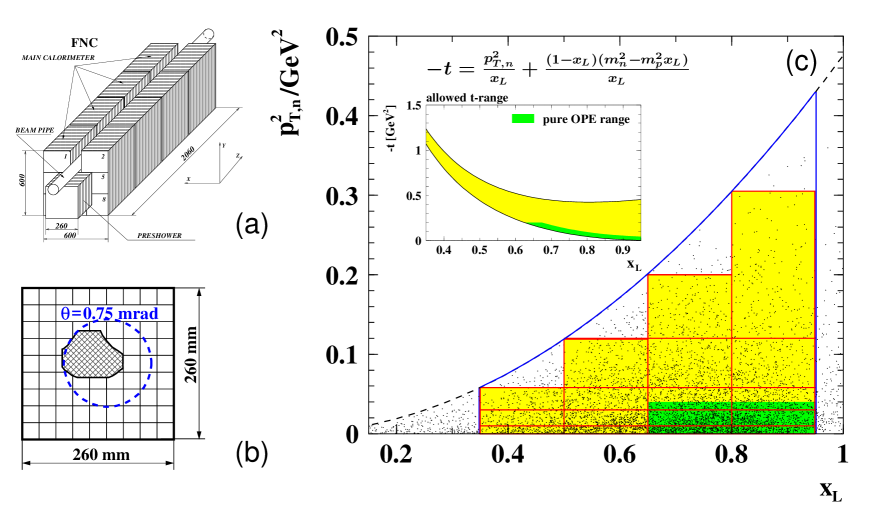
Neutral particles produced at very small polar angles can be detected in the forward neutron calorimeter (FNC) [7, 37], which is situated at m from the interaction point. It covers the pseudorapidity range . The FNC is a lead–scintillator sandwich calorimeter. It consists of two longitudinal sections: the Preshower Calorimeter with a length corresponding to about radiation lengths, or hadronic interaction lengths , and the Main Calorimeter with a total length of (see figure 2a). The acceptance of the FNC is defined by the aperture of the HERA beam-line magnets and is limited to scattering angles of mrad with approximately azimuthal coverage, as illustrated in figure 2b.
The absolute electromagnetic and hadronic energy scales of the FNC are known to and precision, respectively [7]. The energy resolution of the FNC calorimeter for electromagnetic showers is and for hadronic showers , as determined in test beam measurements. The spatial resolution is for hadronic showers starting in the Main Calorimeter. A better spatial resolution of about is achieved for electromagnetic showers and for those hadronic showers which start in the Preshower Calorimeter.
The instantaneous luminosity is monitored based on the rate of the Bethe-Heitler process . The final state photon is detected in the photon detector located close to the beampipe at m. The precision of the integrated luminosity measurement is improved in a dedicated analysis of the elastic QED Compton process [38] in which both the scattered electron and the photon are detected in the SpaCal.
3.2 Event selection
The data sample of this analysis has been collected using a special low multiplicity trigger requiring two tracks with MeV and originating from the nominal event vertex, and at most one extra track with MeV. The tracks are found by the Fast Track Trigger (FTT) [39], based on hit information provided by the CJCs. The trigger also contains a veto condition against non- background provided by the CIP. The average trigger efficiency is about for the analysis phase space. The trigger simulation has been verified and tuned to the data using an independently triggered data sample.
For the analysis, exclusive events are selected, containing two oppositely charged pion candidates in the central tracker, a leading neutron in the FNC and nothing else above noise level in the detector333According to simulation, the forward going from the proton vertex is emitted in the range where it cannot be reliably measured or identified with the available apparatus.. The photoproduction regime is ensured by the absence of a high energy electromagnetic cluster consistent with a signal from a scattered beam positron in the calorimeters. This limits the photon virtuality to , resulting in a mean value of .
The candidate selection requires the reconstruction of the trajectories of two, and only two, oppositely charged particles in the central tracking detector. They must originate from a common vertex lying within cm in of the nominal interaction point, and must have transverse momenta above GeV and polar angles within the interval . The momentum of the meson is calculated as the vector sum of the two charged particle momenta. The two-pion invariant mass is required to be within the interval GeV. Since no explicit hadron identification is used, events are discarded with GeV where is the invariant mass of two particles under the kaon mass hypothesis. This cut suppresses a possible background from exclusive production of mesons.
Events containing a leading neutron are selected by requiring a hadronic cluster in the FNC with an energy above and a polar angle below . The cut on polar angle, defined by the geometrical acceptance of the FNC, restricts the neutron transverse momenta to the range .
To ensure exclusivity, additional cuts are applied on the calorimetric energy and on the response of the forward detectors. There should be no cluster with energy above MeV, unless associated with decay products, in the SpaCal and LAr calorimeters. A Large Rapidity Gap signature is required, by selecting events with no activity above noise levels in the forward detectors. This suppresses non-diffractive interactions to a negligible level and also significantly reduces diffractive background.
| Event selection | Analysis PS | Measurement PS | |
|---|---|---|---|
| Trigger s14 (low multiplicity) | |||
| No in the detector | GeV2 | GeV2 | |
| tracks, net charge , | |||
| GeV, , | GeV | GeV | |
| from cm | GeV | GeV2 | |
| GeV | GeV | ||
| LRG requirement | events | ||
| GeV | |||
| mrad | mrad | GeV | |
| events | events | events | |
| (OPE dominated range) | OPE1 | GeV | ( events) |
| OPE2 | GeV, ( events) | ||
After these cuts the data sample contains about events. The event selection criteria together with the analysis and the measurement phase space definitions are summarised in table 1. In order to better control migration effects and backgrounds most of the selection cuts are kept softer than the final measurement phase space limits. In the end, the cross sections measured in the mrad range are based on events. For the cross section extraction additional cuts are applied in order to stay within a range where the validity of OPE can be safely expected. Two sub-samples are defined: OPE1 with MeV, containing events and OPE2 with MeV and , containing events444The OPE2 sample corresponds to the low GeV2 region, see figure 2c..
3.3 Monte Carlo simulations and corrections to the data
Monte Carlo (MC) simulations are used to calculate acceptances and efficiencies for triggering, track reconstruction, event selection and background contributions and to account for migrations between measurement bins due to the finite detector resolution.
Signal events from the DPP reaction (figure 1a) are modelled by the two-step MC generator POMPYT [40], in which the virtual pion is produced at the proton vertex according to one of the available pion flux parametrisations. This pion then scatters elastically on the photon from the electron beam, thus producing a vector meson ( in our case). In this analysis the non-Reggeized pion flux factor is taken from the light-cone representation [41] with the form factor in equation (5)
| (6) |
where is the radius of the pion-proton Fock state [27]. The same version of the pion flux factor has been used in previous H1 publications on leading neutron measurements [4, 7] providing a good description of inclusive neutron spectra. For the numerical value of the coupling constant, the most recent estimate [25] is used.
Since the exact shape of the dependence is not a priori known, two extreme versions are generated. In the first version a simple exponential shape is assumed, as expected for elastic photoproduction on the pion, with the slope GeV-2. For the second version a mass-dependent slope is taken, GeV-2, typical for DPP processes as observed at lower energies [10, 11, 17]. The difference in the correction factors obtained using these two versions of MC simulations is part of the model dependent systematic uncertainty.
The background events originating from diffractive production (figure 1d) are generated using the program DIFFVM [42], which is based on Regge theory and the Vector Dominance Model. All channels (elastic, single- and double-dissociation processes) are included, with the relative composition as measured in [43]. For the proton dissociative case the mass spectrum is parametrised as , for with quark and diquark fragmentation using the JETSET program [44]. For the low mass dissociation the production of excited nucleon states at the proton vertex is taken into account explicitly. Signal events, corresponding to the diagram shown in figure 1c, are excluded from the generated background sample.
The DIFFVM program is also used to estimate possible contaminations from diffractive and production.
As discussed in section 1, the pion exchange diagram dominates the cross section in the low region where the contributions from the diagrams in figures 1b and 1c almost cancel. To check a possible influence of these terms on the MC correction factors, neutron exchange events (b) were generated using POMPYT and events of class (c) using DIFFVM. As expected, these events have kinematic distributions and selection efficiencies similar to those from the pion exchange process and do not alter the MC correction factors beyond the quoted systematic uncertainties.
In both the POMPYT and the DIFFVM generators a simple non-relativistic Breit-Wigner shape is used for the meson mass. Therefore all MC events are reweighted to the relativistic Breit-Wigner shape with additional -dependent distortion as observed in photoproduction experiments. The distortion is caused by the interference between the resonant and non-resonant production and is characterised by the phenomenological skewing parameter, , as suggested by Ross and Stodolsky [45]:
| (7) |
with being the nominal resonance mass [46] and taken from published ZEUS data on elastic photoproduction of mesons [47]. Additionally, the signal MC events (POMPYT) are reweighted in and in to the observed shapes of the corresponding distributions. This reweighting is performed iteratively and has converged after two iterations. The uncertainty in the reweighting procedure is then taken into account in the systematic error analysis.
Small, but non-zero values of cause to differ from by less than . To account for this effect a multiplicative correction factor determined with the Monte Carlo generators is applied to the bins of the distribution; the correction is obtained by taking the ratio between the and distributions at the generator level. This correction varies from 1.1 at to 0.77 at GeV2.
For all MC samples detector effects are simulated in detail with the GEANT program [48]. The MC description of the detector response, including trigger efficiencies, is adjusted using comparisons with independent data. Beam-induced backgrounds are taken into account by overlaying the simulated events with randomly triggered real events. The simulated MC events are passed through the same reconstruction and analysis chain as is used for the data.
The MC simulations are used to correct the distributions at the level of reconstructed particles back to the hadron level on a bin-by-bin basis. The size of the correction factors is in average, corresponding to an efficiency of , and varies between and for different parts of the covered phase space. The main contributions to the inefficiency are: the azimuthal acceptance of the FNC ( on average), the meson reconstruction efficiency which is zero if one of the tracks has low transverse momentum (), the LRG selection efficiency () and the trigger efficiency (). The bin purity, defined as the fraction of events reconstructed in a particular bin that originate from the same bin on hadron level, varies between and for one-dimensional distributions and between and for two-dimensional ones. As an example, figure 2c illustrates the binning scheme used in the two-dimensional distribution.
3.4 Extraction of the signal
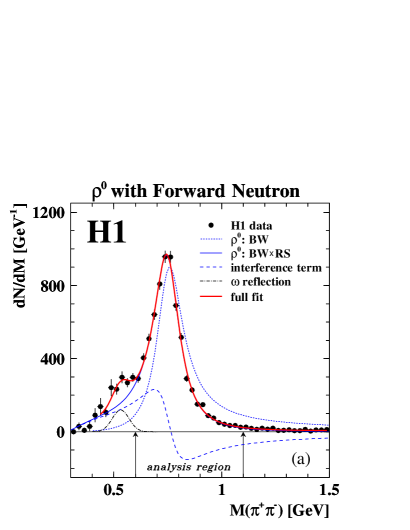
The invariant mass distribution of the two tracks under the charged pion mass hypothesis is shown in figure 3a. The distribution is corrected for the mass dependent detector efficiency.
A fit is performed in the range GeV using the Ross-Stodolsky parametrisation (7) for the meson mass shape and adding the contributions for the reflection from and for the non-resonant background. Other sources of non- background, such as , which may be misidentified as candidates, are estimated using MC simulations with the relative yield normalisation fixed to previously measured and published values: [49], [50] and [51]. The resulting overall background contamination in the analysis region GeV is found to be .
The fitted values of the resonance mass and width are MeV and MeV, respectively, in agreement with the nominal PDG values of and [46]. The cross section is then calculated for the full mass range using the resonant part only, represented by the relativistic Breit-Wigner function with momentum dependent width [52]:
| (8) |
where is the momentum of the decay pions in the rest frame of a pair of pions with mass , and is the value of for .
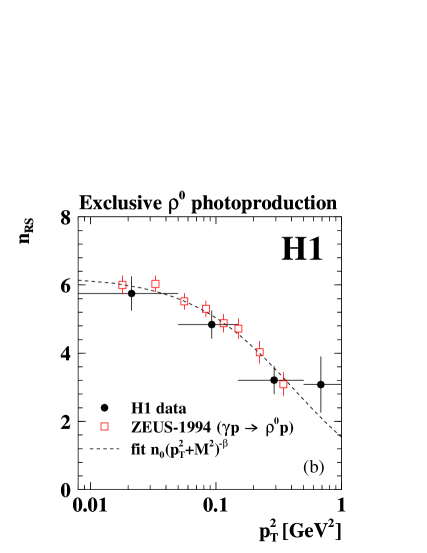
The Breit-Wigner shape is strongly distorted due to interference with the non-resonant production amplitude (dashed curve in figure 3a). The strength of the distortion is -dependent and within the ansatz (7) is characterised by the phenomenological skewing parameter, . For the full range of the present analysis, GeV2, a fit results in the value . To study its dependence the fit is repeated in four bins. The values obtained are shown in figure 3b in comparison with previously published ZEUS results [47] from elastic photoproduction, . The dashed curve represents a fit to all these data by the empirical formula
| (9) |
with and as free parameters. The fitted value of GeV2 suggests that the relevant scale for photoproduction of vector mesons is indeed .
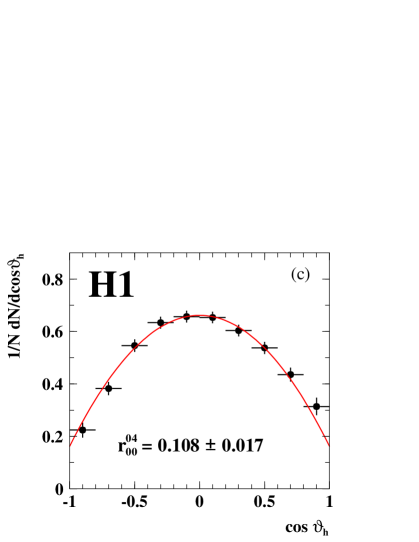
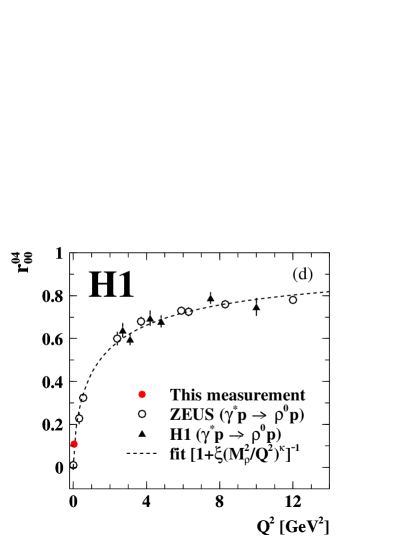
An important set of observables which characterise the helicity structure of the vector meson production are the angular distributions of the decay pions. Here we study the distribution of which gives access to the spin-density matrix element . The angle is defined as the polar angle of the positively charged decay pion in the rest frame with respect to the meson direction in the centre-of-mass frame. According to the formalism presented in [53] the distribution is given by:
| (10) |
Figure 3c shows the acceptance corrected distribution together with the fit by equation (10) yielding the value of . In figure 3d this result is compared to the values obtained in diffractive photo- and electro-production at HERA [47, 54, 55]. The steep dependence is driven mainly by the QED gauge invariance motivated factor , and can be fitted by a simple expression [56]
with the parameters and , as illustrated by the dashed curve.
In summary, all properties of the selected sample investigated here are consistent with photoproduction.
3.5 Signal and background decomposition
The event selection described in section 3.2 does not completely suppress non-DPP background. According to the MC simulations, the remaining part is mostly due to proton dissociation with some admixture of double dissociative events.
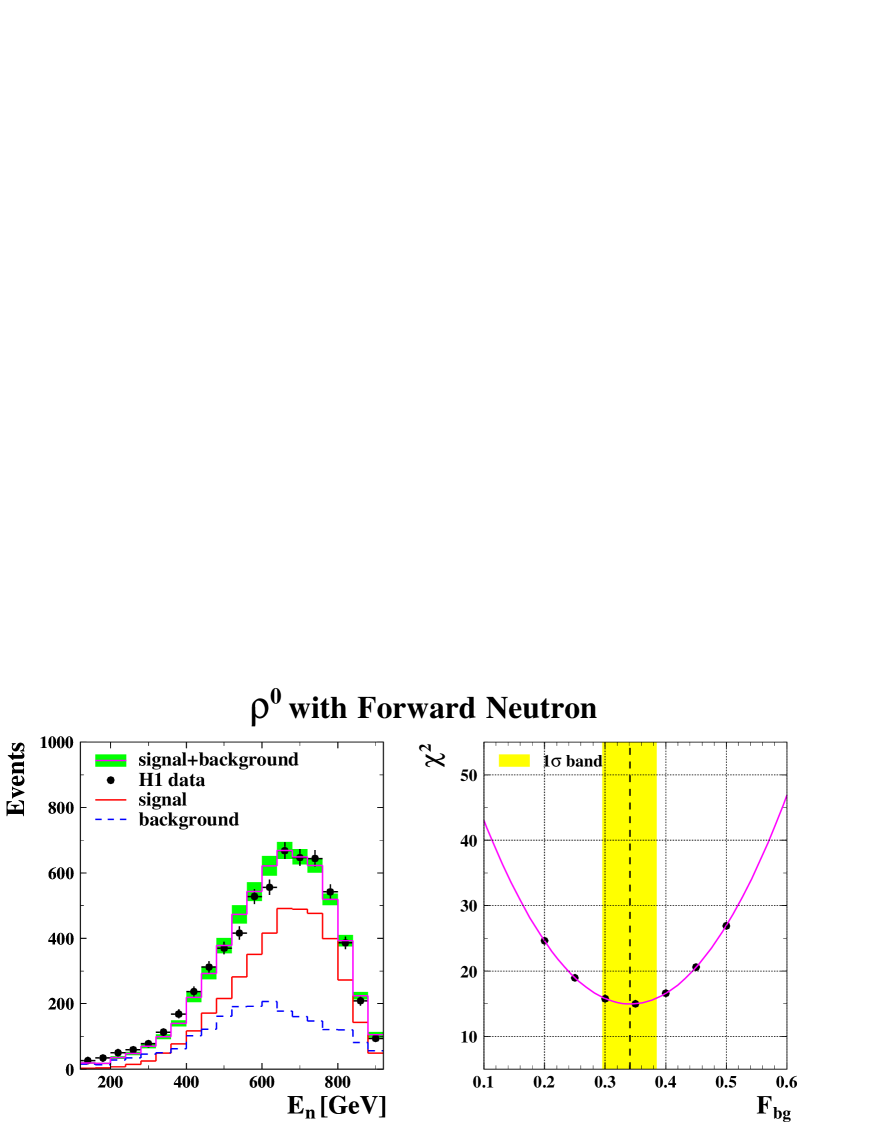
As in the case of inclusive leading neutron production [7] signal and background events have different shapes of the leading neutron energy distribution, although in the present analysis the difference is less pronounced. The shape differences in the neutron energy spectrum predicted by MC for the DPP events (POMPYT) and for the proton dissociative background (DIFFVM) are still sufficient to disentangle these two contributions on a statistical basis. For this purpose a combination of the spectra obtained for reconstructed events of these two MC models fulfilling all selection criteria with free normalisation is fitted to the data. From this fit the background fraction is determined to be . The uncertainty includes both the fit error and systematic uncertainties related to the background shape variation in terms of and dependencies and proton dissociation fraction in the overall diffractive cross section. Figure 4 illustrates this decomposition using the nominal DIFFVM parameters.
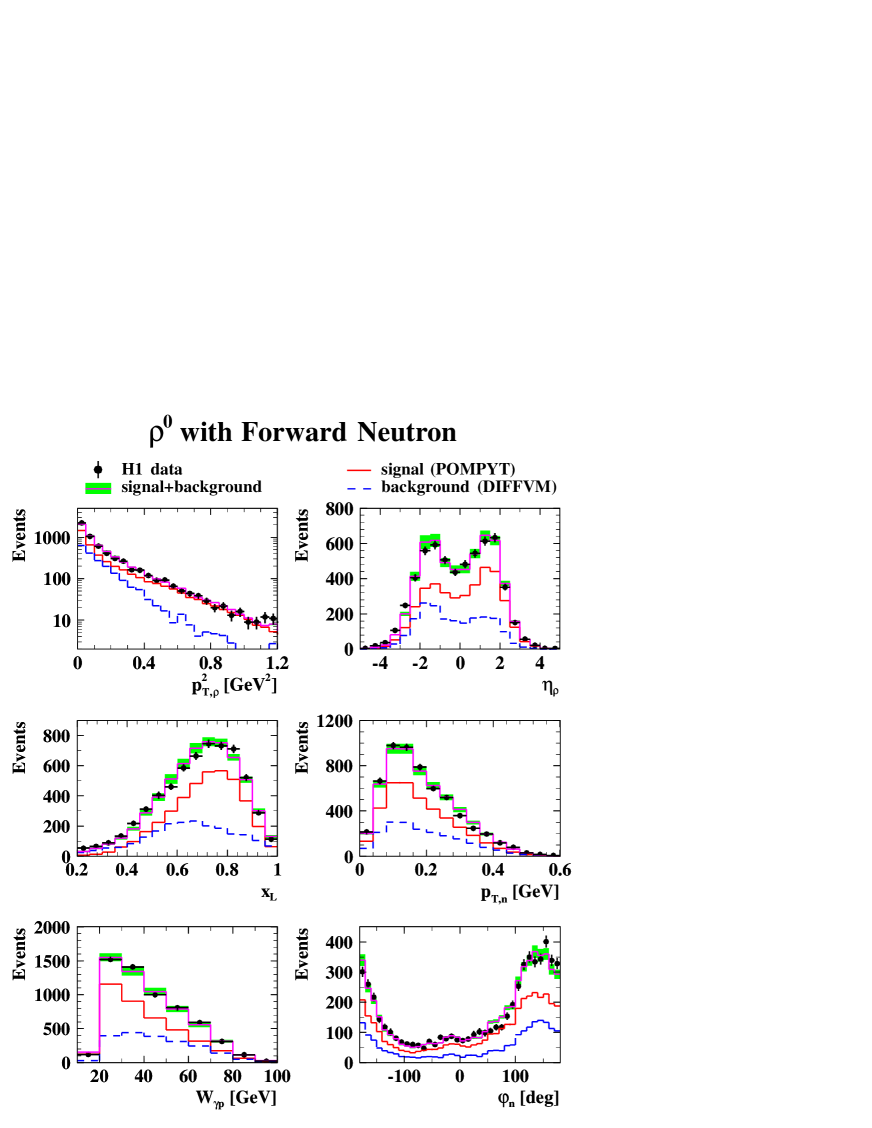
Control plots for the data description by the Monte Carlo models using this signal to background ratio are shown in figure 5. Since neither POMPYT nor DIFFVM are able to provide reliable absolute cross section predictions for such a final state, only a shape comparison is possible. The irregular shape of the azimuthal angle distribution, , is due to the FNC aperture limitations, as shown in figure 2b.
In the fit described above the absolute normalisation for the DIFFVM prediction is left free. As a cross check, this normalisation has been fixed using an orthogonal, background dominated sample, obtained by requiring an ‘anti-LRG’ selection, i.e. events with additional activity in the forward detectors. In this sample the background fraction is found to be . Fixing the DIFFVM normalisation by a fit to the ‘anti-LRG’ sample results in a background contribution of in the main sample. Since the signal-to-background decomposition fit in this cross check gives a worse , the nominal value is used for the cross section determinations. The difference to the value determined in the nominal analysis, as described above, is well covered by systematic uncertainty of the LRG condition efficiency.
3.6 Cross section determination and systematic uncertainties
The cross sections are measured for the kinematic ranges as defined in the rightmost column of table 1. From the observed number of events, , the bin-integrated cross section in bin is calculated as
| (11) |
where is the expected diffractive dissociation background in bin taking into account the overall normalisation fraction , is the correction for detector acceptance and efficiency, is the integrated luminosity of the data, is the extrapolation factor for the number of events from the measurement interval to the full mass range and is the value of the equivalent photon flux from equation (3) for the given range555 Note, that the effective VDM flux (3) converts the cross section into a real cross section at , contrary to the EPA flux [57] converting it to the transverse cross section, averaged over the measured range. The difference between the two approaches amounts to integrated over the range of the measurement.. Since the statistics available does not allow for a reliable mass fit in every measurement bin, is calculated using , obtained from the fit of the full sample and bin-dependent skewing correction factor derived from the fitted dependence of in equation (9).
Several sources of experimental uncertainties are considered and their effects on the measured cross section are quantified. The systematic uncertainties on the cross section measurements are determined using MC simulations, by propagating the corresponding uncertainty through the full analysis chain. The individual systematic uncertainties are grouped into four categories below.
-
•
Detector related sources.
The trigger efficiency is verified and tuned with the precision of using an independent monitoring sample. It is treated as correlated between different bins.The uncertainty due to the track finding and reconstruction efficiency in the central tracker is estimated to be per track [58] resulting in uncertainty in the cross section, taken to be correlated between bins.
Several sources of uncertainties related to the measurement of the forward neutrons are considered. The uncertainty in the neutron detection efficiency which affects the measurement in a global way is [7]. The uncertainty on the absolute hadronic energy scale of the FNC [7] leads to a systematic error of for the -integrated cross section and varying between and in different bins. The acceptance of the FNC calorimeter is defined by the interaction point and the geometry of the HERA magnets and is determined using MC simulations. The uncertainty of the impact position of the particle on the FNC, due to beam inclination and the uncertainty on the FNC position, is estimated to be mm [7]. This results in an average uncertainty on the FNC acceptance determination of reaching up to for the distribution.
The systematics due to the exclusivity condition in the main part of the H1 detector is estimated to be . It gets contributions from varying the LAr calorimeter noise cut between MeV and MeV () and from the parameters of the algorithm connecting clusters with tracks (). This error influences only the overall normalisation.
The uncertainty from the LRG condition is determined in the same manner as in the H1 inclusive diffraction analyses based on the large rapidity gap technique [59, 60]. It is further verified by comparing the cross sections obtained using different components of the forward detector apparatus for the LRG selection: FMD alone vs FMDFTS vs FMDPlug vs FMDFTSPlug. The resulting uncertainty is conservatively estimated to be affecting all bins in a correlated manner.
-
•
Backgrounds.
Three different types of background are considered.Non- background is estimated from the shape of the -vertex distribution and from the analysis of non-colliding proton bunches to be . Background originating from random coincidences between photoproduction events and neutrons from -gas interactions amounts to . This results in background which was statistically subtracted in all distributions with an uncertainty of .
Non- background, as discussed in section 3.4, has an uncertainty of and affects the overall normalisation only.
Diffractive background to the DPP signal events (section 3.5) is estimated with a precision of . This is one of the largest individual uncertainties in the analysis. It is correlated between the bins.
-
•
MC model uncertainties.
The uncertainty in the subtracted diffractive background due to the limited knowledge on diffraction is evaluated by varying the and dependencies in the DIFFVM simulation and the relative composition of diffractive channels within the limits allowed by previous HERA measurements. The resulting uncertainty is a part of the background subtraction systematics listed above.The systematic uncertainty of the MC correction factors for signal events is , varying between and in different bins. It is evaluated from the difference between two versions of the POMPYT MC program with different dependencies of the cross section, as described in section 3.3. Here the uncertainty due to the POMPYT reweighting procedure is also accounted for.
-
•
Normalisation uncertainties.
The uncertainty related to the mass fit, extrapolating from the measurement domain to the full mass range , which implies a correction factor of on average in equation (11) with an uncertainty of due to fit errors.The integrated luminosity of the data sample is known with precision [38].
Together with other normalisation errors listed above the resulting total normalisation uncertainty amounts to .
The systematic uncertainties shown in the figures and tables are calculated using the quadratic sum of all contributions, which may vary from point to point. They are larger than the statistical uncertainties in most of the measurement bins.
The total systematic uncertainty for the integrated cross section is including the global normalisation errors.
4 Results
Total, single- and double-differential photoproduction cross sections for the reaction are measured in the kinematic range defined in table 1. The photon-pion cross section, , is extracted from the differential cross section using the pion flux [27] integrated over the range GeV. The results are summarised in tables 2-9 and are shown in figures 6-13.
4.1 cross sections
The cross section integrated in the domain and GeV2 and averaged over the energy range GeV is determined for two intervals of leading neutron transverse momentum:
| (12) |
and
| (13) |
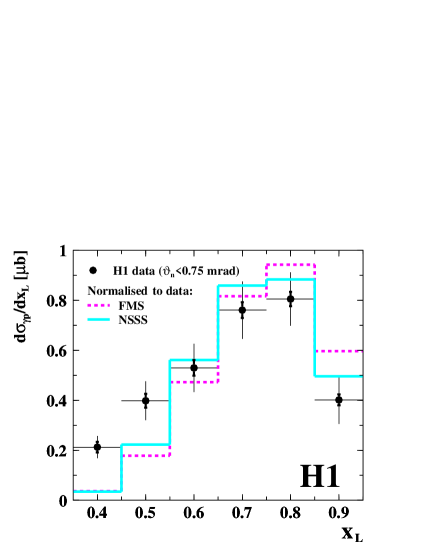
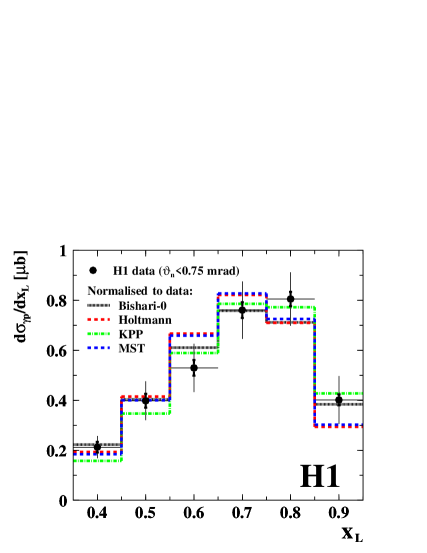
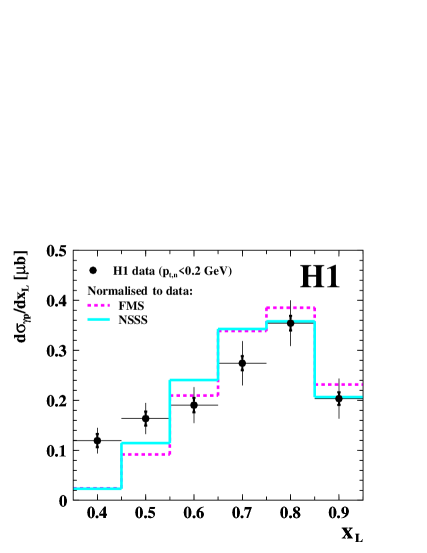
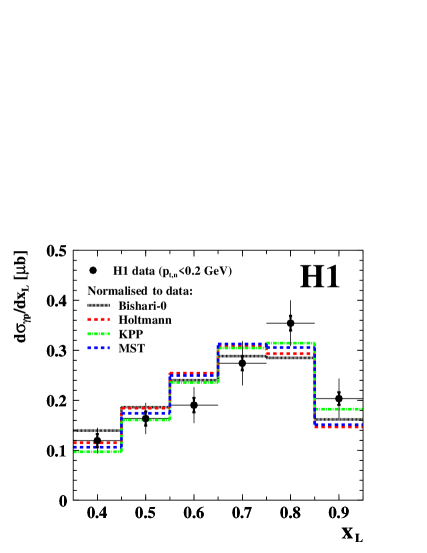
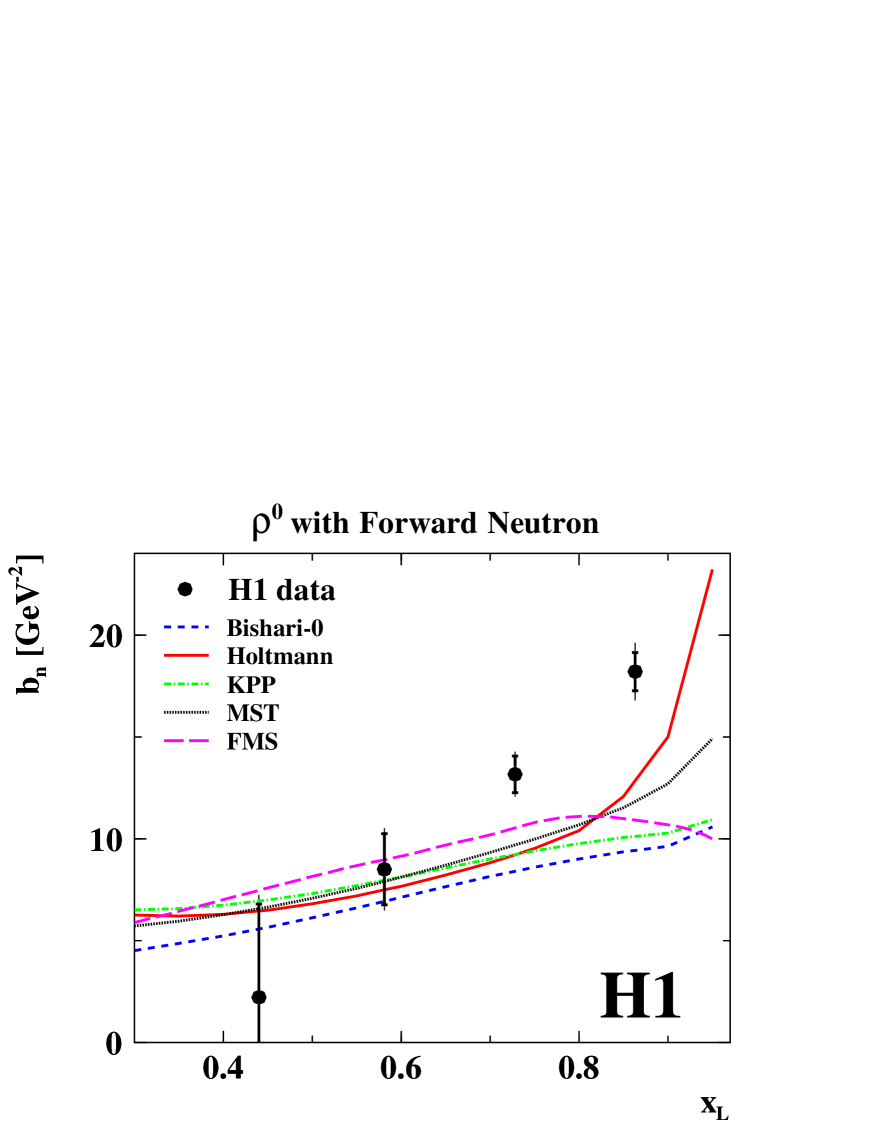
Single differential cross sections as a function of for these two regions are given in table 2 and are shown in figure 6. The data are compared in shape to the predictions based on different models for the pion flux. Some models, like FMS [31] and NSSS [32] are disfavoured by the data and can be ruled out even on the basis of shape comparison alone. The other pion flux parametrisations: Bishari- [26], Holtmann [27], KPP [29] and MST [30] are in good agreement with the data in both ranges.
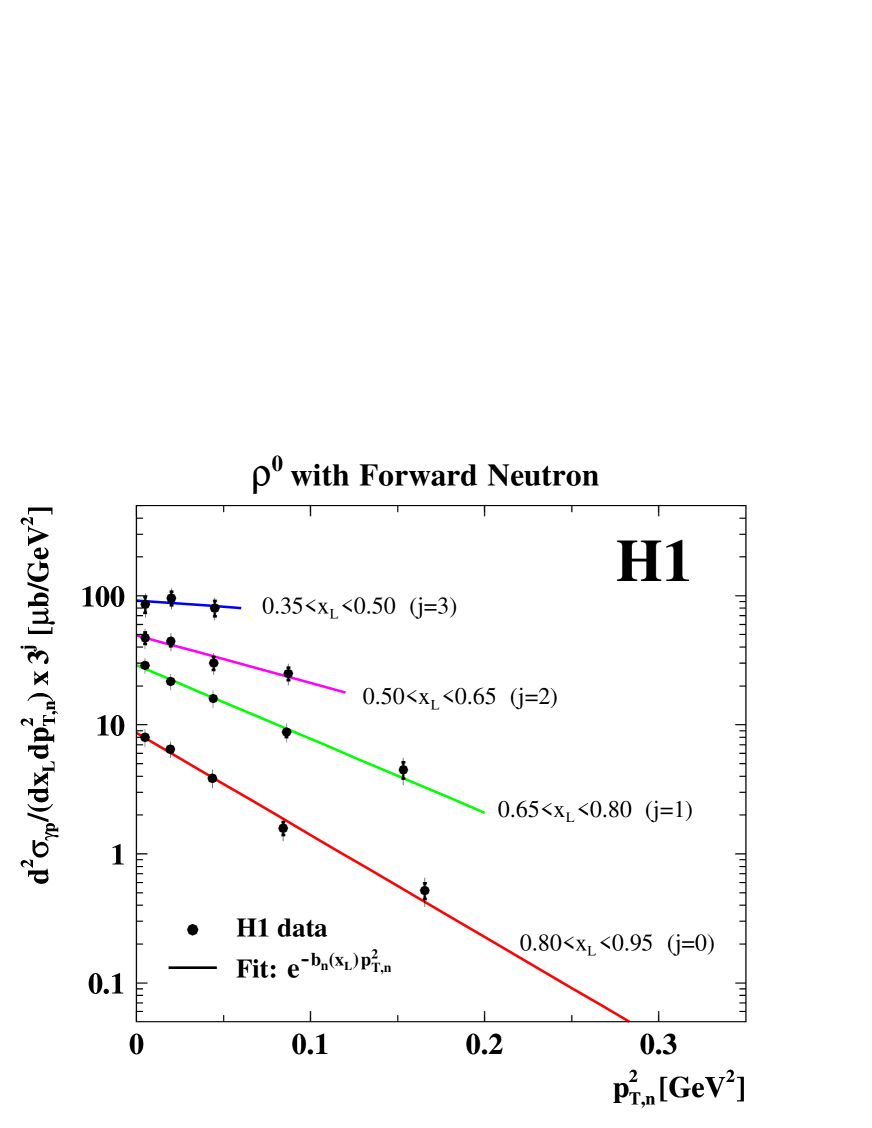
Additional constraints on the pion flux models could be provided by the dependence on (or ) of the leading neutron. The double differential cross section is measured, and the results are presented in table 3 and figure 7. The bins are chosen such, that the data are not affected by the polar angle cut (see figure 2c). Although neither the -, nor the -dependence of the pion flux models are exactly exponential they can be approximated by a simple exponent in many cases. Such an approximation has been used already in other analyses [2, 6]. The -distributions measured here for fixed are compatible with an exponential shape within the statistical and uncorrelated systematic errors. Therefore, the same approach is used here. The cross sections are fitted by a single exponential function in each bin. The quality of the fits is good, with . The results are presented in table 4 and figure 8. The measured -slopes are compared to those obtained from several pion flux parametrisations. Despite of the large experimental uncertainties none of the models is able to reproduce the data666Reweighting the signal MC using the measured slopes has only small effects on the cross section determination and is covered by the systematic uncertainties assigned to the pion flux models. A possible reason for this discrepancy could be the effect of energy-momentum conservation affecting the proton vertex in this exclusive reaction more strongly than in inclusive production of a leading neutron in which an apparent factorisation of the proton vertex has been observed. Another explanation [17, 68] could be absorptive corrections which modify the dependence of the amplitude, leading to an increase of the effective -slope at large as compared to the pure OPE model without absorption.
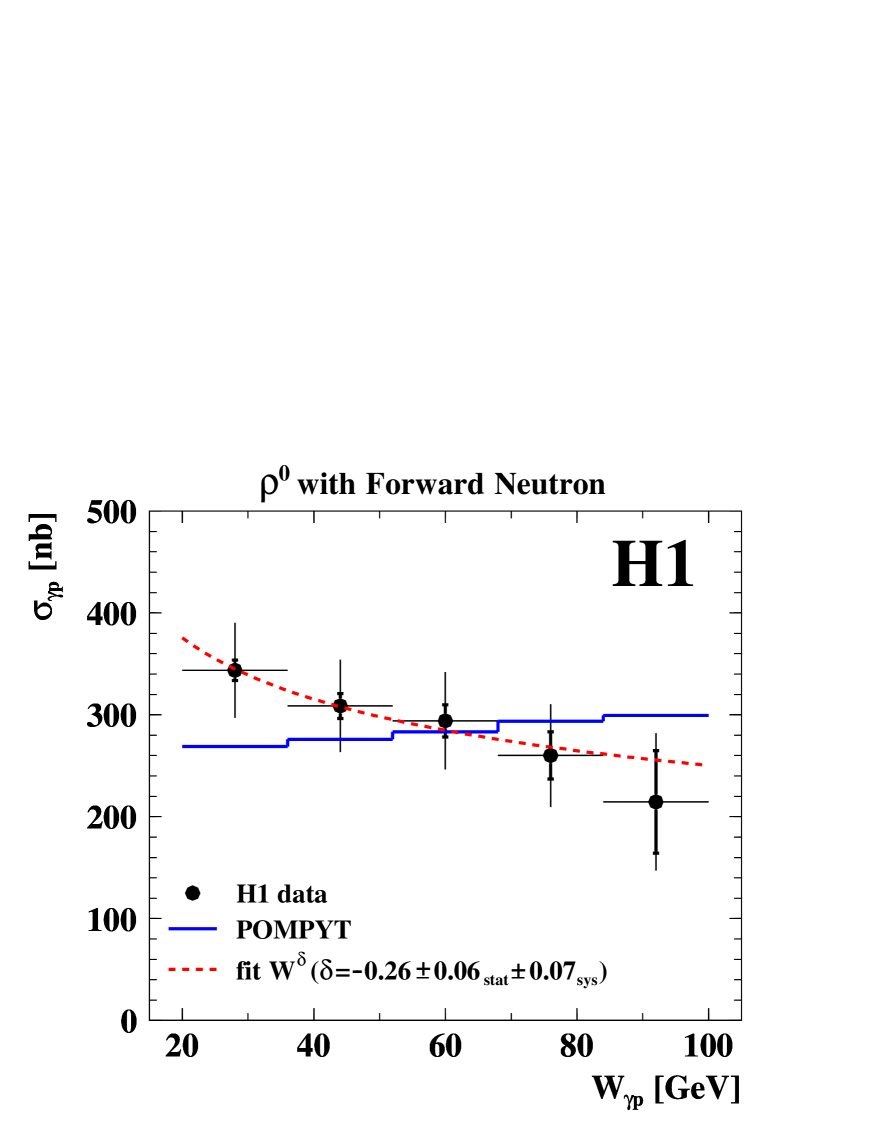
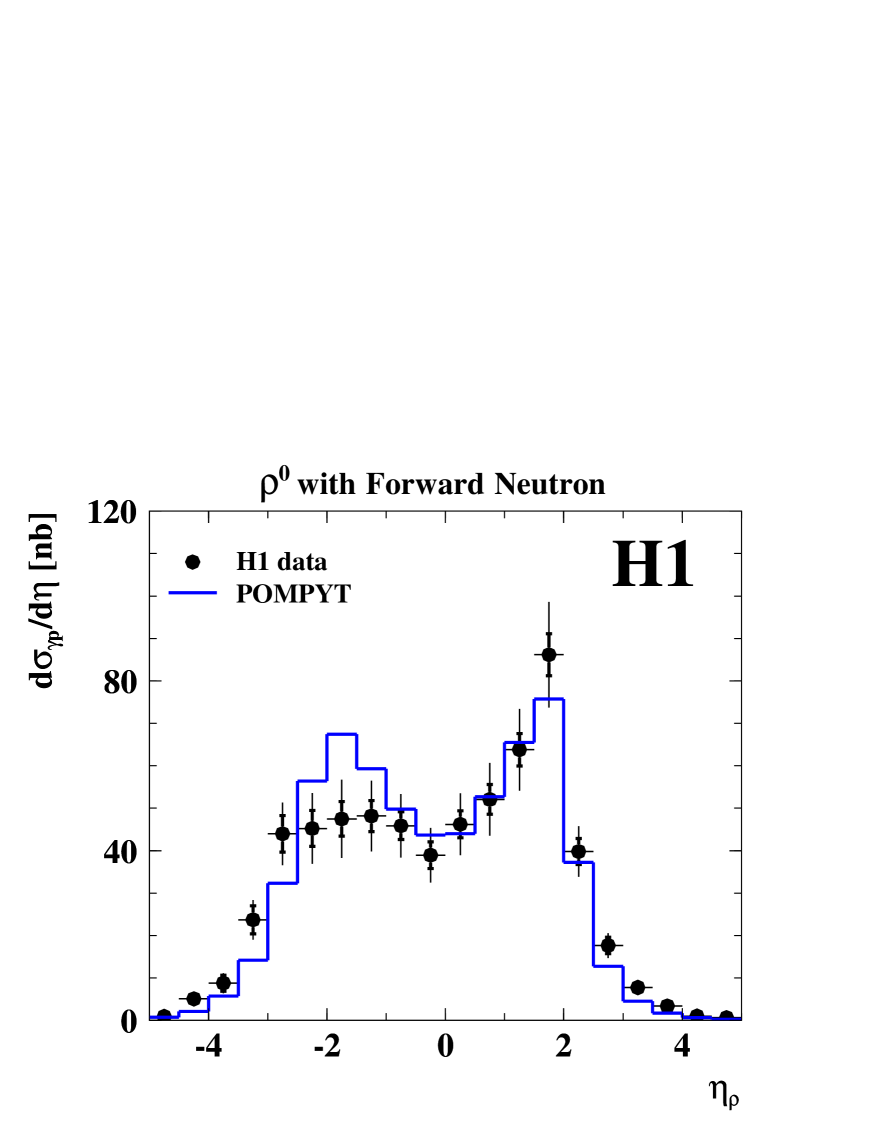
The energy dependence of the reaction is presented in table 5 and in figure 9. The cross section drops with in contrast to the POMPYT MC expectation, where the energy dependence is driven by Pomeron exchange alone. A Regge motivated power law fit to the data, , yields . The difference in the energy dependence in data and MC is also reflected in the pseudorapidity distribution of the meson, which is given in table 6 and shown in figure 10.
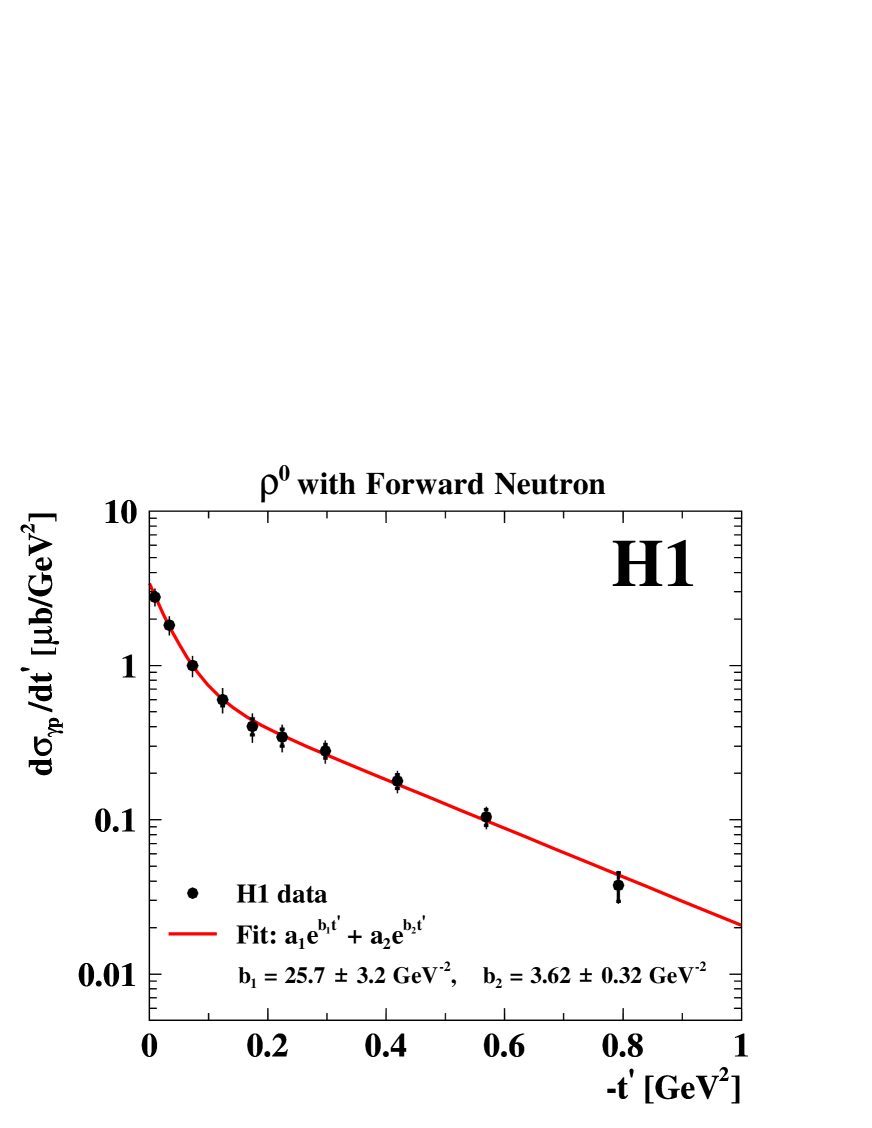
Finally, the cross section as a function of the four-momentum transfer squared of the meson, , is given in table 7 and presented in figure 11. It exhibits the very pronounced feature of a strongly changing slope between the low- and the high- regions. The fit is performed to the sum of two exponential functions:
| (14) |
and yields the following slope parameters:
| (15) |
where the first errors include statistical and uncorrelated systematic uncertainties and the second errors are due to correlated systematic uncertainties. In a geometric picture, the large value of suggests that for a significant part of the data mesons are produced at large impact parameter values of order . In other words, photons find pions in a cloud which extends far beyond the proton radius. The small value of corresponds to a target size of fm. In the DPP interpretation [17, 20, 21] the observed behaviour is a consequence of the interference between the amplitudes corresponding to the diagrams a, b and c in figure 1, leading to a slope dependence on the invariant mass of the system produced at the proton vertex. Since the forward pion is not detected in this analysis the invariant mass cannot be determined with sufficient precision, which prevents explicit measurement of the dependence.
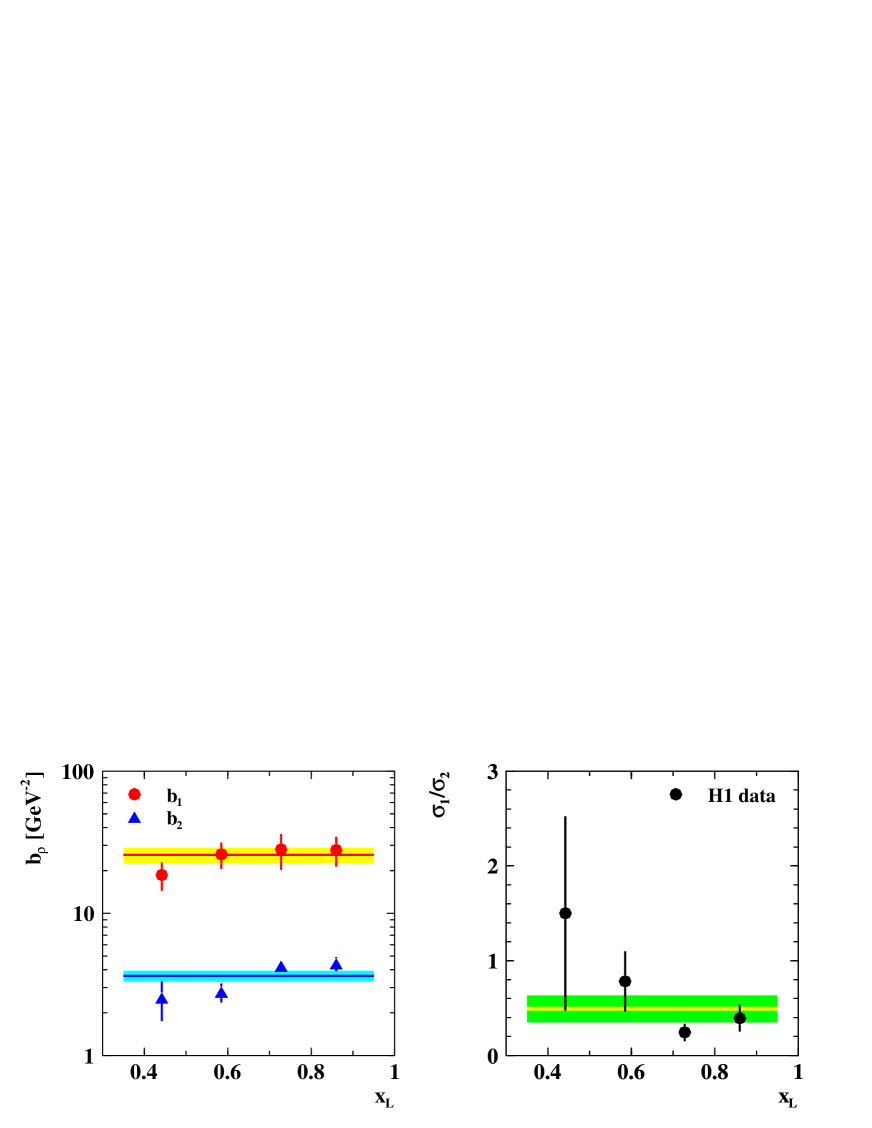
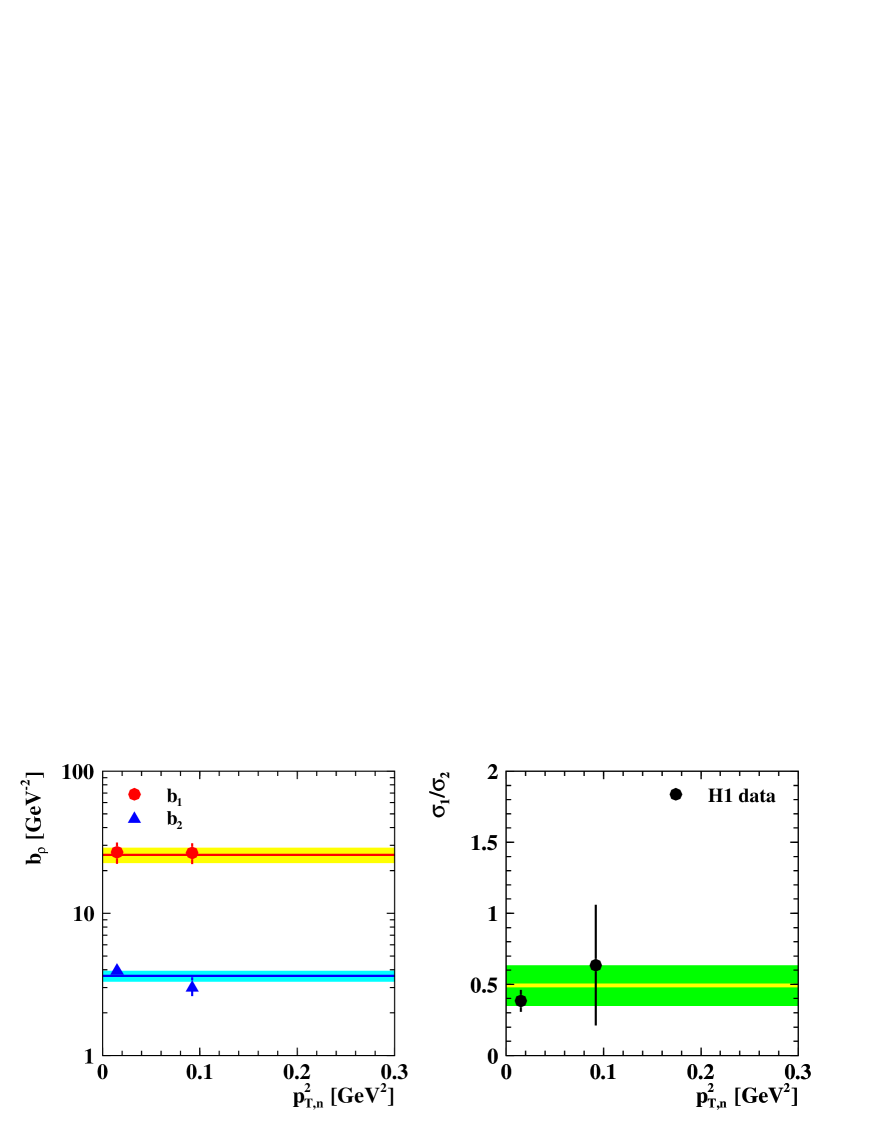
In order to investigate the presence of a possible factorisation between the proton and the photon vertices, the distribution is studied in bins of . The result of the fit by equation (14) with dependent parameters is presented in table 8 and in figure 12 in comparison with the values given in equation (15) for the full range. Also the evolution with of the ratio of two components, , where , is shown. Given the large experimental uncertainties no strong conclusion about factorisation of the two vertices can be drawn.
4.2 cross section
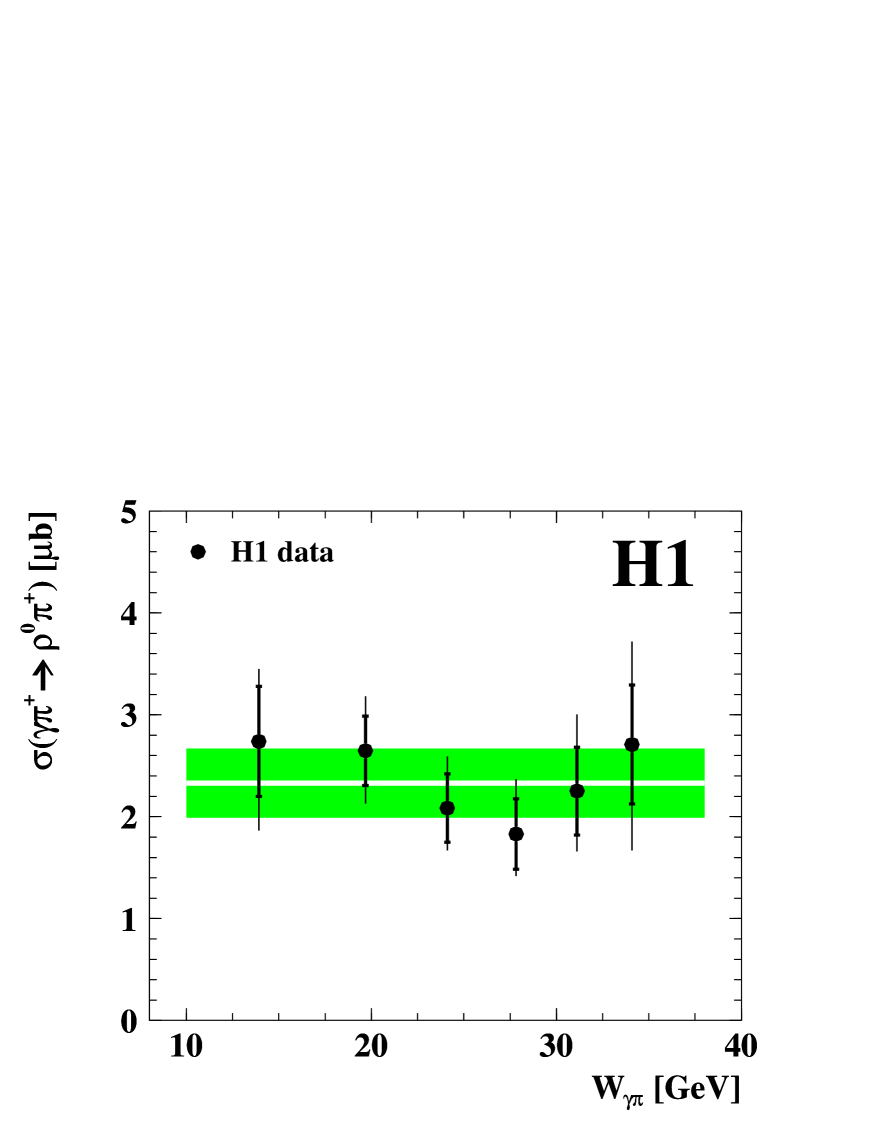
The pion flux models compatible with the data in shape of the distribution are used to extract the photon-pion cross sections from in the OPE approximation. The results are presented in table 9 and in figure 13. As a central value the Holtmann flux [27] is used, and the largest difference to the other three predictions [26, 29, 30] provides an estimate of the model uncertainty which is on average. From the total cross section in equation (13) and using the pion flux (5-6) integrated in and , , the cross section of elastic photoproduction of on a pion target is determined at an average energy GeV:
| (16) |
where the experimental uncertainty includes statistical, systematic and normalisation errors added in quadrature, while the model error is due to the uncertainty in the pion flux integral obtained for the different flux parametrisations compatible with our data.
Theoretical studies of leading neutron production in collisions [27, 29] suggest that in addition to the pion exchange process other processes777For inclusive leading neutron production, trajectories should be considered, while for the exclusive reaction (1) the diagrams shown in figures 1b,c become important at larger . may contribute at level. To suppress these contributions it is recommended to perform cross section measurements in the ‘OPE safe’ phase space region: low and high . In order to investigate a possible influence of non-OPE contributions the extraction of the photon-pion cross section is repeated for two additional regions, in which the validity of pure OPE is assumed. The cross sections for the full FNC acceptance range and for the OPE2 sub-sample together with the value (16) obtained for the OPE1 sample are presented in table 10. The values of extracted in these three different phase space regions agree well within the experimental errors. Thus no evidence for an extra contribution beyond the OPE is found in the full FNC acceptance range for the exclusive reaction studied here.
Taking a value of at the corresponding energy GeV, which is an interpolation between fixed target and HERA measurements (see e.g. figure 10 in [47]), one obtains for the ratio . A similar ratio, but for the total cross sections at GeV, has been estimated by the ZEUS collaboration as [2]. Both ratios are significantly smaller than their respective expectations, based on simple considerations. For , a value of is predicted by the additive quark model [61], while can be deduced by combining the optical theorem, the eikonal approach [62] relating cross sections with elastic slope parameters [63] and the data on [64] and [47] elastic scattering. Such a suppression of the cross section is usually attributed to rescattering, or absorptive corrections [65, 66, 67, 68], which are essential for leading neutron production. For the exclusive reaction studied here this would imply an absorption factor of . It is interesting to note, that this value is similar to the somewhat different, but conceptually related damping factor in diffractive dijet photoproduction, the rapidity gap survival probability, , which has been determined by the H1 collaboration [69, 70, 71].
5 Summary
The photoproduction cross section for exclusive production associated with a leading neutron is measured for the first time at HERA. The integrated cross section in the kinematic range GeV, and mrad is determined with statistical and systematic precision. The elastic photon-pion cross section, , at GeV is extracted in the one-pion-exchange approximation.
Single and double differential cross sections are measured. The differential cross section d shows a behaviour typical for exclusive double peripheral exchange processes.
The differential cross sections for the leading neutron are sensitive to the pion flux models. While the shape of the distribution is well reproduced by most of the pion flux parametrisations, the dependence of the slope of the leading neutron is not described by any of the existing models. This may indicate that the proton vertex factorisation hypothesis does not hold in exclusive photoproduction, e.g. due to large absorptive effects which are expected to play an essential rôle in soft peripheral processes. The estimated cross section ratio for the elastic photoproduction of mesons on the pion and on the proton, , suggests large absorption corrections, of the order of , suppressing the rate of the studied reaction .
Acknowledgements
We are grateful to the HERA machine group whose outstanding efforts have made this experiment possible. We thank the engineers and technicians for their work in constructing and maintaining the H1 detector, our funding agencies for financial support, the DESY technical staff for continual assistance and the DESY directorate for support and for the hospitality which they extend to the non DESY members of the collaboration. We would like to give credit to all partners contributing to the EGI computing infrastructure for their support for the H1 Collaboration.
References
- [1] C. Adloff et al. [H1 Collaboration], Eur. Phys. J. C6 (1999) 587 [hep-ex/9811013].
- [2] S. Chekanov et al. [ZEUS Collaboration], Nucl. Phys. B637 3 (2002) 3 [hep-ex/0205076].
- [3] S. Chekanov et al. [ZEUS Collaboration], Phys. Lett. B590 (2004) 143 [hep-ex/0401017].
- [4] A. Aktas et al. [H1 Collaboration], Eur. Phys. J. C41 (2005) 273 [hep-ex/0501074].
- [5] S. Chekanov et al. [ZEUS Collaboration], Phys. Lett. B610 (2005) 199 [hep-ex/0404002v2].
- [6] S. Chekanov et al. [ZEUS Collaboration], Nucl. Phys. B776 (2007) 1 [hep-ex/0702028].
- [7] F. Aaron et al. [H1 Collaboration], Eur. Phys. J. C68 (2010) 381 [arXiv:1001.0532].
- [8] P. D. B. Collins, “An Introduction to Regge Theory and High-Energy Physics”, Cambridge University Press, 1977.
-
[9]
N.F. Bali, G.F. Chew and A. Pignotti,
Phys. Rev. Lett. 19 (1967) 614;
G.F. Chew and A. Pignotti, Phys. Rev. 176 (1968) 2112;
E. L. Berger, Phys. Rev. 179 (1969) 1567. - [10] H. De Kerret et al., Phys. Lett. B63 (1976) 477.
- [11] J. Biel et al., Phys. Rev. Lett. 36 (1976) 504; J. Biel et al., Phys. Lett. B65 (1976) 291.
- [12] M. Cavalli-Sforza, Lett. Nuovo Cim. 14 (1975) 359.
- [13] G.W. Brandenburg et al., Nucl. Phys. B45 (1972) 397.
- [14] G.V. Beketov et al., Yad. Fiz. 13 (1971) 104.
-
[15]
S. D. Drell and K. Hiida,
Phys. Rev. Lett. 7 (1961) 199;
R.T. Deck, Phys. Rev. Lett. 13 (1964) 169. - [16] L.A. Ponomarev, Sov. J. Part. Nucl. 7 (1976) 70.
- [17] N.P. Zotov and V.A. Tsarev, Sov. J. Part. Nucl. 9 (1978) 266.
- [18] V.A. Tsarev, Phys. Rev. D11 (1975) 1864.
- [19] L.A. Ponomarev, in proceedings of the XVIII International Conference on High-Energy Physics, C76-07-15, Eds. N.N Bogolyubov et al., Tbilisi, USSR (1976) A1-24.
- [20] F. Hayot et al., Lett. Nuovo Cim. 18 (1977) 185.
- [21] G. Cohen-Tannoudji, A. Santoro and M. Souza, Nucl. Phys. B125 (1977) 445.
- [22] J. J. Sakurai, Annals Phys. 11 (1960) 1; J. J. Sakurai, Phys. Rev. Lett. 22 (1969) 981.
- [23] For a review, see e.g. T.H. Bauer et al., Rev. Mod. Phys. 50 (1978) 261.
-
[24]
J. D. Sullivan,
Phys. Rev. D5 (1972) 1732;
V. Pelosi,
Lett. Nuovo Cim. 4 (1972) 502;
G. Levman and K. Furutani, DESY-95-142 (1995) - [25] T.E.O. Ericson, B. Loiseau and A.W. Thomas, Phys. Rev. C66 (2002) 014005 [hep-ph/0009312].
- [26] M. Bishari, Phys. Lett. B38 (1972) 510.
-
[27]
H. Holtmann et al.,
Phys. Lett. B338 (1994) 363;
H. Holtmann, A. Szczurek and J. Speth, Nucl. Phys. A596 (1996) 631. - [28] M. Przybycien, A. Szczurek and G. Ingelman, Z. Phys. C74 (1997) 509.
- [29] B. Kopeliovich, B. Povh and I. Potashnikova, Z. Phys. C73 (1996) 125.
- [30] W. Melnitchouk, J. Speth and A.W.Thomas, Phys. Rev. D59 (1999) 014033.
- [31] L. Frankfurt, L. Mankiewicz and M. Strikman, Z. Phys. A334 (1989) 343.
- [32] N.N. Nikolaev, W. Schäfer, A. Szczurek and J. Speth, Phys. Rev. D60 (1999) 014004.
- [33] I. Abt et al. [H1 Collaboration], Nucl. Instrum. Meth. A386 (1997) 310; ibid, 348.
- [34] D. Pitzl et al., Nucl. Instrum. Meth. A454 (2000) 334 [hep-ex/0002044].
- [35] J. Becker et al., Nucl. Instrum. Meth. A586 (2008) 190 [physics/0701002].
- [36] R. D. Appuhn et al. [H1 SPACAL Group], Nucl. Instrum. Meth. A386 (1997) 397.
- [37] F. Aaron et al. [H1 Collaboration], Eur. Phys. J. C71 (2011) 1771 [arXiv:1106.5944].
- [38] F. Aaron et al. [H1 Collaboration], Eur. Phys. J. C72 (2012) 2163, Erratum-ibid. C74 (2014) 2733 [arXiv:1205.2448].
-
[39]
A. Baird et al.,
IEEE Trans. Nucl. Sci. 48 (2001) 1276
[hep-ex/0104010];
A. Schöning, Nucl. Instrum. Meth., A566 (2006) 130. - [40] P. Bruni and G. Ingelman, in proceedings of the Europhysics Conference, C93-07-22, Eds. J. Carr and M. Perrottet., Marseille, France (1993) 595.
- [41] V.R. Zoller, Z. Phys. C53 (1992) 443.
- [42] B. List and A. Mastroberardino, Proc. of the Workshop on Monte Carlo Generators for HERA Physics, eds. A.T. Doyle et al., DESY-PROC-1999-02 (1999) 396.
- [43] S. Aid et al. [H1 Collaboration], Z. Phys. C69 (1995) 27 [hep-ex/9509001].
- [44] T. Sjöstrand, Comput. Phys. Commun. 82 (1994) 74.
- [45] M. Ross and L. Stodolsky, Phys. Rev. 149 (1966) 1172.
- [46] K. A. Olive et al. [Particle Data Group Collaboration], Chin. Phys. C 38 (2014) 090001.
- [47] J. Breitweg et al. [ZEUS Collaboration], Eur. Phys. J. C2 (1998) 247 [hep-ex/9712020].
- [48] R. Brun et al., “Geant3”, CERN-DD/EE/84-1 (1987).
- [49] M.Derrick et al. [ZEUS Collaboration], Z. Phys. C73 (1996) 73 [hep-ex/9608010].
- [50] M.Derrick et al. [ZEUS Collaboration], Phys. Lett. B377 (1996) 259 [hep-ex/9601009].
-
[51]
T. J. Killian et al.,
Phys. Rev. D21 (1980) 3005;
W. D. Shambroom et al. Phys. Rev. D26 (1982) 1;
A. Abele et al. [CRYSTAL BARREL Collaboration], Eur. Phys. J. C21 (2001) 261;
H. Abramowicz et al. [ZEUS Collaboration], Eur. Phys. J. C72 (2012) 1869 [arXiv:1111.4905]. - [52] J.D. Jackson, Nuov. Cim. 34 (1964) 1644.
- [53] K. Schilling and G. Wolf, Nucl. Phys. B61 (1973) 381.
-
[54]
J. Breitweg et al. [ZEUS Collaboration],
Eur. Phys. J. C12 (2000) 393 [hep-ex/9908026];
S. Chekanov et al. [ZEUS Collaboration], PMC Physics A1 (2007) 6 [arXiv:0708.1478]. -
[55]
C. Adloff et al. [H1 Collaboration],
Eur. Phys. J. C13 (2000) 371 [hep-ex/9902019];
F.D. Aaron et al. [H1 Collaboration], JHEP 1005 (2010) 032 [arXiv:0910.5831]. - [56] I.P. Ivanov, N.N. Nikolaev and A.A. Savin, Phys. Part. Nucl. 37 (2006) 1 [hep-ph/0501034].
- [57] E. Fermi, Z. Phys. 29 (1924) 315; E.J. Williams, Phys. Rev. 45 (1934) 729; C.F. Weizsäcker, Z. Phys. 88 (1934) 612; S. Frixione et al., Phys. Lett. B319 (1993) 339.
- [58] M. Brinkmann, “Measurement of the Meson Production Cross Section and at High in ep Scattering at HERA”, Ph.D. thesis, University Hamburg (2010), DESY-THESIS-2010-016 (available at http://www-h1.desy.de/psfiles/theses/).
- [59] F. Aaron et al. [H1 Collaboration], Eur. Phys. J. C72 (2012) 2074 [arXiv:1203.4495].
- [60] F. Aaron et al. [H1 Collaboration], Eur. Phys. J. C72 (2012) 1836 [arXiv:1107.3420].
-
[61]
E. M. Levin and L. L. Frankfurt,
JETP Lett. 2 (1965) 65;
H. J. Lipkin and F. Scheck, Phys. Rev. Lett. 16 (1966) 71;
J. J. J. Kokkedee and L. Van Hove, Nuovo Cimento 42 (1966) 711. - [62] T.T. Chow and Chen-Ning Yang, Phys. Rev. 170 (1968) 1591.
- [63] B. Povh and J. Hufner, Phys. Rev. Lett. 58 (1987) 1612.
-
[64]
M. Adamus et al. [NE22 Collaboration],
Phys. Lett. B186 (1987) 223;
R.E. Breedon et al. [UA6 Collaboration], Phys. Lett. B216 (1989) 459;
The Durham HepData Reaction Database, http://durpdg.dur.ac.uk/reaction. - [65] N. Nikolaev, J. Speth and B.G. Zakharov, KFA-IKP-TH-1997-17, hep-ph/9708290.
- [66] U. D’Alesio and H.J. Pirner, Eur. Phys. J. A7 (2000) 109 [hep-ph/9806321].
- [67] A.B. Kaidalov et al., Eur. Phys. J. C47 (2006) 385 [hep-ph/0602215].
- [68] B.Z. Kopeliovich et al., Phys. Rev. D85 (2012) 114025 [arXiv:1205.0067].
- [69] A. Aktas et al. [H1 Collaboration], Eur. Phys. J. C51 (2007) 549 [hep-ex/0703022].
- [70] F.D. Aaron et al. [H1 Collaboration], Eur.Phys.J. C70 (2010) 15 [arXiv:1006.0946].
- [71] V. Andreev et al. [H1 Collaboration], JHEP 05 (2015) 056 [arXiv:1502.01683].
| ( GeV) | ( GeV) | |||||||||
| range | range | |||||||
| [GeV2] | [GeV2] | |||||||
| range | [GeV-2] | |
|---|---|---|
| [GeV] | [nb] | |
|---|---|---|
| [nb] | |||||
|---|---|---|---|---|---|
| range | ||||||
|---|---|---|---|---|---|---|
| [GeV2] | [GeV2] | |||||
| range | [GeV-2] | [GeV-2] | ||
|---|---|---|---|---|
| range [GeV2] | [GeV2] | [GeV-2] | [GeV-2] | |
| range | [GeV] | [b] | |
|---|---|---|---|
| range | [GeV] | [GeV] | [b] | |
|---|---|---|---|---|