Abstract
With the rise of social media as an important channel for the debate and discussion of public affairs, online social networks such as Twitter have become important platforms for public information and engagement by policy makers. To communicate effectively through Twitter, policy makers need to understand how influence and interest propagate within its network of users. In this chapter we use graph-theoretic methods to analyse the Twitter debate surrounding NHS England’s controversial care.data scheme. Directionality is a crucial feature of the Twitter social graph - information flows from the followed to the followers - but is often ignored in social network analyses; our methods are based on the behaviour of dynamic processes on the network and can be applied naturally to directed networks. We uncover robust communities of users and show that these communities reflect how information flows through the Twitter network. We are also able to classify users by their differing roles in directing the flow of information through the network. Our methods and results will be useful to policy makers who would like to use Twitter effectively as a communication medium.
Chapter 0 Community detection and role identification in directed networks: understanding the Twitter network of the care.data debate
1 Introduction
The care.data programme is a scheme proposed by NHS England for collating patient-level data from all GP surgeries in England into a centralised national Health and Social Care Information Centre (HSCIC) database[1]. This scheme would complement existing hospital records to create a linked primary- and secondary-care database, which could be used for improving healthcare provisioning and for medical research. The potential benefits of such a database are well-recognised[2, 3]; however, poor communication[4] prior to the roll-out of the scheme in early-2014, alongside concerns around privacy, data security, and the possibility of the sale of data[5], led to the eventual postponement of the scheme[6]. In the months leading up to the initial roll-out, these issues had become a major topic amongst Twitter users interested in healthcare as well as data privacy issues.
Twitter is a popular social network that allows users to post and read short messages with fewer than 140 characters. With 300 million active monthly users, it has become an influential digital medium for debates, mobilising support or opposition, and directing people towards other online material[7]. Twitter thus provides a means for policy makers to engage with the general public and to use it as an effective communication platform, alongside more traditional methods of public engagement. In order to use Twitter effectively, it is important to understand how information and influence spreads within its network of users[8, 9]. The flow of information through Twitter depends on the pattern of connections between users [10], i.e., what Twitter calls the ‘social graph’. Tweets from a particular user appear on the ‘timeline’ of that user’s ‘followers,’ and these followers are then able to respond or ‘retweet’ the message, propagating the information on to their own followers. Within Twitter the directionality of links is therefore critically important; anybody is free to follow and retweet the President of the United States, but, for most users, to be retweeted by the President would be a significant event! It is clear that this asymmetry is a crucial ingredient defining how information propagates through the network.
Extracting information of the detailed directed structure of the Twitter social graph is therefore a key step towards understanding the evolution of a debate on a particular issue, particularly for policy makers who would like to reach the widest possible audience and effectively influence the debate. Concepts from graph theory and network analysis can be applied to address such questions. In particular, community detection is the graph-theoretical problem of identifying meaningful subgroups within a network [11]. Within Twitter, this might correspond to groups of users who share similar interests, or who are engaging with each other on a particular topic. Although previous studies have used community detection methods to analyse Twitter networks [12, 13], these have generally ignored the directionality of the edges. Indeed, most of the widely-used community detection methods are defined for undirected networks and are not easily adapted to the directed case[14].
In contrast, we use here two methods, Markov Stability[15, 16, 17, 18, 19] and Role-Based Similarity (RBS) [20, 21], which are based on the behaviour of dynamical processes on the network and can thus be seemlessly applied to directed networks. Since they are flow-based, these methods naturally explore how information and influence propagate across the network of Twitter users, i.e., the communities and roles found by our analysis reflect the process of information spreading on the network. Markov Stability is a community detection method which identifies groups of nodes in the graph in which the flow of a diffusion process becomes trapped over a particular time scale[18]. Role-based similarity finds groups of nodes based on the similarity of the in- and out-flow patterns, i.e., how flows enter and leave each node based on paths of all lengths. RBS thus provides a deeper insight into the flow roles of individual users within the network than traditional classifications into leaders and followers, or hubs and authorities[22]. We have previously used these methods to analyse a network of influential Twitter users during the 2010 London riots[22].
In this chapter, we apply and extend these methods to analyse a set of tweets relating to the care.data programme, demonstrating how the information derived from graph-theoretical analyses of Twitter data can provide insight to policy makers on how to effectively engage with a Twitter audience. For a discussion of the implications of our research for policy makers see Ref. 23; here we present in greater detail the technical background to the analysis, as well as additional, extended results. We begin in Sections 2 and 3 by explaining the mathematics of the Markov Stability and Role-Based Similarity methods. In section 4 we describe how we construct different directed networks of Twitter users from the set of tweets, based on declared interest (follower relationships) and active participation (retweets). We apply our methods to these networks in section 5, revealing the different communities involved in the care.data debate and the different roles played by users within the debate.
2 The Markov Stability community detection methodology
A frequent goal in network analysis is to partition the graph into meaningful subgroups, or communities, leading to a mesoscopic description of the network that can be extremely useful for making sense of large and complex data sets. The communities so obtained can also help reveal how global structure and function emerges from local connections. The literature contains a large number of methods for community detection (see Ref. 11 for a review). The variety of community detection methods reflects the fact that there cannot be a universal definition of what constitutes a ‘good’ partition of the network. However, most methods follow heuristics based on structural and combinatorial features of the network: typically a subset of nodes is thought of as a good community if the connections between the nodes within the subset are denser than the connections with nodes outside of the subset [11]. Such heuristics are applied through optimisations of a variety of quality functions. A quality function based on this idea underlies the popular modularity method[24].
In addition to the well-known limitations of many of these methods, (such as the ‘resolution limit’ [25], the intrinsic presence of a particular scale, or the bias towards overpartitioning into clique-like communities [26, 27]), structural quality functions are not easily adapted to directed networks[28, 29]. On the other hand, the Markov Stability community detection method is based on the behaviour of dynamical processes on the network and, as such, it applies naturally to both undirected and directed networks[17, 18]. Furthermore, since Markov Stability is based on the flow of a Markov process on the graph, and not on structural features such as edge density, it can detect non-clique-like communities[26]. Other methods have been proposed to detect communities based on diffusion processes, including Infomap[30] and Walktrap[31], yet these methods do not concentrate on fully exploiting the transient information contained in the dynamics corresponding to the analysis of paths at all lengths. It is this dynamical zooming that allows Markov Stability to extract information of the graph at all scales and the plausibility of different coarse-grained descriptions of the graph over different time scales. For a full description of the method see Refs. 15, 17, 26, 18. Here we focus on the specifics of the application to directed networks; we start by outlining the necessary mathematical formalism for random walks on directed networks, and then introduce the Markov Stability quality function and discussing some practical issues related to its optimisation.
1 Random walks on directed networks and Markov Stability
Preliminaries
A directed graph with nodes can be encoded by an adjacency matrix , where if there is a directed edge from node to node , and otherwise. Nodes in directed graphs have an out-degree (given by the sum of rows of the adjacency matrix, ) and an in-degree (given by the sum of columns, ).
The evolution of the probability distribution of a simple discrete-time random-walk on a directed network defined by the (non-symmetric) adjacency matrix is given by
| (1) |
where is a vector, , and is the Markov transition matrix. If the graph is strongly connected (i.e., if any node can be reached from any other node) and aperiodic, then the random walk is ergodic with stationary distribution , the dominant left eigenvector of , i.e., . The entries of are the PageRank of the nodes in the graph, a well known variant of the eigenvector centrality which is used by the Google search algorithm.
In general, real-world networks will not be strongly connected and so the dynamics are not guaranteed to be ergodic. A common approach for ensuring the dynamics are ergodic is to use the ‘Google trick’ of random teleportation: if the random-walk is at a node with at least one out-link, then with probability it will follow one of its outlinks, and with probability it will ‘teleport’ to a random node in the graph with uniform probability. If it is at a node with no out-links, then it will teleport with probability 1. The transition matrix for such a random-walk is
| (2) |
where is a dangling-node indicator vector ( if has no out-links and otherwise). The customary value used for is 0.85, which we adopt below. The equivalent continuous-time random-walk is governed by
| (3) |
and the transition matrix for the continuous time random-walk is then
| (4) |
Directed Markov Stability: definitions and optimisation
The Markov Stability community detection method is based on the analysis of a dynamical process - such as the random-walk described above - on the network. The underlying idea is that the behaviour of dynamical processes on a network can reveal meaningful information about the structure of the graph. Intuitively, ‘good’ communities are regions of the network in which the dynamical process is coherent over a particular time scale. In the case of random walks (akin to diffusion processes), a good community is defined as a subgraph on which the diffusion is well mixed and trapped over a given time scale. By allowing the random-walk to evolve for progressively longer times, the method acts as a ‘zooming lens’, uncovering structure (if present) at all scales. This dynamical zooming allows the method to extract a multi-resolution description without prescribing a scale for the partitions. In addition, the method can find not only the standard clique-like communities, but also non-clique communities, which are of interest in geographic, engineering and social systems.
Operationally, the method works by optimising a time-dependent quality function as follows. A particular partition of the network is represented by the community indicator matrix . Each row of corresponds to a node and each column a community: if node is in community then and the rest of row is zeros. We then define the clustered autocovariance matrix as
| (5) |
where and is the random-walk transition matrix over time (e.g., for the discrete-time simple random walk this is ). Note that in the undirected case, is the actual autocovariance matrix of the diffusion process defined by , whereas for directed networks the matrix is not symmetric and so it is not an autocovariance in the strict sense. The entries of the matrix have an intuitive interpretation in terms of the random-walk: is the probability of starting in community at stationarity and being at community at discounting the probability of two independent random-walkers being in and at stationarity. The diagonal entries can therefore be seen as a measure of the extent to which community traps the flow of the process over time . The overall ‘quality’ of the partition, in terms of trapping the flow of the diffusion process, is the sum of these diagonal entries, and we define the Markov Stability of a partition as
| (6) |
Markov Stability can be used to evaluate the quality of a particular partition found by whichever means or, alternatively, we can use it as an objective function to be maximised over the space of all possible partitions at each value of the Markov time, . This latter approach is followed in the examples below to find good communities with high Markov Stability.
For Markov time , we maximise Markov Stability (6) over the space of all possible network partitions . This optimisation is NP-complete[32], and so we use the heuristic greedy Louvain algorithm[33], which has been shown to provide an efficient optimisation of this function both in benchmarks and in real-life examples. Note that although the Louvain algorithm is formulated for symmetric matrices, and the matrix is not symmetric, we can optimise the directed Markov Stability objective function (6) by exploiting the fact that and optimising this symmetrised function. The greedy Louvain algorithm is deterministic, but the outcome of the optimisation is dependent on the random initialisation seed. We therefore run the algorithm 100 times with different random seeds and choose the partition with the highest Markov Stability. We also record the variability in the ensemble of optimised solutions by computing the average normalised variation of information (VI), a measure of the distance between two partitions [34], between all pairs in the ensemble of 100 optimised partitions. A low VI signifies that there is little difference between the obtained partitions, and we use this as an indication that the community structure of the network at this scale is robust.
By optimising the Markov Stability across a range of times (usually spanning several orders of magnitude), we obtain a sequence of progressively coarser partitions. We do not expect to find relevant structure at all scales. Meaningful communities are chosen according to a double measure of robustness: they should be optimal, according to their Markov Stability, over long expanses of time, making them robust across time scales; they should have low values of their VI, making them robust solutions to the optimisation problem.
3 Finding flow roles in directed networks using Role-Based Similarity
In the above discussion, Markov Stability was introduced as a method for identifying groups of nodes based on the flow of information retained within them over time. We now introduce another graph-theoretical method that uses flow for a different purpose; namely, to identify instead groups of individuals who, although not necessarily close within the Twitter network, have similar patterns of incoming and outgoing flows at all scales. Such groups can be identified as flow roles in the network (e.g., source-like or sink-like in the simplest cases), and can be found through a node similarity measure called role-based similarity (RBS)[21, 35]. Once this RBS node similarity is obtained, we transform it into role-based similarity graph through the use of the relaxed minimum spanning tree (RMST) algorithm. The analysis of this RBS similarity graph reveals the existence of groups of nodes with similar roles in the network. These two methods are outlined below.
1 Role-based similarity
Each node in the network is assigned a ‘profile vector’ that encodes the pattern of in-flows and out-flows passing through that node, computed from the numbers of incoming and outgoing paths of all lengths from that node. The cosine similarity between the profile vectors of all nodes is then computed to obtain the RBS similarity matrix. Two nodes are similar if they have similar in- and out-patterns of network flow through them for all path lengths.[21, 35, 22]
Formally, consider a graph with nodes and adjacency matrix . The profile vector for a node is a vector: the first entries describe the number of paths of length 1 to which begin at that node, and the second entries give the number of paths which end at that node (scaled by a tunable constant). These vectors can be computed straightforwardly by observing that the entries of successive powers of the adjacency matrix give the number of paths of increasing lengths between any two nodes (i.e. is the number of paths of length between nodes and ). The profile vectors are then the row vectors of the matrix given by
| (7) |
where and is the largest eigenvalue of . The choice of changes the rate of convergence of the terms , and hence controls the relative influence of the large-scale structure of the graph. For small , the RBS similarity is based mostly on short paths, i.e., local neighbourhoods. For instance, in the limit only and are taken into account. Conversely, using larger values of leads to profile vectors which include more global information from the graph.
The RBS similarity of two nodes and is then given by the cosine distance between their profile vectors
| (8) |
where and are the th and th rows of .
2 Relaxed minimum spanning tree
The similarity matrix defined by (8) can be thought of as a complete, weighted graph on the nodes, with edges between every pair of nodes weighted by the cosine similarity of their respective profile vectors. Note however that the matrix also represents the similarity between transient (forward and backward) time courses of the linear dynamics on the network. Given the intrinsic continuity of this dynamic representation, we obtain a sparser projection through the use of the relaxed minimum spanning tree (RMST) algorithm, a method to obtain a graph-theoretical projection that captures the underlying continuous geometry of the vectors being considered—here, the points are the profile vectors, which lie in a -dimensional space. [22, 36, 20]
The algorithm proceeds as follows: the minimum spanning tree (MST) of the complete graph is calculated. For each pair of points and the edge is then added to the graph if it is not too much larger than than the largest edge weight in the MST path between and . Formally the edges in the RMST are given by
| (9) |
where is the largest edge weight in the MST path between nodes and , is the distance from node to its th nearest neighbour and is a positive parameter (here we have used and ). The term is a measure of the local density around every point.
4 Twitter data of the care.data debate: follower and retweet networks
The networks analysed here are obtained from a set of tweets relating to the care.data debate. All tweets sent between 1 December 2013 and 27 March 2014 containing the text “care.data”, “caredata” or “care data” were obtained from the provider Gnip 111www.gnip.com. There were 36,745 tweets from 10,031 accounts. The data included the tweeters screen name, the tweet text and the date and time the tweet was sent. Lists of followers of each user in the data set were obtained using the Twitter API (this was carried out in April 2015).
We then constructed two directed networks (Fig. 1): (a) the usual network of followers (‘who follows whom’) amongst the users who appeared in the data set; and (b) the weighted network of retweets (‘who has retweeted whom and how much’). We study the largest connected components of these two networks: the follower network has a single connected component with users (nodes) and edges, corresponding to declared following; the largest connected component of the retweet network has nodes and edges, corresponding to actual retweet activity during this period. The follower network (a) is analysed in Sections 1–5, whereas the retweet network (b) is studied in Section 6.
Using directed Markov Stability, we identify communities in both networks. The communities of users obtained in the network of followers are called interest communities, whereas the communities found in the retweet network are referred to as conversation communities. To provide a visual representation of the common interests within interest communities, and the topics of discussion within conversation communities, we have used the profile text (self-descriptions) of the users and the text of their tweets, usually in the form of word clouds. It is important to remark that the text of the tweets and self-descriptions is only used a posteriori to illustrate our findings. The follower network is also used to identify roles in the network using the RBS-RMST algorithm, as described in Section 3.

5 Results
1 Identification of interest communities in the follower network
By applying the flow-based community detection method Markov Stability to the directed graph of follower relations we identify interest communities: groups of users between whom information, interest and influence is propagated. As seen in our previous studies of Twitter networks, the directionality of the edges is important for capturing this information flow; communities in undirected networks are diffuse and blurred compared to those in the equivalent directed network [22]. Our computations of the directed Markov Stability across times shows a long plateau between Markov times and accompanied by a low variation of information, indicating that the 13-way partition found during this period is robust. Below, we concentrate on this partition although other levels of resolution can provide different information.
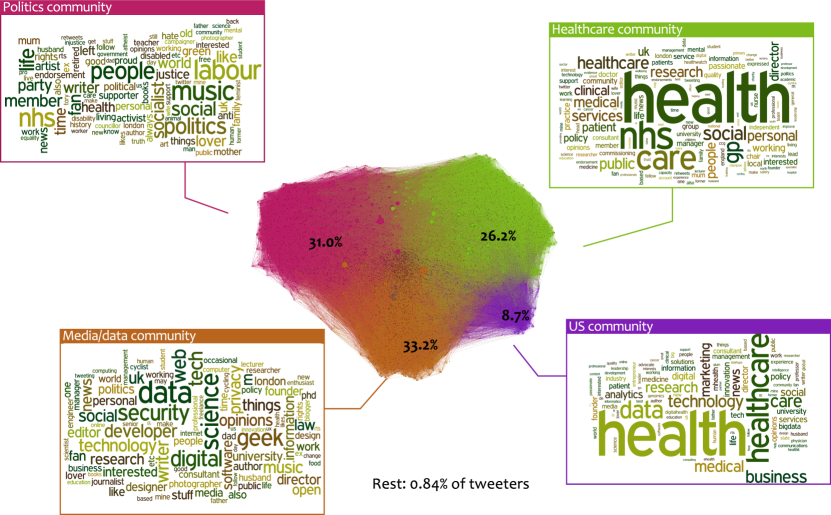
The 13-way partition is composed of four large communities (comprising 99.16% of the users) and nine minor communities, which were not consider further. As shown in Figure 2, our a posteriori analysis of the most frequently appearing words in the users’ personal profiles (self-descriptions) reveals that the three major interest communities correspond to: healthcare professionals, politicians and political activists, and self-confessed ‘data geeks’ and media types. The most common words in the self-descriptions of the healthcare community were ‘health’, ‘nhs’, and ‘care’; the politics community featured words such as ‘labour’, ‘politics’, and ‘people’; and the media/data community users used words such as ‘data’, ‘geek’, and ‘science’. The care.data programme is a healthcare scheme, but the issues surrounding its implementation concerned the proper user of personal data and related security and privacy issues. The fourth largest community presented a mixed set of words including ‘healthcare’/‘health’/‘medical’, but also ‘data’, ‘technology’ or ‘business’. Interestingly, a closer analysis of the users of this community revealed that this group was mainly US-based, and only collaterally participating in the debate due to interest both in data issues and the relevance of NHS reforms to healthcare reforms in the US. Our analysis thus confirms that the nature of the debate is reflected in the different interests of those Twitter users who actively engaged with the debate.
2 Audience of the interest communities
Although Twitter is an open platform, in which anybody is able to create a free account and participate, the analysis of personal profiles suggests that users who engaged in the care.data debate had pre-existing personal interest in the issues being discussed (healthcare, privacy and data security, politics etc.). To understand the global reach of the debate outside the network analysed, we collected the follower list of each user in our network, i.e., all the Twitter users who could have seen a tweet or retweet related to care.data. The number of unique followers was 9.6 million - nearly as many as could be reached by a prime-time Saturday night television advert - demonstrating the clear potential of Twitter as a medium for policy communications (although it is likely that some of these users are ‘fake’ accounts).
Our analysis reveals relatively little overlap between the outside followers of the different communities: 70% of followers of the politics group, 76% of followers of the media/data group, 54% of followers of the healthcare group, and 64.4% of the US group followed only people in that particular interest community (Fig. 3). To ensure that a wide and diverse audience is reached, it is therefore important for policy makers to understand and engage with the different communities in the debate.
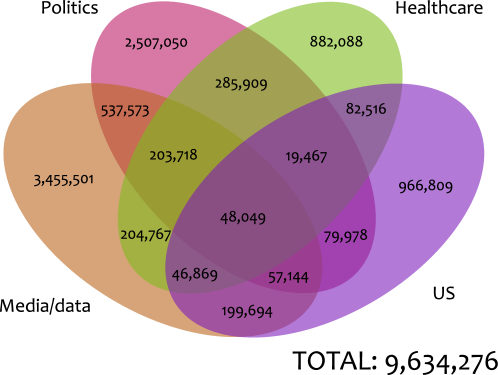
Table 2 shows the users within each community with the largest number of followers. Users in the media/data community with large numbers of followers include the satirist Armando Iannucci (@Aiannucci); the physician and popular science writer Ben Goldacre (@bengoldacre); and the blogger and digital rights activist Cory Doctorow (@doctorow). Users in the healthcare community with a large reach include the British Medical Journal (@bmj_latest), the English NHS (@NHSChoices), and the Department of Health (@DHGovuk). The three users with the most followers in the politics community were slightly unusual: a user posting mainly photos of art (@Asamsakti), the controversial conspiracy theorist David Icke (@davidicke), and a support group for amputees (@walkon_crafters). However, using an online tool222www.twitteraudit.com we found that 81% of followers of @Asamsakti and 85% of the followers of @walkon_crafters are estimated to be ‘fake’ user accounts. Less surprising were the official accounts for the political party the National Health Action party (@NHAparty), the Labour Press Team (@labourpress), and the anti-capitalist protest group Occupy London (@OccupyLondon).
Top users by number of followers in the three main interest communities. \toprule Media/Data Politics Healthcare \colruleUser No. Followers User No. Followers User No. Followers Aiannucci 422829 Asamsakti* (81%) 596380 Dr_Sean_001* (82%) 226264 bengoldacre 378681 davidicke 131739 bmj_latest 161007 thetimes 360178 walkon_crafters* (85%) 117813 NHSChoices 159852 doctorow 359954 HouseofCommons 68802 DHgovuk 139876 digiphile 236273 NHAparty 64416 mencap_charity 84889 WiredUK 224780 labourpress 58264 TheStrokeAssoc 67491 cyberdefensemag 189766 OccupyLondon 56773 NHSEngland 65673 pzmyers 163682 IndyVoices 52191 TheEIU 60561 tom_watson 161073 politicshome 50554 TheBMA 47059 arusbridger 153233 sahil_anas 46096 GdnHealthcare 44587 \botrule {tabnote} * Users in italics have estimated fake followers (percentage in parenthesis)
3 Sentiment analysis of tweets
To determine the sentiment of the discussion and identify some of the topics of discussion, we manually analysed a sample of 250 tweets from the dataset (Table 3). Very few of the tweets were classified as positive (3-5%), the rest being neutral or negative. This is characteristic of how Twitter is used—spikes in tweet activity around a particular event tend to be of a negative nature[37]. Interestingly, however, the proportion of tweets from users in the healthcare community which were classified as negative was lower than in the politics and media/data communities.
There were also differences in the content of the negative tweets between the three interest communities. We divided concerns into three distinct classes:
-
1.
Implementation. Concerns regarding information provision, the opt-out process, and communication with the public.
-
2.
Scheme concept. Concerns about privacy, sharing of personal data, and the use/sale of the data.
-
3.
Execution. Concerns around security, effectiveness of pseudonymisation, and cyber attacks.
While all three communities were predominantly negative about the care.data scheme, each focused on different arguments. The politic community mainly discussed the scheme concept of sharing personal data, as well as the security concerns that are associated with it. The healthcare and media/data communities on the other hand were primarily concerned about the implementation of the care.data project, concentrating on the contested opt-out arrangement and perceived lack of communication to the public.
Sentiment and content analysis of a random sample of 250 tweets. \toprule Healthcare Politics Media/Data \colruleTweet sentiment Positive 5% 4% 3% Negative 58% 75% 62% Neutral 37% 21% 35% \colruleMajor concerns Implementation1 65% 28% 54% Scheme concept2 28% 43% 35% Execution3 7% 29% 11% \botrule {tabnote} 1 information provision, the opt-out process, communication to the public {tabnote} 2privacy, sharing of personal data, use/selling of the dataset {tabnote} 3security concerns, re-identification, cyber attacks
4 Bridgeness between communities
The communities identified in the follower network are regions where a dynamical process is likely to become trapped, so information flows less readily between these communities than within them. This suggests that relatively few links could act as a ‘bridge’ between communities and could be effective at propagating the flow from one to another. An example of such a connection would link one user who is following influential individuals in one community and another who is being followed by many people in another community (Fig. 4). To identify the ‘bridges’ from community to community , we calculate the shortest paths between all pairs of nodes , where and . Note that the flow of information is in the opposite direction to that of the edges: if there is an edge from node to node , then content produced by user is consumed by user . The bridgeness (centrality) of an edge is then defined as the proportion of shortest paths which pass through that edge - this is equivalent to the classic betweeness centrality measure, but now only shortest paths between specific subgroups of the nodes are considered. Such information could be useful for policy-makers who find they have more success in engaging users in community than in - since they will be able to target those users in who are most able to propagate that information on to .
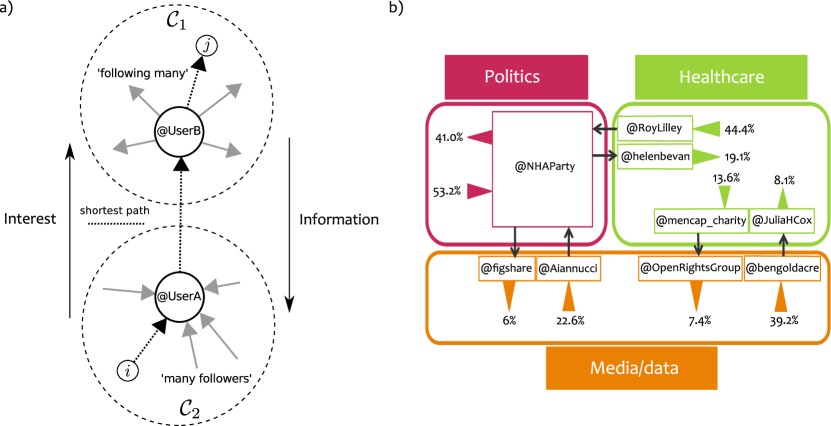
As an illustration of the type of information that can be extracted, we have considered the bridging links with the highest bridgeness centrality between the three largest communities (Fig. 4). (A more nuanced view can be obtained by considering a longer list of bridges and their profiles, see Table 4.) The highest bridgeness centrality for flow from the politics community to the healthcare community is the link from Roy Lilley (@RoyLilley) to the National Health Action party (@NHAparty). Roy Lilley is followed by 44.4% of users in the healthcare community, and the NHA party is following 41.0% of users in the politics community. The highest bridgeness centrality for flow in the opposite direction (from the healthcare community to politics) is the link from the NHA party to NHS healthcare professional Helen Bevan (@helenbevan). The NHA party is being followed by 53.2% of the politics community and Helen Bevan is following 19.1% of the healthcare community. The partial asymmetry here is interesting: within the politics community, the NHA party has a large number of followers (53.2%) and a large number of users it follows (41.0%), meaning it is able to act as both a broadcaster of information to this community and a receiver of information from it. In contrast, Roy Lilley is followed by a large proportion of people in the healthcare community (44.4%) but follows relatively few (3.4%); he is therefore more likely to act as a broadcaster of information to the community. Helen Bevan follows a larger proportion of the healthcare community (19.6%), and is therefore exposed to a larger amount of the content generated by its users.
The top 5 bridging edges in the boundaries across interest communities ranked according to their bridgeness ratio (BR). The bridgeness ratio of an edge is the number of shortest paths from to which pass along that edge divided by the expected number of paths to pass along any edge at that boundary. A high BR means that a disproportionally large number of shortest paths pass through this edge. Due to the asymmetry of the information flow from followed to follower, the relevant edges are different depending of the direction in which the boundary is crossed. \toprulePolitics Media/Data BR Politics Healthcare BR Media/Data Healthcare BR \colrule @NHAparty @figshare 59.9 @NHAparty @helenbevan 277.8 @bengoldacre @JuliaHCox 62.9 @NHAparty @PaulLomax 52.5 @NHAparty @Richard_GP 200.6 @bengoldacre @WelshGasDoc 48.8 @NHAparty @PaulbernalUK 52.2 @butNHS @helenbevan 91.3 @bengoldacre @PharmaceuticBen 44.0 @NHAparty @rahoulb 43.1 @NHAparty @BWMedical 82.3 @bengoldacre @Azeem_Majeed 40.8 @haloefekti @cyberdefensemag 41.6 @NHAparty @H20MCR 79.8 @bengoldacre @bmj_latest 37.1 Media/Data Politics BR Healthcare Politics BR Healthcare Media/Data BR \colrule @Aiannucci @NHAparty 208.9 @RoyLilley @NHAparty 203.8 @mencap_charity @OpenRightsGroup 35.7 @tom_watson @roberthenryjohn 51.8 @ManchesterCCGs @KayFSheldon 108.5 @bmj_latest @psychemedia 32.2 @bengoldacre @grahamemorris 50.8 @bmj_latest @NHAparty 91.8 @bmj_latest @figshare 30.5 @laurakalbag @NHAparty 46.1 @stevenowottny @KayFSheldon 49.1 @JuliaHCox @bainesy1969 30.3 @bengoldacre @carolinejmolloy 45.9 @clarercgp @NHAparty 48.3 @Jarmann @bainesy1969 27.3 \botrule
A similar asymmetric pattern is observed for information flow between the healthcare and media/data communities, and between the media/data and politics communities. The highest bridgeness centrality for healthcare to media/data is via the link from Ben Goldacre (@bengoldacre) to Julia Cox (@JuliaHCox), whereas the highest bridgeness centrality for flow in the opposite direction is via the link between the Mencap charity (@mencap_charity) and the Open Rights Group (@OpenRightsGroup). Flow from politics to media/data is via the link between Armando Iannucci and the NHA party, whereas flow from media/data to politics is via the the link between the NHA party and the software company figshare (@figshare).
The asymmetry observed in the bridgeness centralities reinforces the notion that directionality is crucial for understanding patterns of information flow through the network. It also suggests that, depending on the users someone is following and being followed by, individuals might play different roles in propagating the flow of information through the network. We explore this idea in more detail in the following section.
5 Identifying roles in the follower network
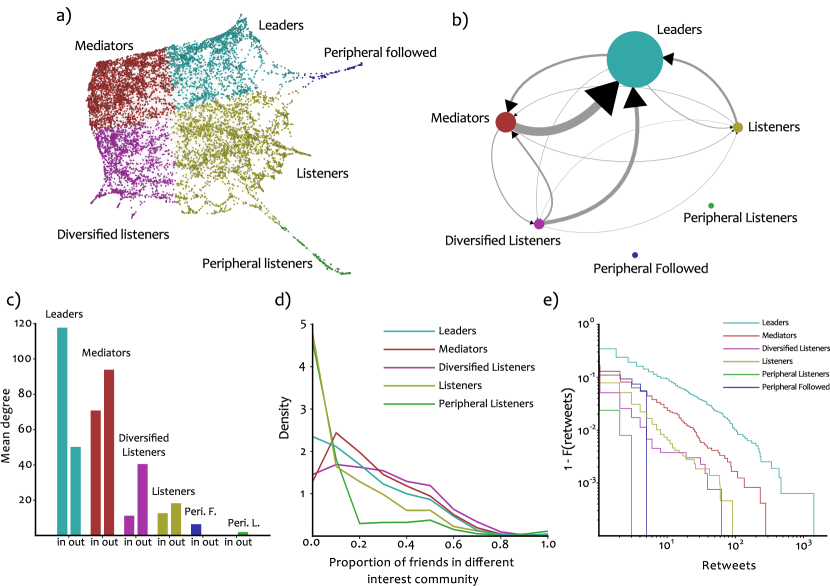
To identify the different roles played by users in propagating the flow of information via the Twitter social graph, we constructed the RBS-RMST similarity graph for the follower network. We then used Markov Stability on this similarity graph to identify groups of nodes with similar in-flow and out-flow patterns. We find a robust partition of the similarity graph into 6 groups, which correspond to 6 distinct roles for the Twitter users according to their flow patterns (Fig. 5a). The meaning of the 6 roles identified can be understood by considering the aggregated in- and out-flows in the social graph for each of the roles; by computing the in- and out-degree for each role; and by obtaining the proportion of their friends who lie in a different interest community. All of these characterisations are presented in Fig. 5 b-d.
The combined information from all these measures allows us to describe the identified roles as:
-
1.
Leaders: users with higher in-degree (number of followers) than out-degree. Users in this group tend to follow few people, mainly in the mediator group.
-
2.
Mediators: users with roughly the same same in-degree and out-degree who are both following and being followed by users in all other groups.
-
3.
Listeners: users with few followers, and who are following a small number of people from primarily the ‘Leader’ group.
-
4.
Diversified listeners: users with few followers, but who are following a larger and more diverse group of users than the ‘Listener’ category.
-
5.
Peripheral followers: users who are following a very small number of other users and are being followed by no-one.
-
6.
Peripheral followed: users who are being followed by a small number of users but are following no-one.
The users with the largest number of followers in the ‘Leader’ role are the physician and science writer Ben Goldacre; former Chair of the Council of the Royal College of General Practitioners Clare Gerada (@clarercgp); and the account of the Department of Health. In the ‘Mediator’ role, the NHA party, the Joseph Rowntree Foundation (@jrf_uk), and Care Quality Commision board member Kay Sheldon (@KayFSheldon) have the largest number of followers.
We calculated the proportion of each user’s friends (users they are following) who are in a different interest community from themselves (as calculated in Section 1) for each of the different roles (Fig. 5d). The diversified listeners have the greatest proportion of friends outside their own interest community, which confirms that these users are following a broad range of other accounts involved in the care.data debate. The mediators and leaders also tend to follow a significant number of people outside their own interest community. The listeners and peripheral listeners follow predominantly others within the same interest community, suggesting that their involvement or interest was focused on one particular aspect of the debate.
To understand how the different roles identified in the follower network translate into actual participation in the care.date debate we calculated the distributions of retweets for each of the role communities (Fig. 5e). There is a clear separation between the ‘Leader’ category, which garners the most re-tweets, and the follower categories ‘Listener’ and ‘Diversified Listener’, which are rarely retweeted, with the ‘Mediator’ category lying in-between but closer to the ‘Leader’ group. These results suggest that identifying users who have ‘Leader’ and ‘Mediator’ roles in follower networks can predict those users who are likely to have greatest influence in the debate. We now explore the structure of the retweet network obtained from the collected tweet corpus.
6 Conversation communities in the retweet network
The Twitter social graph (i.e., the follower network studied above) encodes the possibility of information flow through Twitter—tweets from a user you are following will appear on your timeline and you have the opportunity to retweet them or send a related tweet. Of course, most people cannot and do not engage actively with all information they are exposed to. Since we have the set of all tweets concerning care.data, we are able to explore the actual flow of information on this specific topic. To allow us to understand the issues being discussed, and the groups of people who are actively engaging with each other through Twitter, we have therefore analysed the network of retweets (‘who retweets whom and how much’) using our community detection framework to find conversation communities. We then interpret the results through an a posteriori summary of the text of the tweets in the obtained groups.
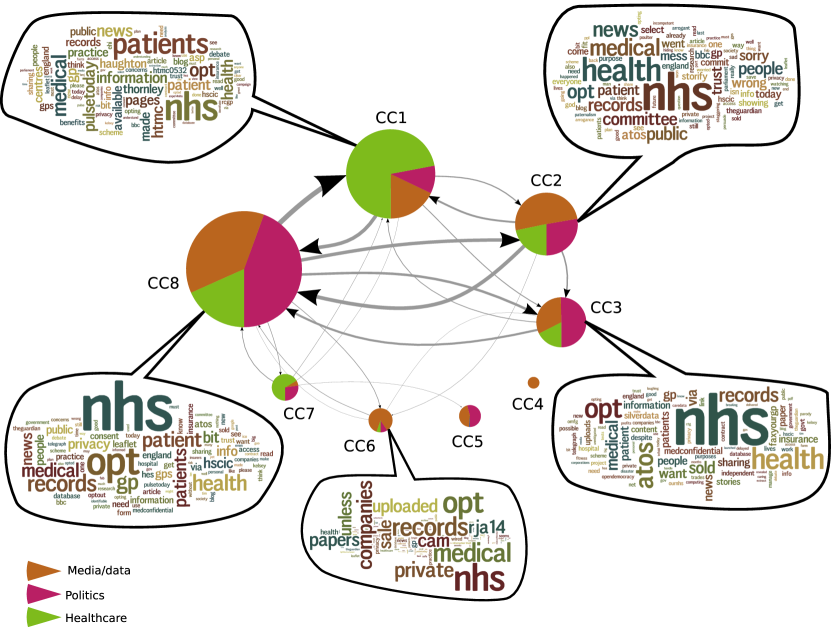
Applying Markov Stability, we identify a robust partition of the retweet network into 8 conversation communities (Fig. 6). Table 6 shows how participants within each conversation community are split between the three largest interest communities (healthcare, media/data, politics). The conversation communities contain an uneven split of users from the interest communities: except conversations 5 and 8, all conversations are dominated by users from a particular interest community. This result confirms that in the care.data debate there is a greater flow of information between users with similar interests, and this implies that interest communities (identified from the network of follower relations) provide a good indication of how information is likely to flow through the Twitter network.
Mix of users in the 8 conversation communities according to the 3 main interest communities. The and signs indicate whether the observed number of users is above or below expectation. All conversation communities (except Conversation 4) are significant () according to a chi-square statistic calculated for each row independently. \toprule Politics Media/Data Healthcare \colruleConversation 1 201 113 808 ‘Healthcare’-dominated(∗∗∗) Conversation 2 427 778 334 ‘Media/Data’-dominated(∗∗∗) Conversation 3 834 532 290 ‘Politics’-dominated(∗∗∗) Conversation 4 0() 2(+) 0() Conversation 5 65 54 1 ‘Politics’ & ‘Media/Data’(∗∗∗) Conversation 6 29 261 16 ‘Media/Data’-dominated(∗∗∗) Conversation 7 66 15 161 ‘Healthcare’-dominated(∗∗∗) Conversation 8 754 632 311 ‘Politics’ & ‘Media/Data’(∗∗∗) \botrule
To identify the topics being discussed within the different conversations, we extracted the text of the tweets and retweets sent by users within each group and produced word clouds with the most frequent words used in those conversations (Fig. 6). Conversation 1 centred primarily around healthcare professionals discussing the impact of the scheme on patients, containing words such as ‘patient’, ‘public’, and ‘people’. The media and data tweeters in conversation 2 were more opinionated, using words like ‘mess’, ‘wrong’, and ‘sorry’. In conversation 3, political activists discussed privacy issues such as the ‘opt’ out arrangement, the selling (‘sold’) of ‘records’ to ‘insurance’ companies, and the involvement of the controversial digital services company Atos. Conversation 6 was dominated by data geeks, who discussed ‘medical records’ and ’privacy’ issues. Finally, conversation 8 brought together users from both the healthcare and data communities in a more general discussion.
6 Conclusion
By applying the multiscale flow-based community detection method Markov Stability to follower networks of Twitter users, we have identified separate participating groups in the debate concerning the healthcare programme care.data. We have shown that users within these groups share similar interests, and that the audience of Twitter users outside the network (i.e. those who did not participate in discussion of care.data, but follow someone who did) are distinct for the different communities. By analysing the retweet network, we have identified specific topics being discussed in different conversation communities. Furthermore, by comparing the communities found in the follower and retweet networks, we have shown that the actual flow of information (in the form of retweets) is heavily influenced by the network of follower relations. Using role-based similarity, we have classified the users in the care-data debate according to the role they play in propagating information across the network. The information uncovered by these methods could be of great value to policy makers, who, in order to target the largest possible audience, need to understand the different communities and the different roles played by the individuals within them.
References
- 1. NHS England. The care.data programme - collecting information for the health of the nation. [Online]. Available from: www.england.nhs.uk/ourwork/tsd/care-data/ [Accessed: 26 May 2015].
- 2. W. Raghupathi and V. Raghupathi, Big data analytics in healthcare: promise and potential, Health Information Science and Systems. 2(1), 3 (2014).
- 3. Darzi, Ara. Care.data will close the gap between outsiders and those in the loop . [Online]. Available from: http://www.hsj.co.uk/comment/darzi-caredata-will-close-the-gap-between-outsiders-and-those-in-the-loop/5067686.article [Accessed: 26 May 2015].
- 4. Vallance, Chris. Adults ‘unaware of NHS data plans’. [Online]. Available from: http://www.bbc.co.uk/news/health-26187980 [Accessed: 26 May 2015].
- 5. Editorial, Power to the people, Nature. 505(7483) (2014). doi:10.1038/505261a.
- 6. Triggle, Nick. Giant NHS database rollout delayed. [Online]. Available from: http://www.bbc.co.uk/news/health-26239532 [Accessed: 26 May 2015].
- 7. C. Honey and S. C. Herring. Beyond microblogging: Conversation and collaboration via twitter. In System Sciences, 2009. HICSS’09. 42nd Hawaii International Conference on, pp. 1–10 (2009).
- 8. S. Wu, J. M. Hofman, W. A. Mason, and D. J. Watts. Who says what to whom on twitter. In Proceedings of the 20th international conference on World wide web, pp. 705–714 (2011).
- 9. K. Lerman and R. Ghosh, Information contagion: An empirical study of the spread of news on digg and twitter social networks., ICWSM. 10, 90–97 (2010).
- 10. D. M. Romero, B. Meeder, and J. Kleinberg. Differences in the mechanics of information diffusion across topics: idioms, political hashtags, and complex contagion on twitter. In Proceedings of the 20th international conference on World wide web, pp. 695–704 (2011).
- 11. S. Fortunato and C. Castellano. Community structure in graphs. In Computational Complexity, pp. 490–512. Springer (2012).
- 12. M. Conover, J. Ratkiewicz, M. Francisco, B. Gonçalves, F. Menczer, and A. Flammini. Political polarization on twitter. In ICWSM (2011).
- 13. L. Weng, F. Menczer, and Y.-Y. Ahn, Virality prediction and community structure in social networks, Scientific reports. 3 (2013).
- 14. F. D. Malliaros and M. Vazirgiannis, Clustering and community detection in directed networks: A survey, Physics Reports. 533(4), 95–142 (2013).
- 15. J.-C. Delvenne, S. N. Yaliraki, and M. Barahona, Stability of graph communities across time scales, Proceedings of the National Academy of Sciences. 107(29), 12755–12760 (2010).
- 16. J. C. Delvenne, S. N. Yaliraki, and M. Barahona, Stability of graph communities across time scales (Mar., 2009). URL http://arxiv.org/abs/0812.1811v4.
- 17. J.-C. Delvenne, M. T. Schaub, S. N. Yaliraki, and M. Barahona. The stability of a graph partition: A dynamics-based framework for community detection. In Dynamics On and Of Complex Networks, Volume 2, pp. 221–242. Springer (2013).
- 18. R. Lambiotte, J.-C. Delvenne, and M. Barahona, Random walks, markov processes and the multiscale modular organization of complex networks, Network Science and Engineering, IEEE Transactions on. 1(2), 76–90 (2014).
- 19. R. Lambiotte, J. C. Delvenne, and M. Barahona, Laplacian dynamics and multiscale modular structure in networks (Dec., 2008). URL http://arxiv.org/abs/0812.1770.
- 20. M. Beguerisse-Díaz, B. Vangelov, and M. Barahona. Finding role communities in directed networks using role-based similarity, markov stability and the relaxed minimum spanning tree. In IEEE Global Conference on Signal and Information Processing, GlobalSIP 2013, Austin, TX, USA, December 3-5, 2013, pp. 937–940 (2013). 10.1109/GlobalSIP.2013.6737046. URL http://dx.doi.org/10.1109/GlobalSIP.2013.6737046.
- 21. K. Cooper and M. Barahona. Role-based similarity in directed networks. URL http://arxiv.org/abs/1012.2726 (Dec. , 2010).
- 22. M. Beguerisse-Díaz, G. Garduño-Hernández, B. Vangelov, S. N. Yaliraki, and M. Barahona, Interest communities and flow roles in directed networks: the twitter network of the uk riots, Journal of The Royal Society Interface. 11(101), 20140940 (2014).
- 23. S. Vuik, B. Amor, R. Callahan, S. Yaliraki, M. Barahona, and A. Darzi, Understanding communities on twitter to better target policy communications, Submitted (2015).
- 24. M. E. Newman, Modularity and community structure in networks, Proceedings of the National Academy of Sciences. 103(23), 8577–8582 (2006).
- 25. S. Fortunato and M. Barthélemy, Resolution limit in community detection, Proceedings of the National Academy of Sciences. 104(1), 36–41 (2007).
- 26. M. T. Schaub, J.-C. Delvenne, S. N. Yaliraki, and M. Barahona, Markov dynamics as a zooming lens for multiscale community detection: non clique-like communities and the field-of-view limit, PloS one. 7(2), e32210 (2012).
- 27. M. T. Schaub, R. Lambiotte, and M. Barahona, Encoding dynamics for multiscale community detection: Markov time sweeping for the map equation, Physical Review E. 86(2), 026112 (2012).
- 28. E. A. Leicht and M. E. Newman, Community structure in directed networks, Physical review letters. 100(11), 118703 (2008).
- 29. Y. Kim, S.-W. Son, and H. Jeong, Finding communities in directed networks, Physical Review E. 81(1), 016103 (2010).
- 30. M. Rosvall and C. T. Bergstrom, An information-theoretic framework for resolving community structure in complex networks, Proceedings of the National Academy of Sciences. 104(18), 7327–7331 (2007).
- 31. P. Pons and M. Latapy, Computing communities in large networks using random walks., J. Graph Algorithms Appl. 10(2), 191–218 (2006).
- 32. U. Brandes, D. Delling, M. Gaertler, R. Gorke, M. Hoefer, Z. Nikoloski, and D. Wagner, On modularity clustering, Knowledge and Data Engineering, IEEE Transactions on. 20(2), 172–188 (2008).
- 33. V. D. Blondel, J.-L. Guillaume, R. Lambiotte, and E. Lefebvre, Fast unfolding of communities in large networks, Journal of Statistical Mechanics: Theory and Experiment. 2008(10), P10008 (2008).
- 34. M. Meilă, Comparing clusterings - an information based distance, Journal of Multivariate Analysis. 98(5), 873–895 (2007).
- 35. K. Cooper. Complex networks: similarity and dynamics. PhD thesis, Imperial College London (2010).
- 36. B. Vangelov. Unravelling Biological Processes using Graph Theoretical Algorithms and Probabilistic Models. PhD thesis, Imperial College London (2014).
- 37. M. Thelwall, K. Buckley, and G. Paltoglou, Sentiment in twitter events, Journal of the American Society for Information Science and Technology. 62(2), 406–418 (2011).
Index
- asymmetry §1, §4
- bridgeness §4
- care.data programme §1
- community detection §1
- conversation communities §6
- directed §1, §1, §1, §1, §1
- discussion topics §6
- flow profile vector §1
- follower graph §4, §1
- follower list §2
- Louvain algorithm §1
- Markov stability §1
- personal profiles §1
- random walk §1
- relaxed minimum spanning tree §3, §2
- retweet graph §4, §6
- role-based similarity §3
- sentiment analysis §3
- structural quality function §2
- teleportation §1
- transition matrix §1
- variation of information §1