X-ray outbursts of ESO 243-49 HLX-1: comparison with Galactic low-mass X-ray binary transients
Abstract
We studied the outburst properties of the hyper-luminous X-ray source ESO 243-49 HLX-1, using the full set of Swift monitoring observations. We quantified the increase in the waiting time, recurrence time, and -folding rise timescale along the outburst sequence, and the corresponding decrease in outburst duration, total radiated energy, and -folding decay timescale, which confirms previous findings. HLX-1 spends less and less time in outburst and more and more time in quiescence, but its peak luminosity remains approximately constant. We compared the HLX-1 outburst properties with those of bright Galactic low-mass X-ray binary transients (LMXBTs). Our spectral analysis strengthens the similarity between state transitions in HLX-1 and those in Galactic LMXBTs. We also found that HLX-1 follows the nearly linear correlations between the hard-to-soft state transition luminosity and the peak luminosity, and between the rate of change of X-ray luminosity during the rise phase and the peak luminosity, which indicates that the occurrence of the hard-to-soft state transition of HLX-1 is similar to those of Galactic LMXBTs during outbursts. We found that HLX-1 does not follow the correlations between total radiated energy and peak luminosity, and between total radiated energy and -folding rise/decay timescales we had previously identified in Galactic LMXBTs. HLX-1 would follow those correlations if the distance were several hundreds of kiloparsecs. However, invoking a much closer distance for HLX-1 is not a viable solution to this problem, as it introduces other, more serious inconsistencies with the observations.
Subject headings:
accretion, accretion disks — black hole physics —X-rays:binaries — X-rays: individual (HLX-1)1. INTRODUCTION
HLX-1 is the most luminous ultraluminous X-ray source (ULX; Feng & Soria, 2011, for a review) known with a maximum isotropic X-ray luminosity of (Farrell et al., 2009; Godet et al., 2009). The extremely high luminosity makes HLX-1 currently the best candidate to harbor an intermediate-mass black hole (IMBH, 102–105 M☉) among ULXs. Although other ULXs in nearby galaxies were initially flagged as candidate IMBHs, recent works show that some of them contain a stellar-mass black hole (BH; Liu et al., 2013; Motch et al., 2014) or even a neutron star (NS; Bachetti et al., 2014). HLX-1 is projected in the sky within the D25 (the diameter of the light isophote having a surface brightness of 25.0 mag arcsec-2) of the S0a spiral galaxy ESO 243-49 (redshift distance 95 Mpc), north-east of its nucleus (Farrell et al., 2009). The redshift measurement of the H emission line from the optical counterpart of HLX-1 confirmed the association of HLX-1 with ESO 243-49 (Wiersema et al., 2010; Soria et al., 2013). However, there is an offset of 430 km s-1 between the recession velocity of HLX-1 and that of the nucleus of ESO 243-49: this suggests that HLX-1 may be in a dwarf satellite galaxy or star cluster near ESO 243-49 rather than in the galaxy itself (Soria et al., 2013).
Monitoring observations of HLX-1 with Swift/XRT have shown that the source undergoes recurrent outbursts (almost once a year), where the outburst profiles are well described by a fast-rise-exponential-decay (FRED) form (see also Lasota et al., 2011; Godet et al., 2014), similar to the outbursts of many bright Galactic low-mass X-ray binary transients (LMXBTs; see Chen et al., 1997; Yan & Yu, 2015). During its outbursts, HLX-1 displayed spectral state transitions which also resemble those of the bright Galactic LMXBTs (Godet et al., 2009; Servillat et al., 2011). Webb et al. (2012) have detected transient radio emission following the hard-to-soft state transition during the 2010 and 2011 outbursts. By analogy with the radio flares seen in Galactic BH LMXBs (Fender et al., 2004), the transient radio emission was interpreted as discrete jet ejection events during the state transitions (Webb et al., 2012).
It is generally believed that the outbursts of bright Galactic LMXBTs are triggered by the thermal-viscous disk instability (Lasota, 2001, for a review). In this model, the outburst duration is approximately the viscous timescale at the minimum unstable disk radius, which is the radius at which the irradiated disk becomes cold enough to be dominated by neutral hydrogen. If HLX-1 is located at 95 Mpc, then its maximum luminosity, erg s-1, implies a viscous timescale 100 years (see Lasota et al., 2011, 2015, assuming that the disk is large enough to allow for a neutral outer region). However, the observed outburst duration of HLX-1 is 100 days, i.e., at least 2 orders of magnitude shorter than needed, therefore suggesting that the outbursts are triggered from a much smaller radius than required by the thermal-viscous disk instability model. Clearly, another mechanism is probably needed to trigger the outbursts. For example, Lasota et al. (2011) proposed that outbursts are triggered by the passage at periapse of the companion star on an eccentric orbit. However, this model cannot easily explain why the outburst repeats at irregular intervals (between 370 and 460 days: Kong 2011; Lasota et al. 2011; Godet et al. 2013, 2014, 2015; Miller et al. 2014; Kong et al. 2015). Based on the observed decline of the peak count rate, integrated luminosity, duration, and decay time over the sequence of outbursts, it was also suggested that the donor star may be undergoing tidal disruption (Godet et al., 2013, 2014; Miller et al., 2014). Miller et al. (2014) proposed an alternative model based on (low-angular-momentum) wind accretion instead of Roche lobe overflow. King & Lasota (2014) suggested that HLX-1 may be a stellar-mass binary system like SS 433 (see also Lasota et al., 2015), in which the X-ray emission comes from the beamed jet. None of those scenarios appear to be fully consistent with all the observational constraints, and there is still no general consensus on what causes the outbursts.
In previous work (Yan & Yu, 2015), we have systematically studied the outburst properties of bright Galactic LMXBTs, quantifying statistical correlations between observable quantities and comparing them with the predictions of the thermal-viscous disk instability model. In order to understand the nature of HLX-1 outbursts, in this paper, we use the same parameters as used by Yan & Yu (2015) to quantify the outburst properties of HLX-1, how they changed from outburst to outburst, and how they compare with the observed properties of bright Galactic LMXBTs outbursts.
2. DATA ANALYSIS AND RESULTS
2.1. Different Spectral States
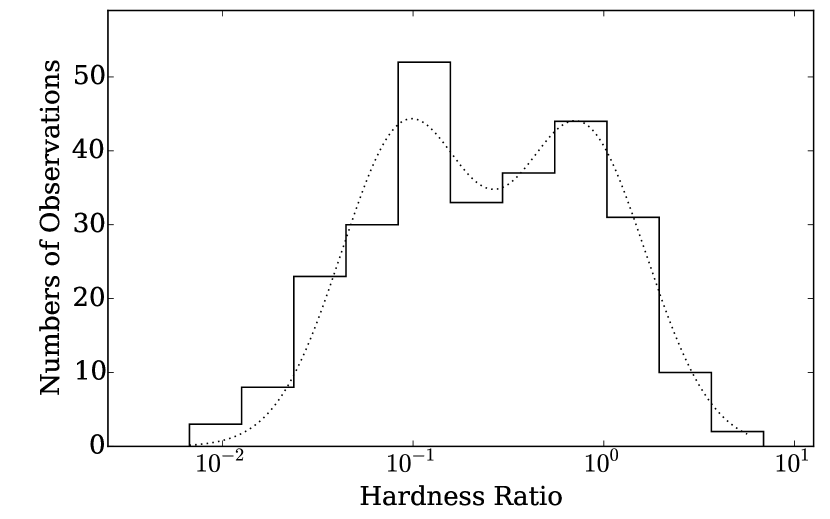
The Swift X-Ray Telescope (XRT) has monitored HLX-1 regularly for more than six years, providing us with an opportunity to investigate the X-ray temporal and spectral variability of this source. We obtained the – keV count rate and the (1.5–10 keV)/(0.3–1.5 keV) hardness ratio (HR) of each Swift/XRT observation from the online Swift/XRT product generator (Evans et al., 2007, 2009). We plotted the HR distribution from all observations with positive HR (Figure 1): it shows two peaks, suggesting that HLX-1 has two distinct spectral states (hard state and soft state) by analogy with Galactic X-ray binaries (XRBs; Yu & Yan, 2009; Yan & Yu, 2010). The presence of different spectral states in HLX-1 was first noted by Godet et al. (2009) and was also investigated by Servillat et al. (2011). We used the double-peaked HR distribution to define the hard and soft states: we fitted the histogram with two Gaussian components (Figure 1) and found that the centroids are roughly at HR and HR . We classify all the observations with HR as in the soft state, and all those with HR as in the hard state. The observations corresponding to consist of a mixture of soft, hard and perhaps intermediate states: we classify those observations as the transitional state.
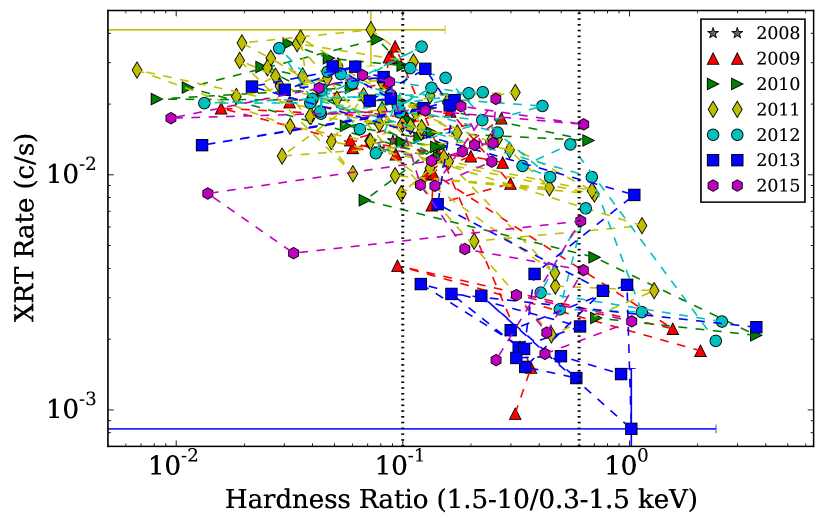
Hardnessintensity diagrams (HIDs) are a very useful tool to characterize the different spectral states in Galactic LMXBs (e.g. Miyamoto et al., 1995; Homan et al., 2001; Maccarone & Coppi, 2003; Kording et al., 2008; Belloni, 2010). In Figure 2 we plot the HID of all HLX-1 outbursts. The diagram clearly shows two clusters of data points, corresponding to the high/soft and low/hard state. In each outburst, HLX-1 evolved from the hard state to the soft state during the rise phase and then returned to the hard state during the decay phase. This behavior is similar to most outbursts of Galactic LMXBTs (e.g. Homan et al., 2001; Belloni et al., 2006; Belloni, 2010; Dunn et al., 2010; Muñoz-Darias et al., 2014).
| Spectral States | (keV) | /dof | |||
|---|---|---|---|---|---|
| Hard State | 1.60 | 67.27/104 (C-statistic) | |||
| Transitional State | 25.60 | 2.45 | 3.62 | 38.26/52 | |
| Soft State | 0.20 | 81.52/82 |
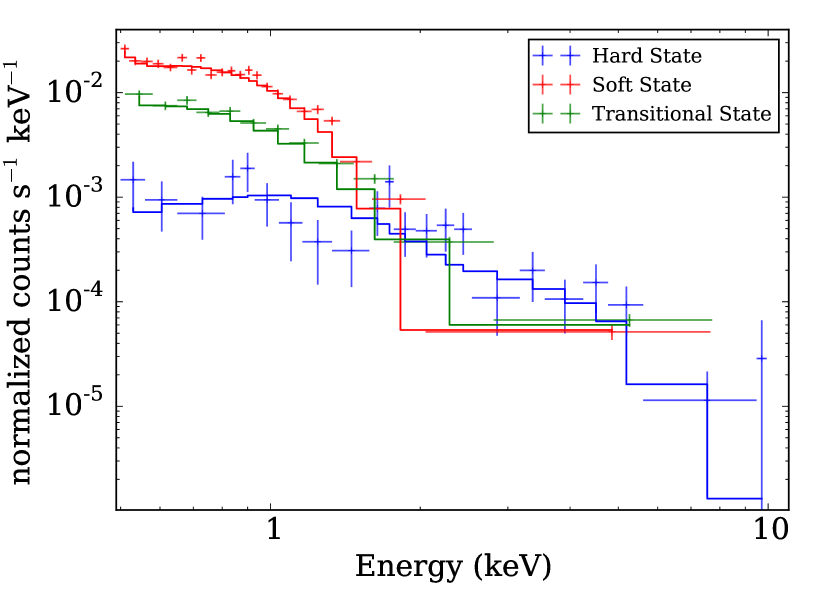
We extracted stacked spectra of the Swift/XRT observations in each of the three states (Figure 3), using the online XRT product generator (Evans et al., 2009), which also provides the associated background and response files. We only included observations with detection significance . We analyzed and modeled the spectra with XSPEC Version 12.8.2 (Arnaud, 1996). Because of the low count rate, we grouped the spectrum of the hard state to at least 1 count bin-1, and applied the Cash statistics (Cash, 1979), and grouped the spectra of the transitional and soft sates to at least 20 counts bin-1, so that we could use statistics. We ignored photon energies below 0.5 keV. We have tried to free the column density, but it can only be well constrained by the spectrum of the soft sate at a value of cm-2, which is consistent with the value used before (Farrell et al., 2009; Webb et al., 2010, 2012). Therefore, we fixed the column density at the line-of-sight value cm-2 for all the three spectra.
The stacked spectrum of the hard state is well fit by a single power-law model with photon index (Table 1), similar to the typical values found in the hard state of LMXBs. The stacked spectrum in the soft state is fit by a disk-blackbody model plus a power-law component that accounts for significant residual emission above 2 keV. The disk contributes 85% of the 0.3–10 keV flux, similar to the situation in the disk-dominated soft state of BH LMXBs. The peak color temperature in the soft state is 0.2 keV (Table 1), which is much less than the typical value in luminous BH LMXBs ( keV). The corresponding inner-disk radius – km for a plausible range (10∘–80∘) of disk inclination angles, at a distance of 95 Mpc. The low color temperature and large radius of the thermal emitter are consistent with a disk around an IMBH (Godet et al., 2009; Davis et al., 2011; Servillat et al., 2011). However, the thermal X-ray emission components with cool temperatures and large radii are also seen in ultraluminous supersoft sources where the emission is probably coming from the photosphere of a thick outflow rather than from a disk (Poutanen et al., 2007; Shen et al., 2015), and therefore do not require an IMBH as the accreting object (e.g. the supersoft ULX in M 101 is probably powered by a stellar-mass BH, Liu et al., 2013). Finally, the stacked spectra of HLX-1 in the transitional state are well fit by a disk-blackbody ( keV) plus power-law () model (Table 1), where the disk emission accounts for 52% of the 0.3–10 keV flux. The disk normalization is similar to the soft state (Table 1), which is consistent with a disk extending down to the inner-most stable circular orbit (ISCO).
2.2. State Transition Luminosity
According to our definition of the three spectral states, the mean XRT count rates are 0.022 ct s-1, 0.005 ct s-1 and 0.012 ct s-1 for the soft, hard and transitional states, respectively. Based on our spectral fitting results (Table 1), the unabsorbed 0.3–10 keV fluxes corresponding to an XRT count rate of 1 ct s-1 are erg s-1 cm-2 in the soft state, erg s-1 cm-2 in the hard state, and erg s-1 cm-2 in the transitional state. For each observation, we used the hardness ratio to identify the spectral state, then converted the count rate to an unabsorbed flux by using the appropriate conversion factor. The Swift/XRT light curve in units of erg s-1 cm -2 is shown in Figure 4.
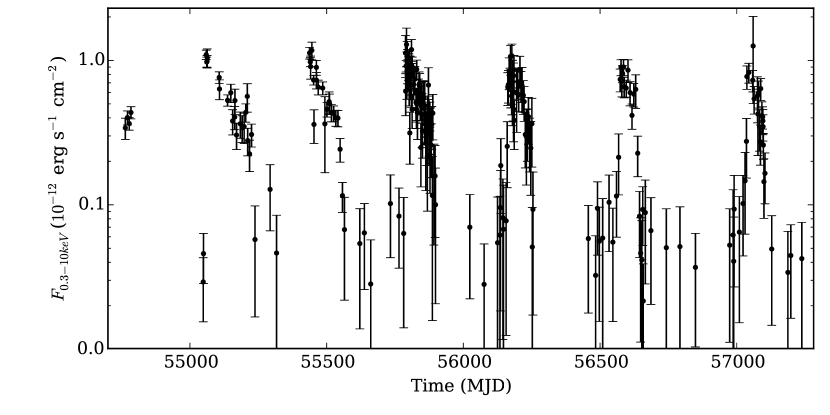
The Swift observations have so far covered seven outbursts of HLX-1, plus only a few data points for an outburst in 2008 (Figure 4); we exclude those 2008 data points in the rest of this paper. We determined the luminosity at the transition from hard to soft state during the outburst rise, and the luminosity at the reverse transition during the decay phase, using the same method previously applied by Yu & Yan (2009) to Galactic LMXBTs. In that method, we used the luminosity of the last hard state data point as the hard-to-soft state transition luminosity (Yu & Yan, 2009; Tang et al., 2011). However, it is much harder to catch the actual transition in the HLX-1 outbursts because the rise time is short compared with the Swift sampling frequency. Therefore, we note that we might be underestimating with our method. The Swift observations do not cover the hard-to-soft state transition in the 2009 and 2010 outbursts; for the other four outbursts, we list in Table 2. The first observation with HR during the decay phase was identified as the first hard state observation; we used the luminosity of this observation as the soft-to-hard state transition luminosity (Yu & Yan, 2009). We list the for six outbursts in Table 2.
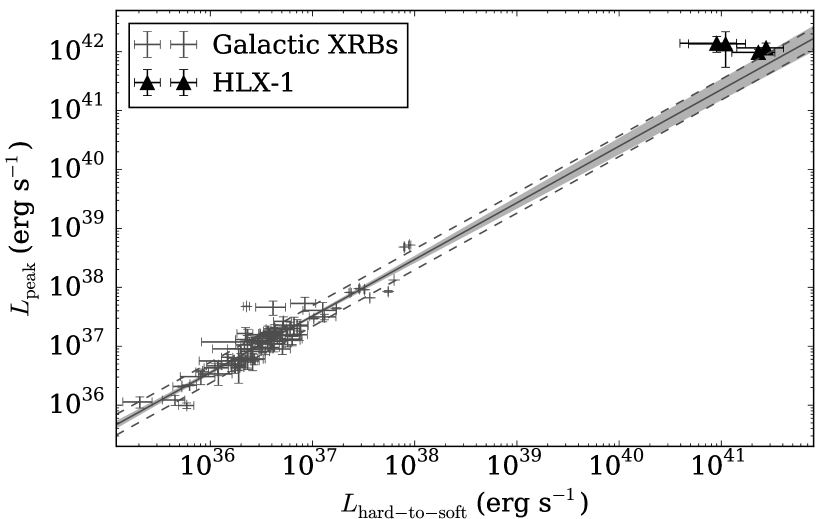
We had already found a correlation between the hard-to-soft state transition luminosity and the peak luminosity in Galactic XRBs (Yu et al., 2004; Yu & Dolence, 2007; Yu & Yan, 2009; Tang et al., 2011). We fit the correlation in Galactic XRBs with a function by using the Bayesian approach in Kelly (2007), and obtained a best-fitting slope of B = 0.960.04, which means that is linearly proportional to . Now we have added the values of and for the four HLX-1 outbursts (Figure 5). HLX-1 roughly follows this correlation we found in Galactic XRBs, which confirms the prediction that the correlation extends to ULXs (Yu & Yan, 2009).
| Outburst | ||
|---|---|---|
| (1041 erg s-1) | (1041 erg s-1) | |
| 2009 | ||
| 2010 | ||
| 2011 | ||
| 2012 | ||
| 2013 | ||
| 2015 |
2.3. Outburst Parameters
| Peak Time | Duration | aa Waiting time | bb Recurrence time defined as the interval between of an outburst and of the previous outburst | cc Recurrence time defined as the interval between of an outburst and of the previous outburst | dd Total radiated energy per outburst | |||||
|---|---|---|---|---|---|---|---|---|---|---|
| () | () | () | () | |||||||
| (MJD) | () | (days) | (days) | (days) | (days) | () | (days) | (days) | () | () |
| 55060 | 1.20.1 | 188 | 265 | 454 | 286 | 9.70.1 | 30 | 6216 | 11.30.9 | 0.60.1 |
| 55446 | 1.30.2 | 128 | 192 | 320 | 380 | 6.60.4 | 486 | 1.00.2 | ||
| 55792 | 1.40.4 | 110 | 224 | 334 | 352 | 5.90.2 | 21 | 5017 | 17.25.9 | 1.10.3 |
| 56178 | 1.20.2 | 96 | 264 | 360 | 375 | 4.80.2 | 62 | 258 | 7.01.5 | 1.40.3 |
| 56586 | 1.00.1 | 84 | 308 | 392 | 404 | 4.30.1 | 113 | 184 | 3.40.6 | 2.00.4 |
| 57060 | 1.40.8 | 69 | 386 | 455 | 470 | 3.70.1 | 145 | 186 | 4.12.8 | 3.02.1 |
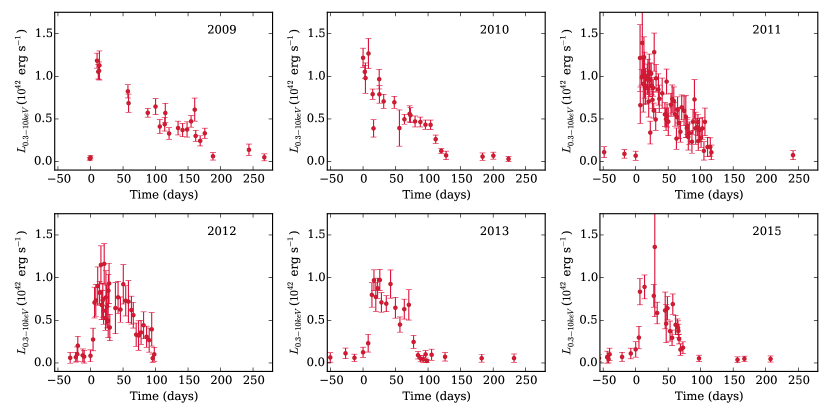
The shape of the X-ray light curves for the six HLX-1 outbursts with good Swift coverage are qualitatively similar. The 2009 and 2011 outbursts show the clearest FRED profiles (Figure 6), which is typical of Galactic LMXBTs outbursts (Chen et al., 1997). We only have flux upper limits for the early rise phase of the 2010 outburst, but they are also consistent with a FRED profile (Soria 2013, Fig. 1). The 2012, 2013, and 2015 outbursts are roughly consistent with FRED profiles, but also show secondary peaks or reflarings during the decline (Figure 6).
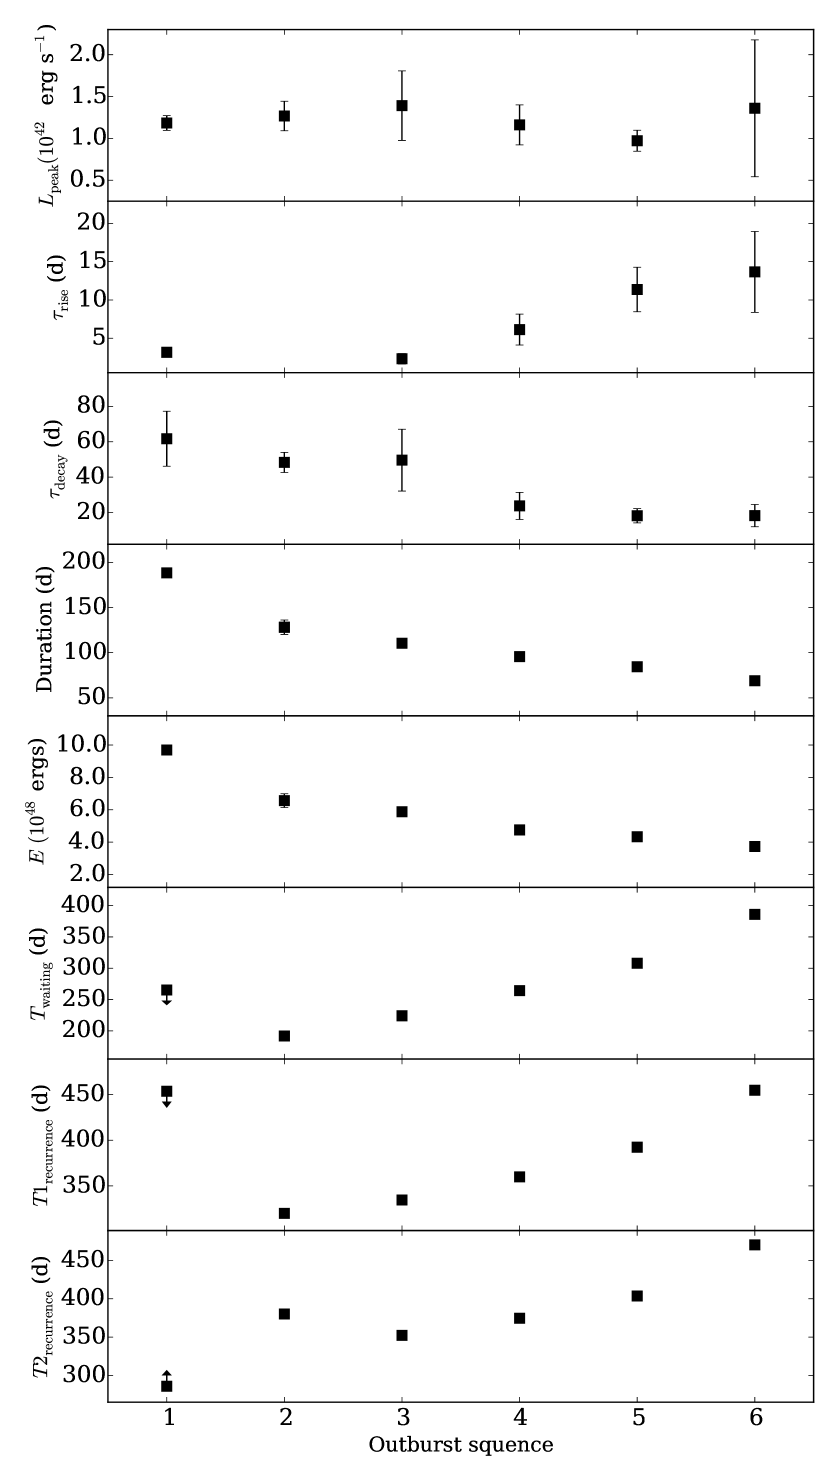
We measured the main outburst parameters for the six outbursts (Table 3, Figure 7), including peak luminosity, -folding rise and decay timescales, rate of change of the luminosity during the rise and decay, outburst duration, and total radiated energy, according to the definitions in Yan & Yu (2015). The peak luminosity is defined as the maximum luminosity in each outburst. We defined , , and as the measured data points closest to and of during the rise and decay phases, respectively. The -folding rise timescale is defined as , where is the time interval between the data points corresponding to and , and is the ratio of . The -folding decay timescale is defined in the same way, but for and . The rate of change of luminosity and are defined as for the rise phase and as for the decay phase, respectively. The outburst duration is defined as the time interval between and . We have two definitions of the recurrence time, one is the interval between of an outburst and of the previous outburst (abbreviated as ); the other is the interval between of an outburst and of the previous outburst (abbreviated as ). The total radiated energy is defined as the integrated luminosity from the time of to the time of (for this integration, the data gaps due to sparse coverage were filled with linear interpolations). Finally, we determined the waiting time for each outburst, defined as the time interval between of an outburst and of the previous outburst. For the outburst in 2009, we only have upper limits to the waiting time and and lower limits to the , because the data coverage of the 2008 outburst is too limited to permit the identification of the times of and .
The uncertainties in the outburst durations, waiting times, and recurrence times are mainly due to the Swift/XRT observation sampling frequency. The typical interval of observations in different outbursts is in the range of 1–14 days. For example, for the 2010 outburst we are not able to identify (Figure 6); therefore, we cannot calculate the and . Instead, we use the earliest significant detection (Figure 6) as to estimate lower limits to the duration, total radiated energy, and waiting time of the 2010 outburst. The observation before the earliest significant detection is only an upper limit: by taking that value as , we estimated upper limits to the duration, total radiated energy, and waiting time (Table 3).
Our main findings are the following.
-
1.
There is no clear trend for the peak luminosity with outburst sequence, probably because it is well constrained in the range of 1.0–1.4 (Figure 7, Table 3). The value and uncertainty of the peak luminosity of the 2015 outburst is quite large, which could be due to the short-term variability, since the exposure time of this observation is short. Godet et al. (2013, 2014) argued that the peak count rate decreases with outburst sequence, but we did not find such a trend in the peak luminosity. There may be two reasons for this discrepant conclusion. Firstly, our light curve was rebinned by observation, while Godet et al. (2013, 2014) rebinned theirs by photon count (20 counts per bin): as a result, the peak values are slightly different. Secondly, our light curve is in flux rather than count rate units: the conversion factor is different depending on whether the peak of the outburst was reached during the transitional or soft state.
-
2.
The -folding rise timescale increases at least since the 2011 outburst.
-
3.
The -folding decay timescale decreases, which confirms the result in Miller et al. (2014).
- 4.
-
5.
The total radiated energy decreases along the outburst sequence, which confirms the result in Miller et al. (2014), from erg in the 2009 outburst to erg in the 2015 outburst (Figure 7 and Table 3). This corresponds to a mass transfer of in the 2009 outburst, down to in the 2015 outburst (assuming a standard efficiency 0.1).
- 6.
-
7.
The recurrence time increases along the outburst sequence, from 320 days of the 2010 outburst to 455 days of the 2015 outburst for , and from 352 days of the 2011 outburst to 470 days of the 2015 outburst for (Figure 7, Table 3). The increase of the recurrence time creates serious problems for its original and simplest interpretation as the binary period. Therefore, Godet et al. (2014) tried to resolve this problem by considering a binary system with extreme parameters, and they predicted an increase of the binary period in such system, which is consistent with the increase of recurrence time (Godet et al., 2015).
-
8.
The duty cycle (defined as the fraction of time spent in outbursts) is 0.3.
2.4. Comparison of Outburst Properties with Bright Galactic LMXBTs
The comparison between the outburst properties of HLX-1 and those we determined previously for bright Galactic LMXBTs (Yan & Yu, 2015) can be summarized as follows.
-
1.
The average peak luminosity of HLX-1 ( erg s-1) is more than four orders of magnitude larger than the average peak luminosity of bright Galactic LMXBTs ( erg s-1 and erg s-1 for BH and NS LMXBTs, respectively).
-
2.
The average total radiated energy per outburst of HLX-1 ( erg) is about five orders of magnitude larger than those measured in bright Galactic LMXBTs ( erg and erg for BH and NS LMXBTs, respectively).
-
3.
The average outburst duration of HLX-1 ( 113 days) is about a factor of 3 longer than that of the NS LMXBTs outbursts ( 39 days), and is a little bit longer than the average outburst duration of BH LMXBTs ( 88 days), but still within the range of BH LMXBTs.
-
4.
The average -folding rise timescale of HLX-1 (7 days) is about two times larger than the Galactic NS LMXBTs (4 days), and is similar to the Galactic BH LMXBTs (8 days).
-
5.
The average -folding decay timescale of HLX-1 (37 days) is a few times longer than for Galactic NS LMXBTs (average of 11 days) and BH LMXBTs (average of 26 days), but still within the range of values measured for BH LMXBTs.
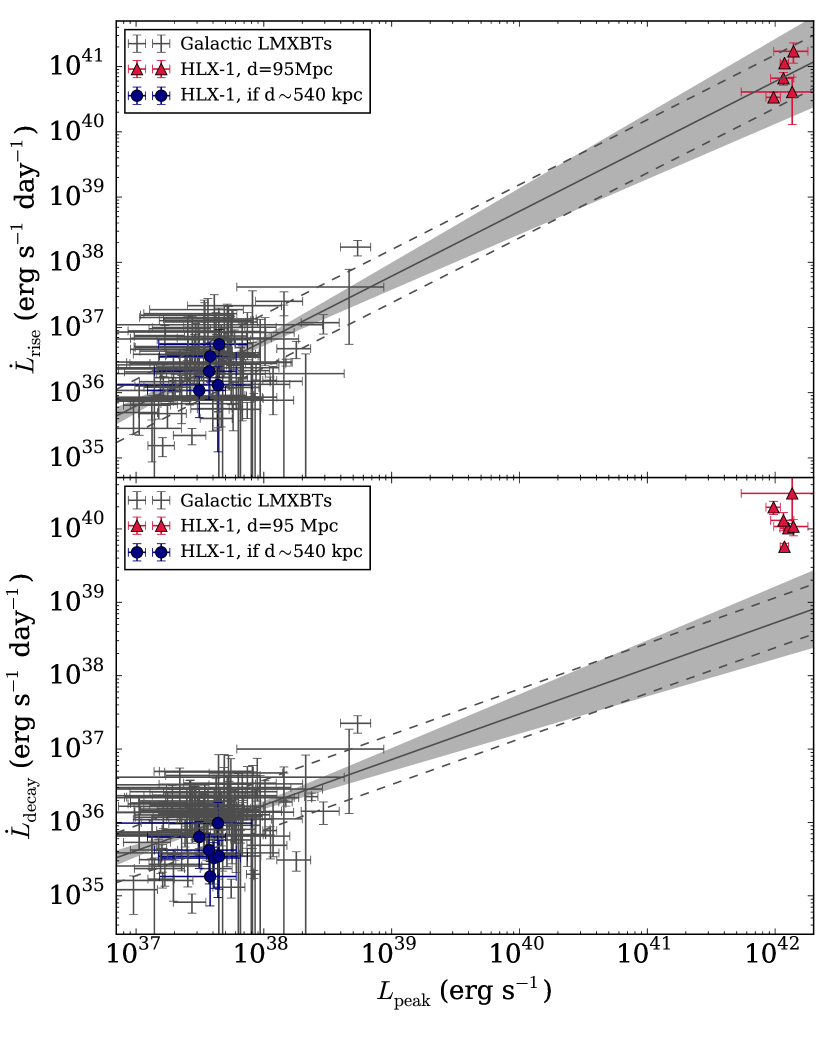
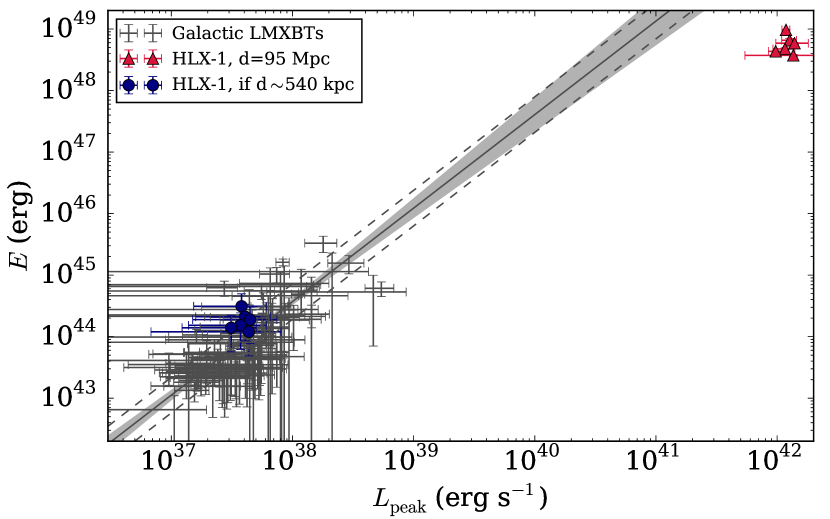
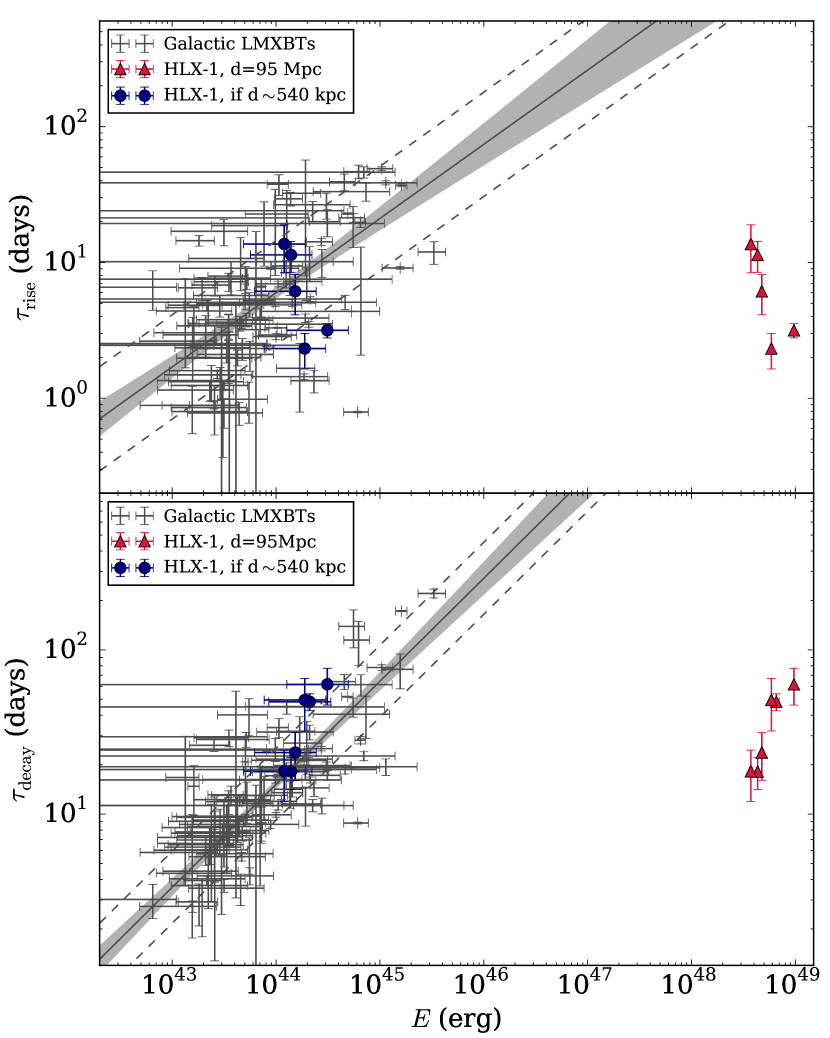
Positive correlations have been found between the rate of change of luminosity and the peak luminosity in both the rise and decay phases, for Galactic LMXBTs (Yan & Yu, 2015). Using a Bayesian linear regression (Kelly, 2007), we had found that with , and with . We extrapolated those empirical relations to see whether HLX-1 is also consistent with them (Figure 8). We found that HLX-1 follows the correlation between and , but not the one between and (i.e., its decay timescale is too short to be a scaled-up LMXBT; see also Lasota et al., 2015). Other correlations found in Galactic LMXBTs are those between the total radiated energy and peak luminosity, and those between the -folding rise/decay timescales and total radiated energy; none of those relations is satisfied by HLX-1 (Figure 9 and Figure 10). (Probably only by coincidence, HLX-1 would satisfy those Galactic LMXBTs correlations if it were located at a distance of 540 kpc, which is inconsistent with its optical line redshift and is implausible based on other arguments, see Section 3.3.).
2.5. Comparison with BH LMXBT H1743322
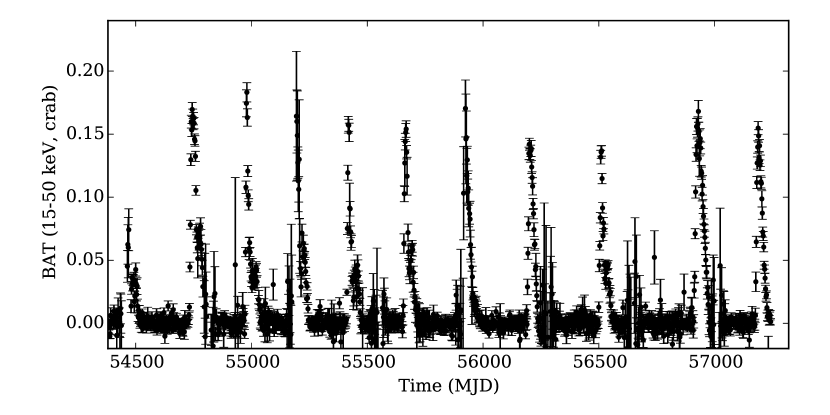
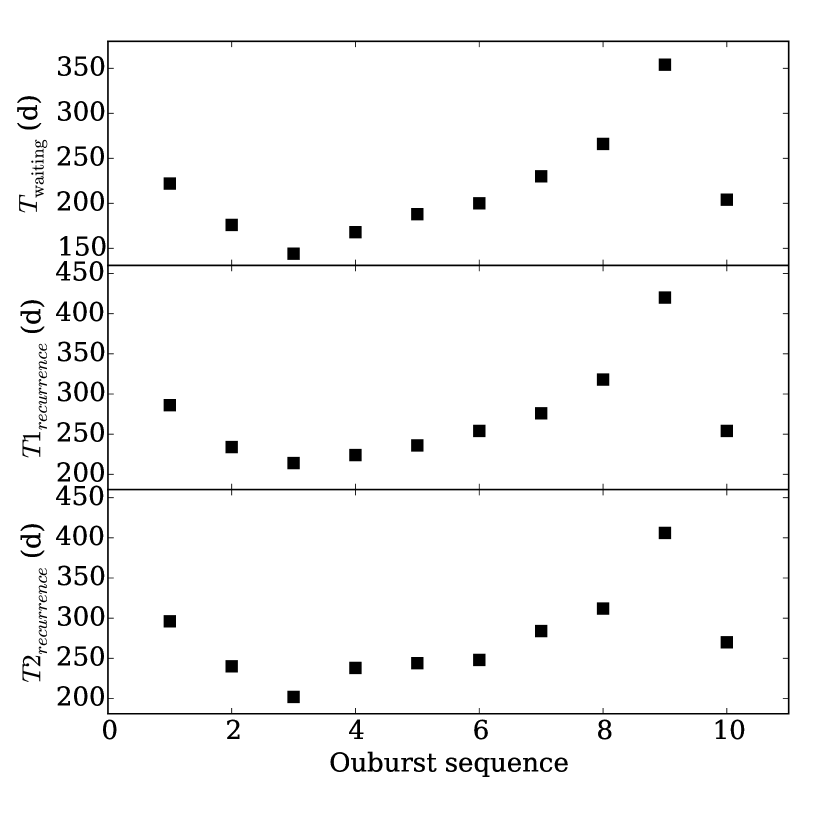
In addition to comparing the outburst properties of HLX-1 with the average outburst properties of bright Galactic LMXBTs (Section 2.4), we compare HLX-1 with some individual systems which undergo regular outbursts. For example, the BH LMXBT H1743322 has been in outburst nearly once a year for the last 10 years (Figure 11), as shown by the Swift/BAT light curve (Krimm et al., 2013). We used that light curve to quantify the outburst properties of H1743322, and investigate its similarities with HLX-1. We only considered those outbursts with a peak count rate larger than 0.1 crab at a significance level; this means all outbursts after MJD 54700 (i.e., after 2008 August). We used the same method described in Section 2.3 to measure the outburst parameters. The outbursts occur quite regularly with an average recurrence time of days, which is very similar to that of HLX-1 (Figure 4). We found that the waiting time and recurrence time first decrease and then increase (see Figure 12), possibly consistent with the behavior of HLX-1 (bottom panels of Figure 7). However, the waiting time and recurrence time suddenly decrease to the average level in the latest 2015 outburst Figure 12. Instead, we did not find any clear trend in the outburst duration, fluence, peak flux, and -folding rise and decay timescales versus outburst sequence.
We repeated the outburst analysis for H1743322 using RXTE/ASM and MAXI data (2–10 keV; Matsuoka et al., 2009). We obtained similar values for the waiting and recurrence times; this shows that such parameters are not significantly affected by the choice of energy band. We do not have enough evidence at this stage to test whether or not the possible similarity in the outburst waiting and recurrence times between HLX-1 and H1743322 points to the same physical mechanism for outburst triggering and evolution.
For completeness, we also performed a similar comparison between the BH LMXBT GX 3394, 4U 1630, the NS LMXBT Aql X-1 (using /ASM+MAXI data), and HLX-1. These three LMXBTs also show frequent outbursts. However, for GX 3394 and 4U 1630, we do not find any clear trends when using data from their past 5 outbursts and 10 outbursts, nor we find that for Aql X-1 when using data from its past 14 outbursts.
3. DISCUSSION
3.1. BH Mass Estimation Based on
In Galactic XRBs, the transition luminosity from the soft to the hard state during the decay phase spans a very narrow range of values 1%–4% (Maccarone, 2003; Kalemci et al., 2013). The average soft-to-hard state transition luminosities of HLX-1 is erg s-1 in the 0.3–10 keV band, with a standard deviation of erg s-1. We used the same bolometric correction in Maccarone (2003) to convert from 0.3–10 keV to bolometric luminosity. If the soft-to-hard state transition luminosity of HLX-1 is at by analogy to the Galactic XRBs, the mass of the accreting compact object is . This is consistent with the IMBH mass of – derived from detailed X-ray spectral modelling (Farrell et al., 2010; Davis et al., 2011; Servillat et al., 2011; Godet et al., 2012; Webb et al., 2012).
3.2. Sub-Eddington State Transitions or Super-Eddington Geometric Beaming?
The crucial unsolved problem is whether the spectral state evolution supports the sub-Eddington IMBH scenario or the super-Eddington stellar-mass BH scenario. We address this question in two steps: firstly, we test whether our results are consistent with an IMBH, second, we discuss whether the super-Eddington scenario provides a more plausible explanation.
Our spectral analysis confirmed that HLX-1 exhibits two distinct X-ray spectral states: the low/hard and high/soft states (Godet et al., 2009; Servillat et al., 2011). In each outburst, HLX-1 evolved from the hard state to the soft state during the rise phase and then returned to the hard state during the decay phase (Figure 2). This spectral state evolution is similar to that of Galactic XRBs. HLX-1 follows the correlation between the hard-to-soft transition luminosity and the outburst peak luminosity which we have found in Galactic XRBs (Figure 5). This correlation, which spans six orders of magnitude, strongly suggests that the same mechanism determines the hard-to-soft state transition luminosity during an outburst for both Galactic XRBs and HLX-1. The X-ray spectrum in the hard state of HLX-1 is dominated by a power-law component with a photon index of 1.6 (Table 1), which is similar to that of Galactic XRBs in the hard state. The X-ray spectrum in the soft state is dominated by a thermal component (Table 1), which is also similar to that of the soft state of Galactic XRBs but with lower temperature and larger radius, as expected for an IMBH. The luminosity and peak color temperature of HLX-1 in the soft state roughly follow the correlation, consistent with the prediction of the standard disk model and with what is observed in stellar-mass XRBs (Servillat et al., 2011). In addition, the larger radius and lower temperature (compared with stellar-mass XRBs) are self-consistent with each other and with the increase in luminosity: that is, both scale as expected for a standard disk when the BH mass is increased by a factor of 1000 to explain the correspondingly higher luminosity of the soft state. We conclude that all spectral evidence is consistent with the standard disk scenario, that is, with sub-Eddington, not strongly beamed emission, in which case HLX-1 must be an IMBH.
Disk emission is not the only way to produce a thermal X-ray spectrum. Optically thick outflows caused by super-Eddington accretion may also produce a quasi-thermal X-ray spectrum with a low temperature and large radius, and high apparent (non-isotropic) luminosity if observed face-on (King & Pounds, 2003; Begelman et al., 2006; Fabrika et al., 2007; Poutanen et al., 2007; King, 2009). The reason for this is that an optically thick outflow downscatters photons and lets them escape only through a collimating funnel along the polar axis (geometric beaming). The beaming factor in the apparent luminosity (, where is the intrinsic luminosity) for a face-on observer depends on the opening angle of the funnel: for a small angle, . Following the model of King (2009), and therefore rad, where . The intrinsic luminosity for a super-Eddington accretor scales as (Shakura & Sunyaev, 1973; Poutanen et al., 2007). Combining the two factors, a face-on observer would measure an apparent luminosity . Thus, if the beaming scale holds, a stellar-mass BH with accreting at would be seen at erg s-1 by an observer looking down the collimating funnel (King & Lasota, 2014; Lasota et al., 2015). There is no physical reason preventing from reaching values 100 or even much higher (Wiktorowicz et al., 2015). The question is whether the opening angle of the funnel continues to scale as at such high accretion rates. In the model of King (2009), corresponds to a funnel opening angle . This is narrower than the opening angle predicted by MHD simulations for comparably high accretion rates: for example, it is in Ohsuga & Mineshige (2011) and in Jiang et al. (2014). Those simulations suggest that at the highest accretion rates, the opening angle and the geometric beaming factor have a weaker dependence on or reach an asymptotic value. In addition, when Compton downscattering is also properly accounted for, the luminosity of the photons emerging from the collimating funnel is less than expected simply from the beaming factor (that is, a larger part of the intrinsic luminosity is transferred to cooler electrons in the outflow). As a result, the models of Ohsuga & Mineshige (2011) predict that the geometrically beamed apparent luminosity may reach only ; Kawashima et al. (2012) predict peak apparent luminosities erg s-1 from a 10 BH. Both values are much less than required to explain the high state of HLX-1. Therefore, we argue that the possibility of reaching apparent luminosities erg s-1 via geometric beaming of a super-Eddington stellar-mass BH is not ruled out but appears unlikely based on the MHD simulations (e.g. Ohsuga & Mineshige, 2011; Kawashima et al., 2012; Jiang et al., 2014), and has never been observationally proven in any real system, either.
A second difficulty of the hyper-accretion scenario is that the spectra of the photon emission predicted to emerge from the funnel (Kawashima et al., 2012), at least for accretion rates up to , do not look like the 0.2 keV thermal emission seen in HLX-1. It is true that the emerging spectrum is predicted to soften at higher accretion rates, but it retains a dominant Comptonized component up to keV, with a roll-over at energies of keV (Figures 2 and 4 in Kawashima et al., 2012), similar to the spectrum seen in “normal” ULXs (making them perfectly consistent with the super-Eddington scenario). To our knowledge, so far, simulations have not explored what happens to the spectrum at . Moreover, neither analytic slim-disk models (e.g. Watarai et al., 2001) nor MHD simulations (e.g. Kawashima et al., 2012) predict a spectral state transition between a hard, power-law-like, moderately super-Eddington state, and a purely thermal, extremely super-Eddington regime, as would be the case in HLX-1. (Recall that if we interpret the high/soft state of HLX-1 as due to geometric beaming at , then the low/hard state would also be super-Eddington, with .) Again, there is no physical argument ruling out this possibility, but it has never been observed in real systems or predicted in simulations.
Another clue comes from the brightness of the optical counterpart, in particular, for its near-UV and blue emission. Early suggestions that this emission was from a massive, young star cluster (Farrell et al., 2012) have been disproved after it was found that the optical emission varies substantially between high and low X-ray states (Webb et al., 2014). For example, in the near-UV and U bands, the optical flux is mag higher in outburst than in quiescence (R. Soria et al. 2015, in preparation). Thus, the most plausible interpretation is that at least the near-UV and blue emission are dominated by an irradiated accretion disk (Soria et al., 2012). The need for irradiation is crucial: a simple, non-irradiated Shakura-Sunyaev disk is too cold and dim to fit the observed optical/UV spectrum. The disk must intercept and reprocess an X-ray luminosity of a few times erg s-1 (Soria et al., 2012; Farrell et al., 2014). For any plausible solid angle subtended by the disk, this requires that the intrinsic X-ray luminosity in outburst be erg s-1, and that it be approximately isotropic. Very few irradiation effects on the disk would be expected if the observed X-ray flux emerged from a collimated funnel perpendicular to the disk plane and was confined by an optically thick outflow.
Taking into account all of the arguments and observational constraints outlined above, we conclude that at this stage, the sub-Eddington IMBH scenario with canonical state transitions similar to the Galactic XRBs is the least implausible model.
3.3. Disk Instability Model and Comparison with Galactic LMXBTs
One of the objectives of this work is to quantify to what degree HLX-1 outbursts are similar to Galactic LMXBTs outbursts. The outbursts of bright Galactic LMXBTs are usually modeled as thermal-viscous disk instabilities (Lasota, 2001, for a review). The correlation between the total radiated energy and the -folding rise or decay timescale, and between the total radiated energy and the peak luminosity, found in Galactic LMXBTs (Yan & Yu, 2015), are consistent with the predictions of this model. Instead, the -folding rise and decay timescales of HLX-1 are about two orders of magnitude smaller than the extrapolation of those correlations to a distance of 95 Mpc (Figure 10). This is consistent with the argument (Lasota et al., 2011, 2015) that the thermal-viscous disk instability model cannot explain the short outburst duration in HLX-1.
For the sake of argument, let us assume instead that we do not have any information on the distance to HLX-1, and let us try to constrain its distance according to the best-fitting results () of the – correlations in bright Galactic LMXBTs (Yan & Yu, 2015). We would obtain a distance of 540 kpc. Since the intrinsic scatters of those – correlations are quite large (0.4 dex), the uncertainty of the inferred distance can be up to a factor of 1.6. Other correlations we found in Galactic LMXBTs would be satisfied if HLX-1 were at a distance of 540 kpc (Figure 8, Figure 9 and Figure 10). With such a distance, we estimated the orbital period of HLX-1 (20 hr) according to the correlation between optical luminosity and X-ray luminosity and the orbital period found in Galactic LMXBs (van Paradijs & McClintock, 1994), where the V-band magnitude of HLX-1 near the 2012 outburst peak is from Webb et al. (2014), and we estimated the mass transfer rate according to the method in Coriat et al. (2012). The mass transfer rate and orbital period satisfy the criteria for a transient LMXB predicted by the thermal-viscous disk instability model (van Paradijs, 1996; Coriat et al., 2012). In other words, the temporal properties of the HLX-1 outbursts are consistent with those of a stellar-mass X-ray transient at several hundreds of kiloparsecs, which can be interpreted by the thermal-viscous disk instability model. Lasota et al. (2015) derived a relation between the peak luminosity and the decay timescale from the thermal-viscous disk instability model. According to the relation, the outbursts of HLX-1 with IMBH at 95 Mpc cannot be triggered by the thermal-viscous disk instability, and the thermal-viscous disk instability model requires a stellar-mass accretor at a distance of less than 1 Mpc.
This does not mean that HLX-1 is indistinguishable from a stellar-mass LMXBTs hypothetically located at that distance: other outburst properties of HLX-1 are very different. For example, the inner-disk temperature of HLX-1 in the soft state is 0.2 keV (a distance-independent measurement), empirically and theoretically inconsistent with the disk temperatures of Galactic LMXBTs in the same state ( keV). Moreover, the fitted inner-disk radius of HLX-1 at 95 Mpc is 50,000–100,000 km depending on inclination angle, BH spin, and other detailed disk model assumptions. If HLX-1 were at a distance of 540 kpc, then the fitted inner-disk radius would be 250–500 km. Once again, this value is inconsistent with the typical inner-disk radii of Galactic NS ( km) and BH LMXBTs (–100 km). It is still consistent with the inner-most stable orbit of more massive stellar BHs (–). However, if the BH were in such mass range, and HLX-1 was at 540 kpc, then its bolometric transition luminosity . This is inconsistent with the canonical state transition luminosity of BHs, for which – .
In summary, although the outburst timescales are surprisingly short for an IMBH at 95 Mpc (Lasota et al., 2011, 2015), and would instead indicate a stellar-mass source at 540 kpc, this is not a viable solution for HLX-1 because at that lower distance, its luminosity and peak temperature would no longer be self-consistent for the disk-dominated high/soft state. In addition, we do have other independent evidence that the distance to HLX-1 is 100 Mpc: an optical emission line consistent with H redshifted to km s-1, and its projected location in the sky in the middle of a cluster of galaxies at the same distance (Wiersema et al., 2010; Soria et al., 2013). Conversely, we have indirect evidence to disfavor a location at 540 kpc, because there are no known Local Group stellar structures (dwarf or satellite galaxies, or star clusters) in that direction of the sky at that distance from the Milky Way. Therefore, we conclude that the anomalously short outburst timescales indicate that either the outbursts of HLX-1 with IMBH are not triggered by the thermal-viscous disk instability, which is consistent with the conclusions in Lasota et al. (2011, 2015), or that the efficiency of the angular momentum transport in such a disk would have to be two orders of magnitude greater than in a standard disk, or that the circularization radius and outer radius of the accretion disk are two orders of magnitude smaller than naively estimated based on the size of the primary Roche lobe in a circular binary system.
3.4. Comparison with Galactic Transient Be/XRBs
High mass donor stars have been confirmed in some ULXs such as NGC 7793 P13 (Motch et al., 2011, 2014) and M101 ULX-1 (Liu, 2009; Liu et al., 2013). Therefore, it is also interesting to compare the temporal and spectral outburst properties of HLX-1 with those of Galactic transient high mass X-ray binaries (HMXBs). Be/XRBs are the most common type of transient HMXBs: they consist of a NS bound to a Be star in an eccentric orbit. This kind of systems usually shows two types of X-ray outbursts (Paul & Naik, 2011; Reig, 2011, for reviews). Type I outbursts are quasi-periodic, and likely triggered by the periastron passage of the NS. The amplitude of this type of outburst is smaller and the duration is shorter than for the HLX-1 outbursts; besides, we have already noted that the periastron-passage model for HLX-1 has serious difficulties. Type II outbursts usually show much larger amplitudes and longer durations, comparable with the outbursts of HLX-1. It has been suggested (Reig et al., 2006; Reig, 2008; Becker et al., 2012; Reig & Nespoli, 2013) that such outbursts include a transition between distinct accretion states. In an HID, transient HMXBs move between different states either along a horizontal branch, at low luminosities, or along a diagonal branch, at higher luminosities (Reig & Nespoli, 2013). On the diagonal branch, softer colors correspond to higher luminosities, as in Galactic LMXBTs and HLX-1. The physical mechanism is still unclear, but it is not due to a disk instability; more likely, it depends on how the accretion flow is decelerated in the accretion column, and therefore on the balance between the accretion rate and magnetic field of the accreting NS (Reig & Nespoli, 2013). As such, any phenomenological similarities between such outbursts and those of HLX-1 are most likely a coincidence.
4. CONCLUSIONS
We studied the X-ray outburst properties of HLX-1, using the full set of Swift/XRT monitoring observations available to-date, which cover six outbursts from 2009 to 2015 (plus a few sparse data points for the 2008 outburst). HIDs confirm the presence of spectral state transitions during the outbursts (Godet et al., 2009; Servillat et al., 2011), similar to the cycle of low/hard and high/soft states in Galactic XRBs. We found that HLX-1 follows the nearly linear correlation between and (Figure 5) and the nearly linear correlation between and (upper panel of Figure 8), and that the rise timescale is similar to those observed in stellar-mass Galactic sources; as a result, the hard-to-soft state transition also occurs at similar times after the beginning of an outburst. The similarity of the rise and decay timescales and outburst duration between HLX-1 at 95 Mpc and Galactic stellar-mass BHs remains an unexplained puzzle: on the one hand, it suggests that the characteristic size of the accretion flow is similar; on the other hand, we find no reason to dispute that the accretion rate and the BH mass (and hence, the size of the ISCO) of HLX-1 are three orders of magnitude higher than in Galactic BHs.
For Galactic LMXBTs, the correlations between the radiated energy and the -folding rise and decay timescales, and between the radiated energy and the peak luminosity (Yan & Yu, 2015) quantitatively support the thermal-viscous disk instability model. HLX-1 does not follow those correlations, which suggests that its outbursts are not triggered by the thermal-viscous disk instability (Lasota et al., 2011, 2015). If they were, the outer radius of the accretion disk would have to be two orders of magnitude larger than previously estimated, in order for a cold neutral zone to be present (Lasota et al., 2011); but in that case, the viscosity parameter would have to be two orders of magnitude higher than in Galactic LMXBTs, to obtain the same (short) rise and decay timescales, and yet such high viscosity seems not plausible in the reality (King et al., 2007).
We quantified the evolutionary trends of the main outburst parameters of HLX-1 between 2009 and 2015. The outburst duration, total radiated energy, and -folding decay timescale decrease along the outburst sequence, confirming previous results (Godet et al., 2013; Miller et al., 2014). The waiting time, recurrence time, and -folding rise timescale increase with the outburst sequence. The increase in the recurrence time rules out earlier suggestions that the recurrence time corresponded to the binary period, or indicates that the binary period increases in some extreme cases (e.g. Godet et al., 2014, 2015). The increase of the waiting time and the decrease of the outburst duration show that HLX-1 spends more and more time in the quiescence phase and less and less time in the outburst phase; however, its peak luminosity continues to reach similar values of erg s-1.
References
- Arnaud (1996) Arnaud, K. A. 1996, in Astronomical Society of the Pacific Conference Series, Vol. 101, Astronomical Data Analysis Software and Systems V, ed. G. H. Jacoby & J. Barnes, 17
- Astropy Collaboration et al. (2013) Astropy Collaboration, Robitaille, T. P., Tollerud, E. J., et al. 2013, A&A, 558, A33
- Bachetti et al. (2014) Bachetti, M., Harrison, F. A., Walton, D. J., et al. 2014, Nature, 514, 202
- Becker et al. (2012) Becker, P. A., Klochkov, D., Schönherr, G., et al. 2012, A&A, 544, A123
- Begelman et al. (2006) Begelman, M. C., King, A. R., & Pringle, J. E. 2006, MNRAS, 370, 399
- Belloni et al. (2006) Belloni, T., Parolin, I., Del Santo, M., et al. 2006, MNRAS, 367, 1113
- Belloni (2010) Belloni, T. M. 2010, in Lecture Notes in Physics, Berlin Springer Verlag, Vol. 794, Lecture Notes in Physics, Berlin Springer Verlag, ed. T. Belloni, 53
- Cash (1979) Cash, W. 1979, ApJ, 228, 939
- Chen et al. (1997) Chen, W., Shrader, C. R., & Livio, M. 1997, ApJ, 491, 312
- Coriat et al. (2012) Coriat, M., Fender, R. P., & Dubus, G. 2012, MNRAS, 424, 1991
- Davis et al. (2011) Davis, S. W., Narayan, R., Zhu, Y., et al. 2011, ApJ, 734, 111
- Dunn et al. (2010) Dunn, R. J. H., Fender, R. P., Körding, E. G., Belloni, T., & Cabanac, C. 2010, Mon. Not. R. Astron. Soc., 403, 61
- Evans et al. (2007) Evans, P. A., Beardmore, A. P., Page, K. L., et al. 2007, A&A, 469, 379
- Evans et al. (2009) —. 2009, MNRAS, 397, 1177
- Fabrika et al. (2007) Fabrika, S. N., Abolmasov, P. K., & Karpov, S. 2007, in IAU Symposium, Vol. 238, IAU Symposium, ed. V. Karas & G. Matt, 225–228
- Farrell et al. (2010) Farrell, S. A., Servillat, M., Oates, S. R., et al. 2010, X-ray Astronomy 2009; Present Status, Multi-Wavelength Approach and Future Perspectives, 1248, 93
- Farrell et al. (2009) Farrell, S. A., Webb, N. A., Barret, D., Godet, O., & Rodrigues, J. M. 2009, Nature, 460, 73
- Farrell et al. (2012) Farrell, S. A., Servillat, M., Pforr, J., et al. 2012, ApJ, 747, L13
- Farrell et al. (2014) Farrell, S. A., Servillat, M., Gladstone, J. C., et al. 2014, MNRAS, 437, 1208
- Fender et al. (2004) Fender, R. P., Belloni, T. M., & Gallo, E. 2004, MNRAS, 355, 1105
- Feng & Soria (2011) Feng, H., & Soria, R. 2011, New A Rev., 55, 166
- Godet et al. (2009) Godet, O., Barret, D., Webb, N. A., Farrell, S. A., & Gehrels, N. 2009, ApJ, 705, L109
- Godet et al. (2014) Godet, O., Lombardi, J. C., Antonini, F., et al. 2014, ApJ, 793, 105
- Godet et al. (2013) Godet, O., Webb, N., Barret, D., et al. 2013, The Astronomer’s Telegram, 5439, 1
- Godet et al. (2015) Godet, O., Webb, N., Barret, D., & Lombardi, J. 2015, The Astronomer’s Telegram, 6929, 1
- Godet et al. (2012) Godet, O., Plazolles, B., Kawaguchi, T., et al. 2012, ApJ, 752, 34
- Homan et al. (2001) Homan, J., Wijnands, R., van der Klis, M., et al. 2001, ApJS, 132, 377
- Jiang et al. (2014) Jiang, Y.-F., Stone, J. M., & Davis, S. W. 2014, ApJ, 796, 106
- Kalemci et al. (2013) Kalemci, E., Dinçer, T., Tomsick, J. A., et al. 2013, ApJ, 779, 95
- Kawashima et al. (2012) Kawashima, T., Ohsuga, K., Mineshige, S., et al. 2012, ApJ, 752, 18
- Kelly (2007) Kelly, B. C. 2007, ApJ, 665, 1489
- King & Lasota (2014) King, A., & Lasota, J.-P. 2014, MNRAS, 444, L30
- King (2009) King, A. R. 2009, MNRAS, 393, L41
- King & Pounds (2003) King, A. R., & Pounds, K. A. 2003, MNRAS, 345, 657
- King et al. (2007) King, A. R., Pringle, J. E., & Livio, M. 2007, MNRAS, 376, 1740
- Kong (2011) Kong, A. K. H. 2011, ArXiv e-prints, arXiv:1102.3212
- Kong et al. (2015) Kong, A. K. H., Soria, R., & Farrell, S. 2015, The Astronomer’s Telegram, 6916, 1
- Kording et al. (2008) Kording, E., Rupen, M., Knigge, C., et al. 2008, Science (80-. )., 320, 1318
- Krimm et al. (2013) Krimm, H. A., Holland, S. T., Corbet, R. H. D., et al. 2013, ApJS, 209, 14
- Lasota (2001) Lasota, J.-P. 2001, New A Rev., 45, 449
- Lasota et al. (2011) Lasota, J.-P., Alexander, T., Dubus, G., et al. 2011, ApJ, 735, 89
- Lasota et al. (2015) Lasota, J.-P., King, A. R., & Dubus, G. 2015, ApJ, 801, L4
- Liu (2009) Liu, J. 2009, ApJ, 704, 1628
- Liu et al. (2013) Liu, J.-F., Bregman, J. N., Bai, Y., Justham, S., & Crowther, P. 2013, Nature, 503, 500
- Maccarone (2003) Maccarone, T. J. 2003, A&A, 409, 697
- Maccarone & Coppi (2003) Maccarone, T. J., & Coppi, P. S. 2003, Mon. Not. R. Astron. Soc., 338, 189
- Matsuoka et al. (2009) Matsuoka, M., Kawasaki, K., Ueno, S., et al. 2009, PASJ, 61, 999
- Miller et al. (2014) Miller, M. C., Farrell, S. A., & Maccarone, T. J. 2014, ApJ, 788, 116
- Miyamoto et al. (1995) Miyamoto, S., Kitamoto, S., Hayashida, K., & Egoshi, W. 1995, ApJ, 442, L13
- Motch et al. (2011) Motch, C., Pakull, M. W., Grisé, F., & Soria, R. 2011, Astronomische Nachrichten, 332, 367
- Motch et al. (2014) Motch, C., Pakull, M. W., Soria, R., Grisé, F., & Pietrzyński, G. 2014, Nature, 514, 198
- Muñoz-Darias et al. (2014) Muñoz-Darias, T., Fender, R. P., Motta, S. E., & Belloni, T. M. 2014, MNRAS, 443, 3270
- Ohsuga & Mineshige (2011) Ohsuga, K., & Mineshige, S. 2011, ApJ, 736, 2
- Paul & Naik (2011) Paul, B., & Naik, S. 2011, Bulletin of the Astronomical Society of India, 39, 429
- Poutanen et al. (2007) Poutanen, J., Lipunova, G., Fabrika, S., Butkevich, A. G., & Abolmasov, P. 2007, MNRAS, 377, 1187
- Reig (2008) Reig, P. 2008, A&A, 489, 725
- Reig (2011) —. 2011, Ap&SS, 332, 1
- Reig et al. (2006) Reig, P., Martínez-Núñez, S., & Reglero, V. 2006, A&A, 449, 703
- Reig & Nespoli (2013) Reig, P., & Nespoli, E. 2013, A&A, 551, A1
- Servillat et al. (2011) Servillat, M., Farrell, S. A., Lin, D., et al. 2011, ApJ, 743, 6
- Shakura & Sunyaev (1973) Shakura, N. I., & Sunyaev, R. A. 1973, Astron. Astrophys., 24, 337
- Shen et al. (2015) Shen, R.-F., Barniol Duran, R., Nakar, E., & Piran, T. 2015, MNRAS, 447, L60
- Soria (2013) Soria, R. 2013, MNRAS, 428, 1944
- Soria et al. (2012) Soria, R., Hakala, P. J., Hau, G. K. T., Gladstone, J. C., & Kong, A. K. H. 2012, MNRAS, 420, 3599
- Soria et al. (2013) Soria, R., Hau, G. K. T., & Pakull, M. W. 2013, ApJ, 768, L22
- Tang et al. (2011) Tang, J., Yu, W.-F., & Yan, Z. 2011, Res. Astron. Astrophys., 11, 434
- van Paradijs (1996) van Paradijs, J. 1996, Astrophys. J. Lett., 464, L139
- van Paradijs & McClintock (1994) van Paradijs, J., & McClintock, J. E. 1994, A&A, 290, 133
- Watarai et al. (2001) Watarai, K.-y., Mizuno, T., & Mineshige, S. 2001, ApJ, 549, L77
- Webb et al. (2012) Webb, N., Cseh, D., Lenc, E., et al. 2012, Science, 337, 554
- Webb et al. (2010) Webb, N. A., Barret, D., Godet, O., et al. 2010, ApJ, 712, L107
- Webb et al. (2014) Webb, N. A., Godet, O., Wiersema, K., et al. 2014, ApJ, 780, L9
- Wiersema et al. (2010) Wiersema, K., Farrell, S. A., Webb, N. A., et al. 2010, ApJ, 721, L102
- Wiktorowicz et al. (2015) Wiktorowicz, G., Sobolewska, M., Sadowski, A., & Belczynski, K. 2015, ArXiv e-prints, arXiv:1503.08745
- Yan & Yu (2010) Yan, Z., & Yu, W. 2010, Sci. China G Phys. Astron., 53, 147
- Yan & Yu (2015) Yan, Z., & Yu, W. 2015, ApJ, 805, 87
- Yu & Dolence (2007) Yu, W., & Dolence, J. 2007, ApJ, 667, 1043
- Yu et al. (2004) Yu, W., van der Klis, M., & Fender, R. 2004, ApJ, 611, L121
- Yu & Yan (2009) Yu, W., & Yan, Z. 2009, ApJ, 701, 1940