ZFIRE11affiliation: http://zfire.swinburne.edu.au : Galaxy Cluster Kinematics, H Star Formation Rates, and Gas-Phase Metallicities of XMM-LSS J02182-05102 at
Abstract
We spectroscopically survey the galaxy cluster XMM-LSS J02182-05102 (hereafter IRC 0218) using LRIS (optical) and MOSFIRE (near-infrared) on Keck I as part of the ZFIRE survey. IRC 0218 has a narrow redshift range of defined by 33 members of which 20 are at Rproj Mpc. The cluster redshift and velocity dispersion are and km s-1. We reach NIR line sensitivities of erg s-1 cm-2 that, combined with multi-wavelength photometry, provide extinction-corrected H star formation rates (SFR), gas phase metallicities from [Nii]/H, and stellar masses. We measure an integrated H SFR of yr-1 (26 members; Rproj Mpc) and show that the elevated star formation in the cluster core (Rproj Mpc) is driven by the concentration of star-forming members, but the average SFR per H-detected galaxy is half that of members at Rproj Mpc. However, we do not detect any environmental imprint when comparing attenuation and gas phase metallicities: the cluster galaxies show similar trends with as to the field, e.g. more massive galaxies have larger stellar attenuation. IRC 0218’s gas phase metallicity- relation (MZR) is offset to lower metallicities relative to and has a slope of . Comparing the MZR in IRC 0218 to the COSMOS cluster at shows no evolution ( Gyr): the MZR for both galaxy clusters are remarkably consistent with each other and virtually identical to several field surveys at .
Subject headings:
galaxies: clusters: individual (XMM-LSS J02182-05102) – galaxies: evolution – galaxies: abundances – galaxies: fundamental parameters1. Introduction
The advent of sensitive infrared imaging surveys has provided a powerful method for identifying galaxy clusters at (Eisenhardt et al., 2008; Papovich et al., 2010; Gonzalez et al., 2012; Spitler et al., 2012). We are now able to track how clusters build up their galaxy populations over % of cosmic time (). Of particular interest to current galaxy formation models are how scaling relations evolve and depend on environment (Davé et al., 2011b, a; Genel et al., 2014; Tonnesen & Cen, 2014; Schaye et al., 2015; Taylor & Kobayashi, 2015). For example, the activity observed in clusters at combined with the old stellar ages of cluster galaxies at indicate that is an important epoch for understanding how star formation is quenched (e.g. Rudnick et al., 2012; Brodwin et al., 2013).
Essential to measuring scaling relations at is separating first cluster galaxies from the field. IR imaging is effective at identifying galaxy overdensities at , but broadband photometric redshifts () are coarse and field contamination is a concern, especially beyond the cluster core111Although see results using medium-band NIR filters that improve by a factor of compared to broadband measurements (Whitaker et al., 2011; Spitler et al., 2012). This is also true for studies using narrow-band imaging to identify H-emitting members (Finn et al., 2005; Koyama et al., 2013a). Neither method can measure cluster kinematics, and both are susceptible to contamination by broad-line Active Galactic Nuclei (AGN). While Hubble Space Telescope WFC3 grism observations can measure continuum features, e.g. the Balmer break, as well as strong emission lines (Brammer et al., 2012; Zeimann et al., 2013; Newman et al., 2014; Gobat et al., 2013), the spectral resolution is too low for measuring cluster kinematics and spectral lines such as H and [Nii] are blended. The WFC3 footprint also is limited to the cluster core.
Due to these limitations, currently there are only four (proto) galaxy clusters at that have enough members () for a kinematic analysis (Bayliss et al., 2014; Yuan et al., 2014; Shimakawa et al., 2014). The large range in measured cluster velocity dispersions (550-1500 km s-1) and substantial spatial substructure confirm that these are dynamically young systems. Because the clusters are still assembling, we can better disentangle evolution driven by environment versus galaxy mass (Peng et al., 2010; Wetzel et al., 2012; Quadri et al., 2012; Muzzin et al., 2012; Papovich et al., 2012; Bassett et al., 2013). For example, the discovery of intense star formation in the cluster cores (Hilton et al., 2010; Tran et al., 2010; Zeimann et al., 2013) suggests an active interplay between enrichment of gas in the Inter-Stellar Medium (ISM) and the Intra-Cluster Medium (ICM).
The primary challenge to studying cluster galaxy populations at is the need for near-IR spectroscopy. With the installation of efficient multi-object near-IR spectrographs such as Subaru/FMOS (Kimura et al., 2010), VLT/KMOS (Sharples et al., 2013), and Keck/MOSFIRE (McLean et al., 2012), we can now obtain key rest-frame features from [Oii]Å to [Sii]Å for galaxy clusters at . These spectral features have been used to establish empirical scaling relations at that we can now test at , can we detect an environmental dependence in addition to redshift evolution?
The increasing activity in galaxy clusters with redshift raises the question of how star formation rates (SFR), stellar masses (), attenuation, and gas phase metallicities are related. Star-forming cluster galaxies at define a SFR- relation similar to the field (“main sequence”; Daddi et al., 2007; Noeske et al., 2007; Koyama et al., 2013b), but studies suggest there are environmental differences, e.g. suppressed star formation in low-mass members and less attenuation (Zeimann et al., 2013). If cluster galaxies follow a different relation between specific SFR and stellar mass (SSFR-), this could mean that the ionization conditions are also different (Kewley et al., 2015).
Recent studies of gas phase metallicity versus (MZR) find that galaxies at are uniformly offset from the local relation (Erb et al., 2006a; Steidel et al., 2014; Sanders et al., 2015). However, while the MZR in the local universe shows an environmental dependence, (Cooper et al., 2008; Ellison et al., 2009; Peng & Maiolino, 2014), it is unclear if this is also the case at : several studies using stacked spectra find the cluster galaxies to be more metal-rich than their field counterparts (Kulas et al., 2013; Valentino et al., 2014; Shimakawa et al., 2015), but Kacprzak et al. (2015) study cluster galaxies at and find no difference from the field.
To determine if empirical relations vary with environment at , the ZFIRE survey combines NIR spectroscopy obtained with Keck/MOSFIRE (McLean et al., 2012) with deep multi-wavelength imaging to study cluster galaxies at . We compare to field measurements obtained by complementary surveys such as KBSS (Steidel et al., 2014) and MOSDEF (Kriek et al., 2015). Initial ZFIRE results on the COSMOS cluster at (Spitler et al., 2012) include spectroscopically confirming members and measuring the cluster’s velocity dispersion (Yuan et al., 2014), measuring the cluster’s gas phase metallicity- relation (Kacprzak et al., 2015), and investigating the ionization properties of the Inter-Stellar Medium (ISM) of individual cluster galaxies (Kewley et al., 2015).
As part of our ZFIRE survey, we obtain optical and NIR spectroscopy of XMM-LSS J02182-05102 (hereafter IRC 0218)222This galaxy cluster is also referred to as CLG0218.3-0510 by Tran et al. (2010) and Santos et al. (2014). at . Originally reported by Papovich et al. (2010), IRC 0218 was one of the first galaxy clusters to show an increasing fraction of star formation with increasing local density (Tran et al., 2010). Estimates of IRC 0218’s total star formation rate as determined by IR observations are yr-1 (Popesso et al., 2012; Santos et al., 2014). Because IRC 0218 is still in the process of building its galaxy population (Rudnick et al., 2012), the cluster is an ideal target for tracking how star formation, gas phase metallicities, and dust vary with stellar mass as a function of environment at .
In our analysis, we center IRC 0218 on the Brightest Cluster Galaxy (BCG) at . The BCG is also currently the most distant galaxy-galaxy lens with a total mass within the Einstein radius of (Wong et al., 2014). We use a Chabrier Initial Mass Function and AB magnitudes throughout our analysis. We assume , =0.3, and km s-1 Mpc-1. At , the angular scale is kpc.
2. Observations and Data
2.1. Target Catalog
Spectroscopic targets were selected from the Williams et al. (2009) catalog of the Ultra-Deep Survey (UDS) taken as part of the UKIRT Infrared Deep Sky Survey (UKIDSS), a public near-infrared imaging survey (Lawrence et al., 2007). The -selected catalogs reach -limiting magnitudes in a 1.75″ diameter of , , , , , and mag. We refer the reader to Williams et al. (2009) and Quadri et al. (2012) for more details on the photometric and catalogs used in this work.
2.2. Optical Spectroscopy: Keck/LRIS
Using the Low Resolution Imaging Spectrometer (LRIS; Oke et al., 1995, field of view; per pixel) on Keck, we carried out a spectroscopic survey centered on the cluster on 19 & 20 October 2012 (NASA/Keck Program ID 48/2012B). The primary LRIS targets were selected to be brighter than mag and the secondary targets (mask fillers) between mag. No morphological selection was applied. Of the primary targets, higher priority was also given to objects identified to be candidate star-forming cluster galaxies (Tran et al., 2010), candidate Lyman-Break Galaxies at , and [Oii]-emitters identified from narrow-band imaging (Tadaki et al., 2012).
We use the 600/4000 grism for the blue side of LRIS ( m) and the 600/10000 grating for the red side ( m); with 1″ slit widths, the corresponding resolution is 4.0Å and 4.7Å respectively. Observing conditions were excellent with median seeing of about 0.6″. A subset of high priority targets, e.g. the brightest cluster galaxies, were targeted in three of the four observed masks. For masks 1, 2, and 3 which included common high priority targets, we obtained minute exposures. For mask 4 which included a more general redshift selection, we obtained minute exposures. The four LRIS masks have a total of 136 targets including repeats. For all the exposures, we dithered by along the slit to minimize sky residuals. Standard calibrations including flat-fields and arc lamps (ArCdHgNeZn) for each mask also were taken.
To reduce the spectra, we follow Tran et al. (2007) and use IRAF333IRAF is distributed by the National Optical Astronomy Observatories, which are operated by the Association of Universities for Research in Astronomy, Inc., under cooperative agreement with the National Science Foundation. routines with custom software provided by D. Kelson (Kelson, 1998, 2003). To summarize, we first convert the multi-extension files into single images for the blue and red sides; we reduce the blue and red sides of LRIS separately. Cosmic rays are particularly problematic on the red side and we remove as many as possible using crutil in IRAF; the blue side is minimally affected by cosmic rays. We flat-field the science frames, determine the vacuum wavelength solution with the arclamp, remove the sky lines, and rectify the 2D spectra. We median the rectified science frames for each mask to obtain a single combined image.
The 2D spectra first were visually inspected to identify all potential sources including emission-line only objects. The 1D spectra were extracted by summing the five rows centered on the source (0.135″ per pixel) of each 2D spectrum; the wavelength coverage for the extracted spectra is Å (blue side) and Å (red side). For galaxies at , this corresponds to rest-frame UV where the continuum is detected for only a handful of systems. To measure redshifts, we use xcsao in IRAF (Kurtz et al., 1992) with various templates for star-forming, quiescent, post-starburst, Lyman-break, and Ly galaxies; we refer the reader to Tran et al. (2005b) for details.
2.3. Near-Infrared Spectroscopy: Keck/MOSFIRE
At , most of the rest-frame optical spectral features such as H and H have shifted to the near-IR. To measure these features and provide continuous spectral coverage of the cluster galaxies, we used Keck/MOSFIRE (McLean et al., 2012) on 23 & 24 December 2013 and on 10-13 February 2014. Primary targets were galaxies spectroscopically confirmed with the LRIS observations to be at (see Fig. 1). We also included objects from the 3D-HST survey with grism redshifts (Momcheva et al., in prep). Secondary targets were selected to have using the Williams catalog, and the lowest priority fillers had and mag.
We obtained YJH spectroscopy corresponding to wavelength ranges of m, m, and m respectively. Using slit-widths (pixel scale is ), the spectral resolution of corresponds to a dispersion of 1.086, 1.303, and 1.627 Å/pixel for YJH. The MOSFIRE spectroscopic field of view is , and we observed four masks with approximately 25-35 objects targeted in each to map the galaxy cluster (Fig. 1). All the masks were designed using the MAGMA slitmask design software 444www2.keck.hawaii.edu/inst/mosfire/magma.html. A slit star was included in each mask to monitor the flux throughput and seeing. Flat-fields and arcs (Neon, Argon) were taken during afternoon calibrations for each mask.
For the December 2013 run, we designed three masks that were observed with both J and H. The seeing FWHM on the first night was and improved to on the second night. Adjusting for the seeing conditions to reach approximately the same flux limit in all masks, we integrated for a total of seconds and seconds in the J and H bands respectively; individual exposure times for both JH bands were 120 sec. All spectroscopy was taken with an ABBA dither pattern and an offset of . Long-slit spectroscopy of the standard star Feige 15 was taken on both nights to correct for telluric absorption by the atmosphere and to flux calibrate the data.
For the February 2014 run, we used a single mask to obtain Y band spectroscopy of mostly confirmed cluster members. Conditions on the first night were poor with seeing FWHM of (none of these observations are usable) but improved to for the following three nights. The Y mask was observed each night for sec with individual exposure times of 180 sec. The total integration time is 24300 sec, but we note that useful time on target is less due to varying conditions on the first two nights. Data taken under poorer weather conditions were given less weight when combining the observations, i.e. the data were weighted by the S/N of the continuum.
To reduce the MOSFIRE spectroscopy, we use the publicly available data reduction pipeline (DRP) developed by the instrument team555https://github.com/Mosfire-DataReductionPipeline/MosfireDRP. The DRP provides background-subtracted, rectified, and (vacuum) wavelength calibrated 2D spectra for each slit. Using custom IDL routines, we then correct the 2D spectroscopy for telluric absorption and flux calibrate using the standard star observations. To extract the 1D spectra and associated error spectra, we fit a Gaussian profile along the spatial direction to determine the extraction aperture for each object; typical extraction apertures are . For objects that are too faint to fit a spatial profile, we use the Gaussian profile fit to the slit star in the same mask.
The 2D spectra were visually inspected to identify all potential sources; for the most part, these detections are emission lines, e.g. H in the H-band for galaxies at . Spectroscopic redshifts were determined with two-step method: 1) using in IRAF with an emission-line template and, where possible, combining JH observations, to measure a redshift and 2) using this redshift to fit 1D Gaussians to emission lines along the spectral direction and propagating errors using the corresponding error spectrum.
For more details on our data reduction, we refer to our MOSFIRE analysis of the COSMOS cluster (Yuan et al., 2014). Especially thorough reviews of MOSFIRE observing strategies and data reduction are also presented by Kriek et al. (2015) and Steidel et al. (2014); note that the latter uses the public data reduction pipeline (DRP) released for MOSFIRE. Both publications provide extensive discussion on the capabilities of the instrument and strategies for post-processing. A full description of our data reduction for IRC 0218 and the COSMOS galaxy cluster at also will be presented in Nanayakkara et al. (in prep).
2.4. Redshift Catalog
Each spectroscopic redshift is assigned a quality flag where denotes a robust measurement (multiple spectral lines), is likely (single spectral line with potential secondary line), and is guess (single line and/or no strong spectral features). The combined spectroscopic observations from LRIS and MOSFIRE yield 130 unique redshifts. Note that all of the cluster galaxies reported here are confirmed with emission-lines, e.g. the split [Oii]Å doublet or H+[Nii] pair. Faint continua are detected for only a handful of cluster galaxies and are not reliable for measuring absorption-line redshifts, our survey is strongly biased towards active galaxies with emission lines. In our analysis, we use only the 109 unique objects with redshift quality flag of (54 identified by LRIS and 55 by MOSFIRE).
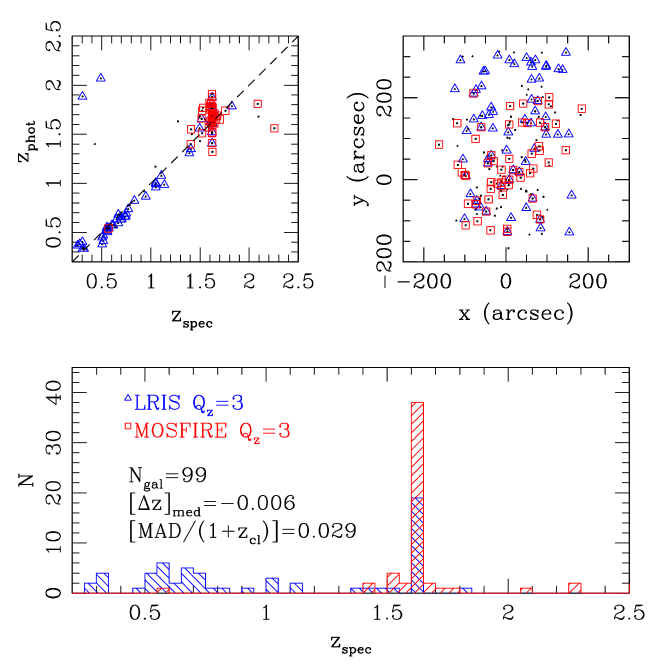
We find the spectroscopic redshifts are in good agreement with the photometric redshifts (Fig. 1, top left). The (-) distribution for the 99 objects with and Q has a median difference of ; we use the median to minimize the effect of redshift outliers. The corresponding absolute median deviation is % where the latter is determined using and assuming =1.62. For the 49 galaxies at , the median difference is 0.06 and absolute median deviation is also %; there is only one spectroscopically confirmed member with -.
The redshift distributions in Fig. 1 (bottom) demonstrate how well LRIS and MOSFIRE complement each other. LRIS is effective up to because [Oii] is still within the LRIS wavelength range. MOSFIRE is extremely effective at when [Oiii] and H move into the J and H bands, respectively.
2.5. NIR Emission-Line Fluxes
To obtain spectro-photometric data and correct for the slit-loss, we flux calibrate the MOSFIRE observations using a combination of ground-based and Hubble Space Telescope imaging. We use the standard star flux calibrated data from our custom IDL routines to compare with the data from the (publicly) available UKIDSS Data Release 8 (Quadri et al., 2012). More information on the filter systems used in UKIDSS can be found in Hewett et al. (2006).
We mask the sky regions in the spectra by assigning them weights of zero and use an inverse variance weighting to calculate the total spectroscopic fluxes for each 1D spectrum. We use the UKIRT WFCAM filter response functions to be able to directly compare our results with the total broadband photometric fluxes of UKIDSS.
For each MOSFIRE mask in a given band, we calculate the median offset between the spectroscopic magnitudes and the broadband photometric magnitudes for all objects brighter than 23 mag. We use the median offset as the correction factor to be applied to all the objects in the respective masks to account for slit losses. We then calculate the normalized median absolute deviation for objects with a broadband magnitude brighter than 24 mag to determine the uncertainty for the scaling process. We find the J-band to have systematically more scatter compared to the H-band. We calculate the flux uncertainties in the calibrated spectra to be 20%. A more detailed analysis will be presented in Nanayakkara et al. (in prep).
Our analysis uses HÅ, HÅ, [Nii]Å, and [Oiii]Å line fluxes to measure redshifts, star formation rates, gas attenuation, and gas metallicities of galaxies. H is the strongest emission line and falls in the H-band; all of the H detections are measured at significance for these galaxies. We identify 45 galaxies at (Fig. 2) with H fluxes of erg s-1 cm-2. The H-band includes the much weaker [Nii] emission line; objects with [Nii] measurements that are below the detection limit of erg s-1 cm-2 and/or detected with statistical significance of are assigned upper limits from the line-fitting.
For our analysis of star formation and gas metallicities, we use the narrow redshift range of defined by our kinematic analysis (§3.1) and exclude the cluster galaxies that are X-ray detected (1) and that host broad-line AGN (1; identified by H and [Nii]); this leaves 26 star-forming cluster galaxies with H fluxes and a stellar mass range of (Table 1). We consider measurements for both individual galaxies as well as for stacked spectra divided into three stellar mass bins.
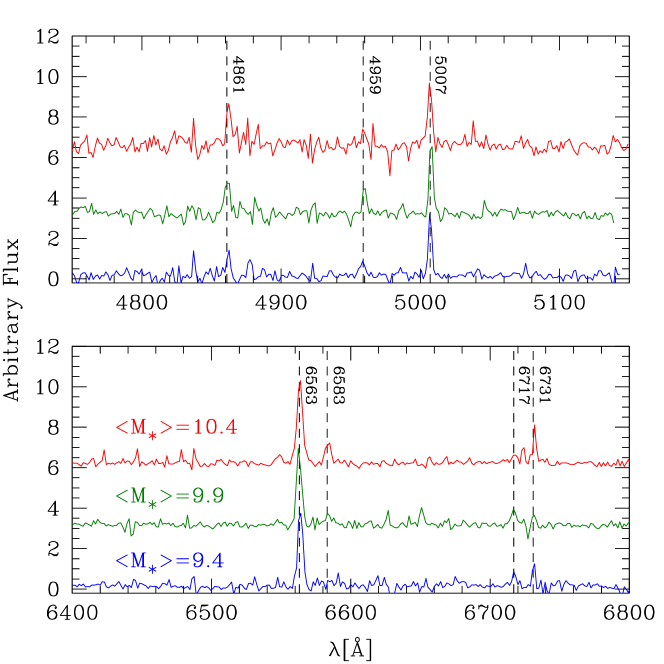
To stack the spectra, we first divide the 26 star-forming members into three stellar mass bins with ranges of (9 members), (9 members), and (8 members). We normalize the individual galaxies by their H flux to give them equal weight (e.g. Sanders et al., 2015), convert the spectra to rest-frame values, combine the spectra, and then measure the line fluxes by fitting Gaussian profiles. Confidence intervals for the line fluxes are determined by boot-strapping the 1D spectra. The stacked spectra show even the weaker emission lines H and [Nii] as well as the [Sii] doublet (Fig. 3).
| Keck ID | mag | AV,star,SB | fHbbObserved fluxes in units of erg s-1 cm-2. Note that in several cases, fH and f[Nii] are upper limits considering the S/N. | fHbbObserved fluxes in units of erg s-1 cm-2. Note that in several cases, fH and f[Nii] are upper limits considering the S/N. | f[Nii]bbObserved fluxes in units of erg s-1 cm-2. Note that in several cases, fH and f[Nii] are upper limits considering the S/N. | SFR(H)ccH fluxes are corrected for dust using AV,star (Eq. 7; see §3.2) and then converted to star formation rates using the relation from Hao et al. (2011). | ||||
|---|---|---|---|---|---|---|---|---|---|---|
| 36395 | 34.61690 | -5.20299 | 24.70 | 1.613 | 2.2 | |||||
| 36849 | 34.56660 | -5.19900 | 25.00 | 1.624 | 3.6 | |||||
| 37269 | 34.56870 | -5.19590 | 24.72 | 1.624 | 5.3 | |||||
| 37522 | 34.60300 | -5.19369 | 24.95 | 1.622 | 8.1 | |||||
| 38080 | 34.61000 | -5.18868 | 24.15 | 1.625 | 11.0 | |||||
| 38455 | 34.60940 | -5.18625 | 24.02 | 1.623 | 12.2 | |||||
| 39150 | 34.59990 | -5.17829 | 25.50 | 1.624 | 2.8 | |||||
| 39463 | 34.59290 | -5.17625 | 24.23 | 1.622 | 9.2 | |||||
| 39771 | 34.59280 | -5.17402 | 24.36 | 1.623 | 10.1 | |||||
| 39989 | 34.58750 | -5.17219 | 25.28 | 1.623 | 4.3 | |||||
| 40243 | 34.61680 | -5.16958 | 24.78 | 1.622 | 2.8 | |||||
| 40382 | 34.61750 | -5.16884 | 25.18 | 1.623 | 30.8 | |||||
| 40568 | 34.58070 | -5.16690 | 24.79 | 1.626 | 6.2 | |||||
| 40729 | 34.58480 | -5.16558 | 24.76 | 1.627 | 2.1 | |||||
| 40731 | 34.59280 | -5.16529 | 24.84 | 1.625 | 2.5 | |||||
| 41189 | 34.62220 | -5.16206 | 23.77 | 1.623 | 10.9 | |||||
| 41297 | 34.60190 | -5.16097 | 24.44 | 1.622 | 14.0 | |||||
| 41548 | 34.59790 | -5.15948 | 24.48 | 1.624 | 25.1 | |||||
| 41956 | 34.59960 | -5.15566 | 23.75 | 1.621 | 50.2 | |||||
| 43178 | 34.61020 | -5.14441 | 24.66 | 1.621 | 24.3 | |||||
| 44102 | 34.56320 | -5.13659 | 24.62 | 1.621 | 21.5 | |||||
| 44403 | 34.57880 | -5.13336 | 24.88 | 1.622 | 5.9 | |||||
| 44459 | 34.62260 | -5.13383 | 23.93 | 1.624 | 11.0 | |||||
| 44587 | 34.56660 | -5.13347 | 24.12 | 1.621 | 8.8 | |||||
| 45959 | 34.56070 | -5.12105 | 25.05 | 1.620 | 15.2 | |||||
| 46922 | 34.61150 | -5.11372 | 23.21 | 1.630 | 23.6 |
2.6. Stellar Masses & Stellar Attenuation
To determine stellar masses () and stellar attenuation (AV,star,SB; Table 1), we use the catalog of the UDS field from Quadri et al. (2012) with our spectroscopic redshifts. Both and AV,star,SB are determined by using FAST (Kriek et al., 2009) to fit Spectral Energy Distributions (SEDs) to the multi-wavelength imaging. We use a Chabrier (2003) initial stellar mass function, constant solar metallicity, and exponentially declining star formation rate (10 Myr to 10 Gyr).
We also use FAST to determine the corresponding errors for and AV,star,SB; the latter assumes RV=4.05 (starburst attenuation curve; Calzetti et al., 2000)666The starburst (SB) attenuation curve is commonly referred to as the Calzetti law and is appropriate for continuum measurements. We use “starburst” as requested by D. Calzetti.. FAST determines confidence intervals by using Monte Carlo simulations and modifying the observed fluxes by their photometric errors in each simulation. Note that there are degeneracies between stellar attenuation, star formation histories, metallicities, and dust laws calculated by FAST. These degeneracies can sometimes be broken by independently measuring, e.g. nebular attenuation. For a subsample of the galaxies, we measure both H and H emission to determine the Balmer decrement and thus compare nebular to stellar attenuation (§3.2).
3. Analysis
3.1. Galaxy Cluster Kinematics
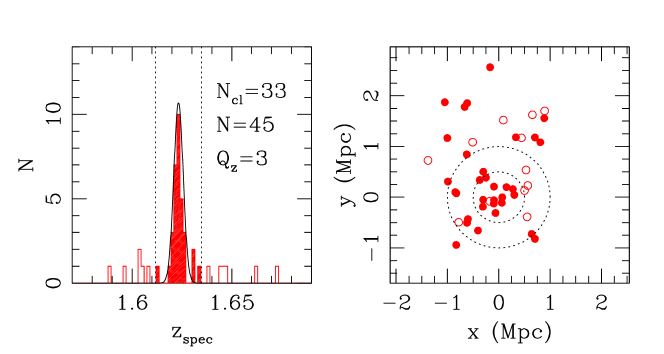
Our combined LRIS and MOSFIRE spectroscopic survey confirms 109 unique objects with redshift quality flag ; of these, nine are stars. We identify 45 galaxies at and the galaxy cluster is a well-defined peak in the redshift distribution at (Fig. 1, bottom). To determine the cluster redshift and redshift range, we first need to identify the members. We remove outliers iteratively using a median absolute deviation (MAD); the MAD is less sensitive to outliers that can be problematic for dynamically young systems such as IRC 0218. For a gaussian distribution, MAD and we use limits to define the redshift range. We employ 5 iterations and find a stable solution requires only 2 iterations: IRC 0218 has 33 members within which corresponds to limits defined by (Fig. 2).
To determine IRC 0218’s redshift, we bootstrap the 33 galaxies (15000 realizations; Beers et al., 1990) and measure a median cluster redshift of and mean cluster redshift of . The cluster galaxies have a strikingly narrow redshift distribution and the cluster velocity dispersion (from the bootstrapped distribution) is correspondingly low: km s-1, more like a group than a fully developed galaxy cluster (see §4.1). Figure 2 (right) shows that most (20/33) of the cluster members are within Rproj Mpc of the BCG. If we consider only the members at Rproj Mpc, the cluster redshift and velocity dispersion are virtually identical. The combination of high spatial density and low velocity dispersion are very conducive to galaxy-galaxy merging (Rudnick et al., 2012; Lotz et al., 2013), frequency and duration of galaxy-galaxy interations is higher than in a field environment.
IRC 0218’s redshift and velocity dispersion do not change significantly if we limit our analysis to either the MOSFIRE or LRIS observations only. If we repeat our analysis using only the MOSFIRE redshifts, there are 30 members: the median cluster redshift remain the same and the velocity dispersion decreases slightly to km s-1. Using only the LRIS redshifts, there are 17 members: the median cluster redshift remains the same and the velocity dispersion increases slightly to km s-1.
3.2. Balmer Decrement and Attenuation
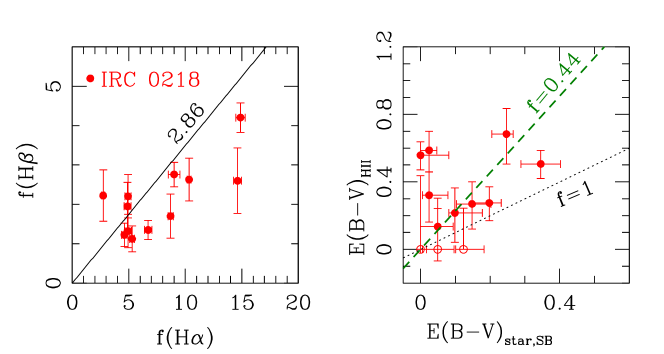
For a subset of MOSFIRE-detected galaxies, we are able to measure both H and H and thus directly determine their internal extinction via the Balmer decrement. H is by far the stronger line (Fig. 3) where H/H=2.86 is the intrinsic line flux ratio for Case B recombination with electron temperature K and electron density of cm-3 (Osterbrock, 1989). In addition to being weaker, at the H line falls in a region of telluric absorption (m) which makes it even more challenging to measure.
Only 12 cluster galaxies meet our selection criteria of H erg s-1 cm-2 measured at significance (Fig. 4, left). There are 9 cluster galaxies with H/H and three members with lesser values that are within of this ratio (Fig. 4, left). The latter are likely to have negligible attenuation and so we set their attenuation to zero.
The total attenuation curve is parameterized by
| (1) |
| (2) |
where A is the total magnitude of the extinction at wavelength and E(B-V) is the color excess as measured by nebular lines or the stellar continuum. For galaxies with a measured Balmer decrement, the color excess is determined directly from the observed line fluxes with
| (3) |
Using the Cardelli et al. (CCM; 1989) attenuation curve for the diffuse interstellar medium where R, , and , the color excess is then
| (4) |
Figure 4 (right) compares the color excess of the ionized gas E(B-V)HII to that of the stellar population E(B-V)star; the latter is determined by fitting to the (UV) stellar continuum with FAST (solar metallicity) and assuming RV,SB= (Calzetti et al., 2000). For the error in E(B-V)HII, we add the H and H line flux errors in quadrature. For the cluster galaxies, the nebular E(B-V)HII is larger than that of the stellar component E(B-V)star,SB. This is consistent with results at and that support a ratio of E(B-V)star to E(B-V)HII of 0.44 (Calzetti et al., 2000; Price et al., 2014). However, we note the large scatter in this ratio that mirrors results from recent studies of field galaxies at (Reddy et al., 2015). Although it is tempting to measure this ratio using the cluster galaxies, our limited sample does not allow us to confirm nor exclude the ratio of 0.44.
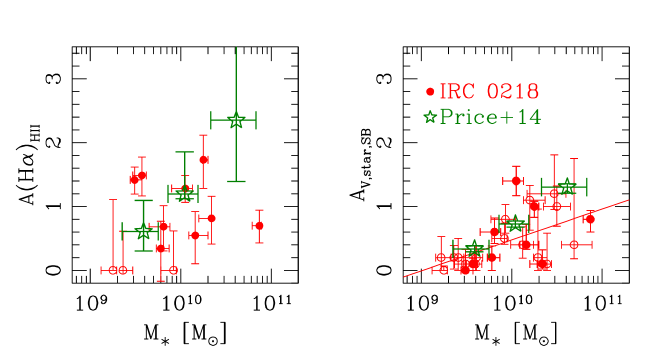
Figure 5 (left) shows the cluster galaxies that satisfy our rigorous H criteria and compares their nebular attenuation to stellar mass. The members do not define a correlation between A(H)HII and , in contrast to results at (Garn & Best, 2010) and (Price et al., 2014), nor is any trend visible when we stack the spectra into three mass bins.
The cluster galaxies define a clearer trend between stellar attenuation AV,star,SB as measured by FAST (Fig. 5, right) and . The least-squares fit to the 20 members777We exclude X-ray and broad-line AGN from the fit and also member 45959 whose SED fit indicates a very dusty low-mass galaxy (see Table 1). is
| (5) |
where . A fit using only the 9 members with a measured Balmer decrement is identical. The relation between AV,star,SB and seems to be shallower than measured for the field at (Price et al., 2014), but there is large scatter.
How then can we correct our H fluxes for attenuation given that for most of the H-detected galaxies, we only have the stellar attenuation AV,star,SB measured by FAST? For simplicity, we first correct the H line fluxes using the nebular attenuation curve from Cardelli et al. (1989) with RV=3.1
| (6) |
We then use the observed stellar to nebular attenuation ratio of E(B-V)starE(B-V)HII (Calzetti et al., 2000) and the stellar attenuation AV,star,SB as measured by FAST for all of the galaxies where E(B-V)star=AV,star,SB/4.05 (see also Steidel et al., 2014)
| (7) |
We use Eq. 7 to correct all of the H fluxes for attenuation and determine corresponding star formation rates. Recently Reddy et al. (2015) measure RV=2.505 for field galaxies at , a value that is lower than the RV for the starburst and diffuse ISM attenuation curves. However, we cannot discriminate between these models given our limited cluster sample.
3.3. H Star Formation Rates
To determine H star formation rates, we correct for attenuation using E(B-V)star (Eq. 7) and convert the H fluxes to star formation rates using the relation from Hao et al. (2011):
| (8) |
This relation assumes a Kroupa IMF ( ; Kroupa, 2001), but the relation for a Chabrier IMF is virtually identical (difference of 0.05). The uncorrected H fluxes of the 26 star-forming members range from erg s-1 cm-2. Using E(B-V)star to correct for attenuation, the corresponding H star formation rates are yr-1 (Table 1). We have excluded X-ray detected members and broad-line AGN.
The cluster field was imaged with Spitzer MIPS as part of the legacy UKIDSS Ultra Deep Survey (SpUDS PI: J. Dunlop) and the catalog includes all sources detected with which corresponds to a flux of Jy. The m fluxes are converted to total infrared luminosities (LIR) using the Chary & Elbaz (2001) templates, and SFRs are calculated from using the prescription of Kennicutt (1998), adjusted to the Chabrier IMF. We are able to measure m fluxes for the six cluster members with the highest H ( yr-1).
Even with correcting for dust attenuation, the H SFRs are lower compared to the m SFRs: on average, the m SFRs for the six detected members ( yr-1) are a factor of larger. The advantage of using H is that we are significantly more sensitive, i.e. we can measure SFRs to yr-1 compared to yr-1 with the m observations, and thus we are not limited to only the most strongly star-forming dust-obscured cluster galaxies. Papovich et al. (2007) also showed that for galaxies at , SFRs based on Chary & Elbaz (2001) templates fit only to m are larger by compared to SFRs based on a combination m, m, and m. This is intriguingly consistent with the offset we measure when comparing our H SFRs to the m SFRs.
We confirm the original measurement by Tran et al. (2010) of an elevated star formation rate within the cluster core: the integrated H SFR per square Mpc at Rproj Mpc is about six times higher than at Rproj Mpc (Fig. 6; Table 2). The five star-forming members at Rproj Mpc have stellar masses of . The cluster galaxies also show increasing SFR with stellar mass (Fig. 7). We stress that the integrated H SFRs are lower limits because 1) for the six members with both H and m SFRs, the m values are on average times higher; and 2) the limited spatial coverage of the NIR spectroscopy combined with the increasing contamination by field galaxies means we identify fewer H-emitting members at larger Rproj. In §4.4, we compare in detail the cluster H SFRs to that measured for the field at .
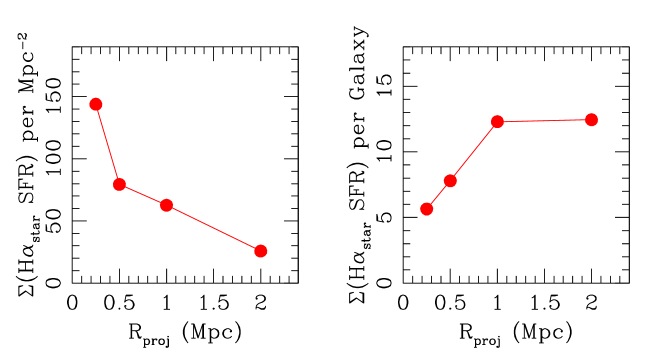
| Rproj | Ngal | (H SFR)aaThe total enclosed H star formation rate corrected for attenuation using E(B-V)star (see §3.2). X-ray detected members and broad-line AGN are excluded. Given spectroscopic incompleteness at larger radii, we consider these to be lower limits on IRC 0218’s total SFR. | (H SFR) per galaxy bbThe integrated H SFR divided by the number of H-detected galaxies within Rproj; quiescent members are excluded. | SSFR ccThe specific star formation rate determined by summing the H SFR and for the H-detected members within Rproj; quiescent members are excluded. | (H SFR) per Area |
|---|---|---|---|---|---|
| 250 kpc | 5 | 28 yr-1 | 5.6 yr-1 | 0.8 Gyr-1 | 144 yr-1 Mpc-2 |
| 500 kpc | 8 | 62 yr-1 | 7.8 yr-1 | 0.9 Gyr-1 | 79 yr-1 Mpc-2 |
| 1 Mpc | 16 | 197 yr-1 | 12.3 yr-1 | 0.8 Gyr-1 | 63 yr-1 Mpc-2 |
| Mpc | 26 | 324 yr-1 | 12.5 yr-1 | 0.9 Gyr-1 | 26 yr-1 Mpc-2 |
3.4. Gas-Phase Metallicities
Following several recent analyses on gas metallicities in the field (Kulas et al., 2013; Steidel et al., 2014; Sanders et al., 2015), we measure the oxygen abundance for the cluster galaxies using the N2 method calibrated by Pettini & Pagel (2004):
| (9) |
We use only N2 to measure gas metallicities due to our limited ability to measure H and [Oiii] for individual galaxies. We exclude X-ray detected members and broad-line AGN; we also follow Sanders et al. (2015) and require that ([Nii]/H) to remove potential AGN which removes one member. From our sample of H-detected cluster galaxies, we measure N2 for the 20 members where the [Nii] emission line is detected at (S/N); note that [Nii] is much weaker than H. For five additional members, we place upper limits on N2. We also measure gas metallicities for the binned spectra (Fig. 3).
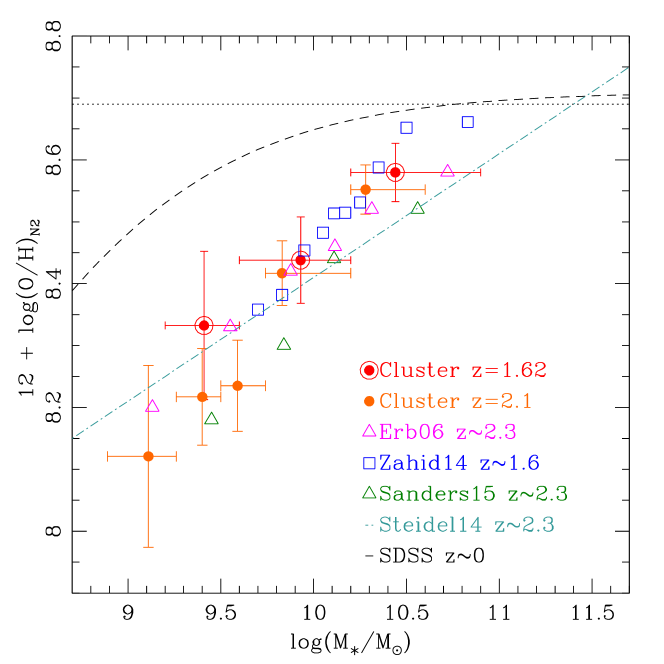
The cluster galaxies show increasing metallicity with mass (Figs. 8 & 9), a trend that is consistent with the mass-metallicity relation (MZR) measured for star-forming galaxies at (Moustakas et al., 2011). The cluster galaxies lie below the local MZR, i.e. the cluster galaxies at have lower gas metallicities at a given stellar mass. The offset in the cluster MZR is similar to that observed for field star-forming galaxies at (Zahid et al., 2014) at (Steidel et al., 2014; Sanders et al., 2015).
4. Results
4.1. Is IRC 0218 A Galaxy Cluster?
IRC 0218 is one of only a handful of galaxy clusters at with a measured cluster velocity dispersion . The challenge lies in obtaining medium-resolution near-infrared spectroscopy for a sufficient number of members to measure accurate redshifts and map the cluster’s kinematic structure (see 3.1). Although NIR spectroscopy is strongly biased towards emission-line galaxies due to the faintness of the stellar continuum, this may be advantageous given the increased star formation at this epoch (e.g. Tran et al., 2010; Brodwin et al., 2013). Note that while cluster studies at using HST/WFC3 grism observations can confirm both active and passive members via, e.g. the D4000 break (Gobat et al., 2013; Newman et al., 2014), the grisms’ redshift accuracy of km s-1 leads to rather uncertain measurements of the cluster velocity dispersion, e.g. Mei et al. (2015).
Using H to identify 15 emission-line members, Bayliss et al. (2014) measure a very large velocity dispersion of km s-1 in a galaxy cluster at . In comparison, the velocity dispersions of km s-1 measured for two proto-clusters at and (Shimakawa et al., 2014) are more in line with those of lower redshift clusters, e.g. EDisCS (Milvang-Jensen et al., 2008). The smallest velocity dispersion observed thus far at is for the COSMOS cluster with km s-1 (Yuan et al., 2014); this cluster also has the most confirmed members () as identified by our ZFIRE survey.
Relative to these studies, IRC 0218’s velocity dispersion of km s-1 (33 emission-line members; Fig. 2) is by far the smallest. This low velocity dispersion is more in the range of galaxy groups than a galaxy cluster (e.g. Gerke et al., 2005; Tanaka et al., 2013). However, this velocity dispersion is consistent with X-ray results: the cluster velocity dispersion corresponding to the total cluster mass of M estimated from the weak X-ray signal detected with XMM-Newton ( level detection; Pierre et al., 2012) is km s-1, the dynamical velocity dispersion is consistent with the X-ray derived estimate at . These values also are consistent with predictions from numerical simulations, Evrard et al. (2008) show that a halo with X-ray mass of M has an estimated velocity dispersion of 400 km s-1. Note that the cluster members are spatially concentrated with 20 of the 33 members within Rproj Mpc of the BCG (Fig. 2, right).
Using the Millenium simulation with a semi-analytic galaxy formation model, Shattow et al. (2013) select 50 central galaxies in halos with masses greater than and track them from to ; note that this halo mass is essentially IRC 0218’s dynamical mass as measured by both kinematics and X-ray. The study finds that by , most of the halos have masses , i.e. they are likely to be clusters if not the most massive ones (see also Chiang et al., 2013). Thus IRC 0218 will evolve into a galaxy cluster that can be as massive as the Virgo cluster (Schindler et al., 1999) and possibly as massive as .
4.2. Nebular vs. Stellar Attenuation
E(B-V)HII and E(B-V)star can be used to determine dust properties, E(B-V)HII probes sightlines to regions of ionized gas that are heated by short-lived OB stars while E(B-V)star is a measure of the (UV) dust attenuation of the stars and integrated over longer timescales ( Myr). For local starbursts, E(B-V)star and E(B-V)HII are correlated such that the color excess of the stellar continuum is about half that of the ionized gas (; Calzetti et al., 2000), i.e. the attenuation as measured by the nebular lines is larger. It is unclear if this relation holds at with studies measuring ratios varying from (Erb et al., 2006b; Yoshikawa et al., 2010; Kashino et al., 2013; Zahid et al., 2014; Price et al., 2014; Reddy et al., 2015).
We are able to directly measure the color excess E(B-V)HII for 9 cluster galaxies where H/H and H erg s-1 cm-2 is detected at (Fig. 4, right). Both E(B-V)HII and E(B-V)star span ranges () that are comparable to values measured at in both field and cluster studies (Zeimann et al., 2013; Price et al., 2014). The ratio of nebular to stellar attenuation is also consistent with the measured values of (Calzetti et al., 2000; Yoshikawa et al., 2010), albeit with considerable scatter.
There is no clear trend between the nebular attenuation A(H)HII and stellar mass (Fig. 5), nor is there any indication that nebular attenuation depends on environment as suggested by past studies (Koyama et al., 2013b; Zeimann et al., 2013). In contrast, the stellar attenuation AV,star,SB (starburst, RV=4.05) does increase with stellar mass (Fig. 5) but with a slope that is shallower than observed in the field at (Price et al., 2014). Our results suggest that the attenuation measured by the integrated stellar light may be less affected by, e.g. patchy dust distribution; however, our sample size is limited. We refer the reader to Reddy et al. (2015) for a more extensive study of dust based on a significantly larger sample of (field) galaxies at .
4.3. Star Formation in the Cluster Core
With our sensitive spectroscopic survey of IRC 0218, we measure extinction-corrected H SFRs for 26 individual members with yr-1; AGN have been removed. Note that an advantage of spectroscopy over using narrow-band imaging to derive H SFRs is that we can remove AGN using [Nii]/H as well as those detected using X-ray. With the 26 cluster galaxies, the lower limit on IRC 0218’s integrated H star formation rate is yr-1 (Table 2). The higher integrated H SFR in the cluster core (Fig. 6) supports our earlier result based on m observations of IRC 0218 (Tran et al., 2010).
A handful of studies have now also obtained H spectroscopy of cluster galaxies at using ground-based telescopes and the WFC3 grism in Hubble Space Telescope. Line sensitivities vary, but the consensus is that most galaxy clusters in this redshift range have integrated SFRs within Rproj Mpc of up to yr-1 and SFRs of individual members can be as high as yr-1 (Hayashi et al., 2011; Zeimann et al., 2013). With an H SFR of yr-1 integrated within Rproj Mpc (Table 2), IRC 0218 is consistent with these measurements.
Our analysis uses the integrated H SFRs within different Rproj (Fig. 6; Table 2) to enable direct comparison to the literature. Note that the integrated H SFR within Rproj is different from the fraction of star-forming members. Because the overall galaxy density is higher in clusters, it is possible to have both a large integrated SFR and an increase in quiescent galaxies relative to the field, e.g. Quadri et al. (2012) and Santos et al. (2014). For example, the H-SFR per square Mpc is highest in the core (Rproj Mpc), but the average SFR per galaxy is only about half that of galaxies at Rproj Mpc (Fig. 6).
Our results confirm that the integrated H SFRs in the cores of galaxy clusters at are significantly higher than in massive galaxy clusters at (Kodama et al., 2004; Finn et al., 2005; Bauer et al., 2011). The astute reader will notice that our H SFRs are lower than the m values published in Tran et al. (2010). For the six IRC 0218 members with both H and m SFRs, the average ratio is , the m SFRs are times higher. However, it is likely that the m SFRs are over-estimated: Papovich et al. (2007) showed that for galaxies at , SFRs based on Chary & Elbaz (2001) templates fitted only to m are higher compared to SFRs determined with m, m, and m.
We note that if we use the m measurements for the six H-detected members, the the number of cluster galaxies with H SFRs yr-1 increases from two to six. Because we are also constrained by the spatial sampling of the NIR spectroscopy, we consider the H SFRs in Table 2 to be lower limits. However, this result is tentative and a larger cluster sample at is needed to better quantify the relation between H and m, especially for SFR yr-1.
4.4. Star Formation Rate versus Stellar Mass
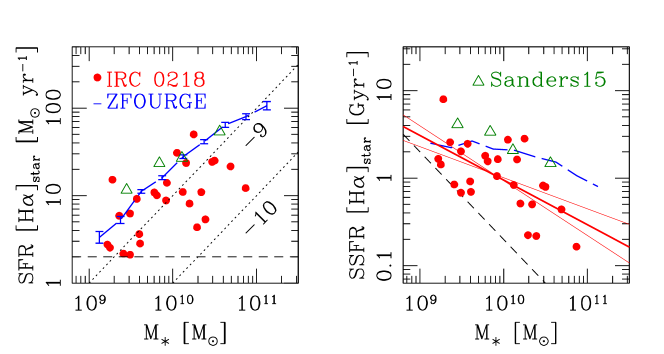
The 26 H-detected cluster galaxies have stellar masses of and show a trend of increasing SFR with stellar mass that is similar to the field (Fig. 7, left), i.e. a “main sequence” of star-forming members (Daddi et al., 2007; Koyama et al., 2013b). Most of the lower-mass cluster galaxies ( ) will more than double their stellar masses given the elapsed cosmic time since if they maintain their current Specific SFRs (SSFR; see also Table 2). Our results are consistent with Zeimann et al. (2013) who use WFC3 grism measurements of H to show that cluster galaxies at follow a SFR- relation.
To determine if the SFR- relation depends on environment, we use the Four-Star Galaxy Evolution (ZFOURGE) survey (Tomczak et al., 2014, Straatman et al., submitted) to select star-forming field galaxies at with SFRs measured by combining UV and mid-IR fluxes Tomczak et al., submitted). Given our H detection limit, we apply a SFR detection threshold of 2 yr-1 to both the IRC 0218 and ZFOURGE samples. We compare H SFRs and the specific star formation rate (SSFR defined to be SFR/) to stellar mass in Fig. 7. We also compare to recent results from MOSDEF based on H measurements of field galaxies at (Sanders et al., 2015).
The IRC 0218 members have systematically lower SFRs compared to the field. However, the difference can be due to using two different methods of measuring SFRs (H vs. UV+MIR; Kennicutt & Evans, 2012). Instead, we consider the slope to test for any environmental difference. By fitting a least-squares to IRC 0218 and bootstrapping the sample ( realizations), we measure the SSFR- slope to be . For the ZFOURGE field galaxies, we measure a shallower slope of . The difference in the SSFR- slope between IRC 0218 and ZFOURGE suggests that environment plays a role, but our results are not statistically significant.
An alternate comparison is to Sanders et al. (2015) who measure H SFRs for the field at (Fig. 7. The IRC 0218 members are clearly offset to lower SFRs compared to the H-detected field galaxies. One possible explanation for the lower SFRs in IRC 0218 is the elapsed cosmic time between and ( Gyr). However, the offset in the SFR- relation for MOSDEF field galaxies at at (Kriek et al., 2015) is not as significant as observed in IRC 0218. We conclude that our observations indicate a dependence on environment, i.e. lower SFRs in the cluster especially for the higher mass members.
4.5. Gas Phase Metallicity-Mass Relation (MZR)
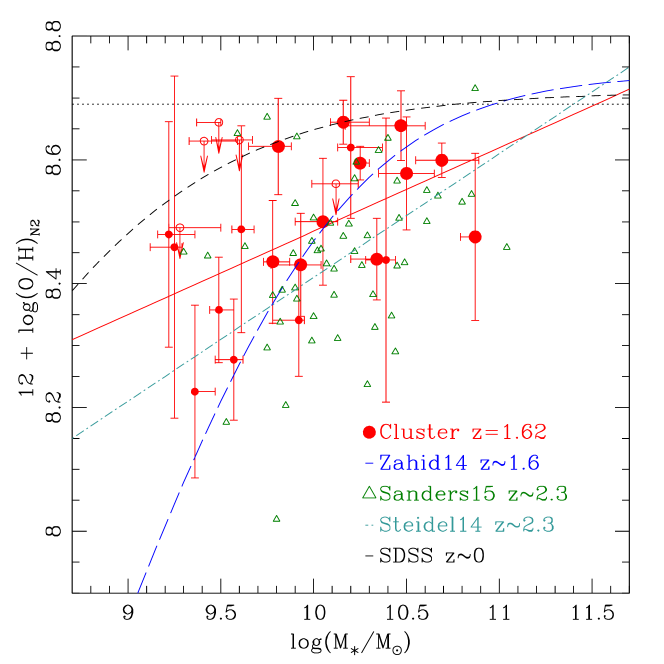
There is considerable and confusing disagreement over the observed relation between gas phase metallicity and stellar mass (MZR) at . While several studies of field and protocluster galaxies find that metallicities increase with stellar mass (Zahid et al., 2014; Steidel et al., 2014; Shimakawa et al., 2015), others do not (Stott et al., 2013; Kulas et al., 2013). Using the N2 method calibrated by Pettini & Pagel (2004), we measure the oxygen abundance in cluster galaxies and compare to their stellar masses (Figs. 8 & 9). We find that the IRC 0218 members are offset to lower metallicities relative to star-forming galaxies in the local universe (Tremonti et al., 2004).
The cluster MZR is remarkably similar to that of several field surveys at (Erb et al., 2006a; Steidel et al., 2014; Sanders et al., 2015; Zahid et al., 2014); this is particularly evident when comparing the stacked spectra (Fig. 9). To quantify the trend of increasing metallicity with stellar mass, we fit a linear least-squares to the 20 members with measured [Nii]/H (we exclude the five members with only upper limits on [Nii]):
| (10) |
where . The MZR in IRC 0218 is comparable to the relation measured by Steidel et al. (2014) for field galaxies at where the slope and normalization are . The consistency holds across the full range in mass []. For these 20 members, the median difference between measured [Nii] and that predicted using the fit from Zahid et al. (2014) for field galaxies at is only .
Whether there is an environmental imprint on the MZR at is yet to be clearly established. Ellison et al. (2009) detect a small offset of dex to higher metallicities in overdense environments at (see also Cooper et al., 2008; Peng & Maiolino, 2014), and recent studies at claim to find a measurable offset between their cluster and field samples (Valentino et al., 2014; Shimakawa et al., 2015). However, we find no evidence of an environmental dependence for the MZR when comparing IRC 0218 to the field at .
What is striking is how the cluster MZR does not evolve at (over Gyr): IRC 0218’s MZR is virtually identical to the COSMOS cluster at (Fig. 9; Kacprzak et al., 2015). The similarity of the cluster MZRs matches the essentially constant gas metallicities of lensed field galaxies at (Yuan et al., 2013). Our results are also in line with the slow evolution of the MZR predicted by simulations (Davé et al., 2011a), but we note that these same simulations also predict an environmental imprint, e.g. higher metallicities at a given stellar mass, that we do not observe in either galaxy cluster.
Our results show that the cluster MZR and its evolution is indistinguishable from that of the field at which is consistent with predictions from recent simulations by Taylor & Kobayashi (2015). We conclude that the somewhat contradictory results observed thus far for the MZR at are due to a combination of different line flux sensitivities and sample sizes of the various studies. By expanding our sensitive survey of cluster galaxies at and comparing to results from MOSDEF (Kriek et al., 2015), we hope to resolve these disagreements.
4.6. Star Formation Rates and the MZR
Studies at low redshift find that at a given stellar mass, the gas metallicity is lower for galaxies with higher star formation rates (Mannucci et al., 2010; Andrews & Martini, 2013). The Fundamental Mass-Metallicity relation (FMR) quantifies this dependence of the MZR on the SFR and can be explained by a SFR dependence on the ratio of self-enrichment versus inflow of pristine gas. Whether the FMR holds at is unclear with recent studies finding no evidence of an MZR dependence on SFR (Wuyts et al., 2014; Sanders et al., 2015). Evidence for an environmental dependence for the FMR at is also tentative at best (Shimakawa et al., 2015).
To test for a dependence on SFR, we divide the IRC 0218 members into approximately equal sized low and high SFR bins (SFR[H yr-1; Fig. 8); we exclude the five members that have only upper limits on their gas metallicities because their true values could be considerably lower. At high stellar masses [], the high SF members dominate with a metallicity range of dex. At low stellar masses, the low SF members dominate with a larger metallicity range of dex.
We fit a least-squares to the 11 high SFR members and the 9 low SFR members with measured [Nii] and measure slopes with errors of and respectively. The MZR for both low and high SFR bins are consistent (within ) with that of the cluster sample as a whole as well as the MZR measured by Steidel et al. (2014). We conclude that the IRC 0218 members show no evidence of an MZR dependence on the SFR, but we acknowledge that our cluster sample is limited.
5. Evidence of Environmental Dependence?
With our NIR spectroscopy, we measure H and [Nii] fluxes that, combined with our SED fits from FAST, provides extinction-corrected H star formation rates, gas phase metallicities from [Nii]/H, and stellar masses. The primary evidence we find for any environmental dependence is in the cluster star formation rates. IRC 0218’s integrated H SFR per unit area is about a factor of three higher at Rproj Mpc compared to Rproj Mpc (from 144 to 26 yr-1 Mpc-2; Table 2). This is driven by the higher number density of star-forming galaxies in the cluster core relative to studies of cluster cores at lower redshifts (Tran et al., 2007; Mei et al., 2009). However, the average H SFR per galaxy is actually lower in the core compared to the values at Rproj and 1 Mpc (Table 2; see also Brodwin et al., 2013).
At a given stellar mass, the IRC 0218 members have H SFRs that are lower compared to the field at (Fig. 7). The slope of the SFR- relation also seems to depend on environment such that the massive cluster galaxies have lower SFRs compared to their field counterparts. The quenching of SF in the massive cluster galaxies at means these members will passively age to match their cluster counterparts at (Mei et al., 2009). The continued stellar growth for lower mass cluster galaxies is also consistent with the more extended star formation histories measured in cluster galaxies at (Tran et al., 2005a, 2007).
Like field galaxies at , the cluster galaxies show an increasing amount of attenuation with stellar mass, more massive galaxies are dustier. This trends hold primarily for the stellar attenuation (AV,star,SB) as measured by the SED fitting to the multi-wavelength photometry (Fig. 5). However, the large scatter in both in IRC 0218 and field studies (Yoshikawa et al., 2010; Price et al., 2014) is sobering, particular when comparing the nebular attenuation A(H)HII to . It is very likely that the empirical relations used to determine attenuation and thus obtain extinction-corrected SFRs at have uncomfortably large uncertainties and depend on SFRs (e.g. Reddy et al., 2015). A better characterization of dust attenuation laws for difference spectral types at using essentially low resolution spectroscopy (Kriek & Conroy, 2013) holds promise in addressing this issue.
The gas phase metallicity versus (MZR) for IRC 0218 members is nearly identical to the field at (Figs. 8 & 9). The cluster MZR does not depend on SFR which is also consistent with field results (Wuyts et al., 2014; Steidel et al., 2014; Sanders et al., 2015). Comparing to our results for the COSMOS cluster at (Kacprzak et al., 2015) shows no evolution in the MZR in the Gyr. Our ZFIRE cluster results contradict recent claims at of a measurable difference in the MZR with environment (Kulas et al., 2013; Shimakawa et al., 2015). We note that the environmental imprint on the MZR is small even using SDSS at (Cooper et al., 2008; Ellison et al., 2009; Peng & Maiolino, 2014), thus if there is an environmental dependence for the MZR at , a considerably larger sample of cluster galaxies is needed to detect it.
Alternatively, calibration issues with using [Nii]/H to measure gas phase metallicities at may mask any environmental imprint on the MZR. For example, Kewley & Ellison (2008) showed that the choice of line ratios used to measure the gas-phase metallicity has a significant effect on the shape of the MZR. By obtaining the full suite of emission lines for the BPT diagram (Baldwin et al., 1981) to separate star-forming galaxies from those hosting AGN, we can compare to metallicities using alternative line ratios such as H/[Oiii] (e.g. Shapley et al., 2014). We can also characterize the ionization conditions. If there is a relationship between SSFR and ionization parameter, this would have interesting implications for the properties of star clusters at high redshift, e.g. the spatial distribution and masses of stars embedded within them (Kewley et al., 2015). By expanding our survey of cluster galaxies at , we will explore how gas metallicities and ionization parameters are linked to star formation, galaxy (stellar) mass, and environment.
6. Conclusions
We survey the galaxy cluster IRC 0218 using the multi-object spectrographs LRIS (optical) and MOSFIRE (near-IR) on Keck I. We obtain 130 unique redshifts based mostly on emission lines, e.g. [Oii] and H, and identify 45 galaxies with (Figs. 1 & 2). The IRC 0218 members define a narrow redshift distribution with 33 galaxies at . The corresponding cluster redshift and velocity dispersion are and km s-1.
While IRC 0218’s velocity dispersion is the lowest measured thus far for a cluster at , it is consistent with the inferred from the cluster mass estimate of M from the weak X-ray detection (Pierre et al., 2012). Simulations also show that most systems with this velocity dispersion and redshift will evolve into a cluster by . IRC 0218 is spatially concentrated with 20 spectroscopically confirmed members within Rproj Mpc of the BCG. The cluster’s high spatial concentration and low velocity dispersion are conducive to galaxy-galaxy merging (Rudnick et al., 2012; Lotz et al., 2013).
With MOSFIRE, we reach near-IR line flux sensitivities of 0.3 erg s-1 cm-2 that, combined with our SED fits to multi-wavelength photometry, provide extinction-corrected H star formation rates, gas phase metallicities using [Nii]/H, and stellar masses. Adopting a H SFR limit of 2 yr-1 at and removing AGN, we confirm our earlier result based on m observations of elevated star formation in IRC 0218’s core (Tran et al., 2010): the integrated SFR per unit area at Rproj Mpc is about a factor of three larger than at Rproj Mpc (Fig 6; Table 2). We consider the H SFRs to be lower limits due to sparse sampling and because for the handful of objects where we also can measure the Balmer decrement and/or m flux, the individual SFRs increase by .
In our analysis, the strongest evidence for any environmental dependence at is in the cluster star formation rates. The high H SFR in the core (Rproj Mpc; Fig. 6) is driven by the concentration of star-forming members while the average SFR per galaxy in the core is actually half that of galaxies at Rproj Mpc (Table 2). The massive cluster galaxies also tend to have lower SFRs compared to their field counterparts (Fig. 7). This mass-dependent quenching of SF is needed for these cluster galaxies to match the stellar ages of their cluster counterparts at ( Tran et al., 2007; Mei et al., 2009).
Like the field, the IRC 0218 members show a trend of increasing attenuation with stellar mass as measured by the SED fits (AV,star,SB), more massive galaxies are dustier (Fig. 5). However, this is not the case when using the nebular attenuation as measured by the Balmer decrement (A(H)HII). The significant scatter in the nebular attenuation suggests larger problems with correctly measuring dust attenuation at for both cluster and field galaxies (see also Reddy et al., 2015).
The gas phase metallicity versus stellar mass (MZR) for the cluster galaxies is virtually identical to the field at , and both are offset to lower metallicities compared to galaxies at (Figs. 8 & 9). Comparing to the fit determined by Zahid et al. (2014) for field galaxies at , the median difference between measured and predicted [Nii] is only . Fitting a least squares to the IRC 0218 members confirms that their MZR is the same as for the field as measured by, Steidel et al. (2014) at . The cluster MZR does not depend on star formation rate which is also consistent with recent results on field galaxies (Wuyts et al., 2014; Sanders et al., 2015).
Particularly striking is that IRC 0218 and the COSMOS cluster at (Kacprzak et al., 2015) have the same MZR even though the elapsed time is Gyr. Both clusters’ MZRs are also well-matched to the field as measured by several surveys at . We do not see any evidence of an environmental imprint on the MZR at as indicated by previous studies (Kulas et al., 2013; Shimakawa et al., 2015). We attribute this difference to our combination of a larger cluster sample with a more sensitive line flux limit.
In summary, environmental effects are likely to be subtle at and require a larger survey of cluster galaxies to fully characterize. With ZFIRE, we are building such a cluster sample and also expanding to include additional line diagnostics needed to test, the reliability of [Nii]/H for measuring gas phase metallicity. ZFIRE complements ongoing NIR spectroscopic surveys of field galaxies at , KBSS (Steidel et al., 2014), MOSDEF (Kriek et al., 2015), and KMOS3D (Wisnioski et al., 2015), and will enable us to test for evolution in spatially resolved quantities as a function of environment.
References
- Andrews & Martini (2013) Andrews, B. H. & Martini, P. 2013, ApJ, 765, 140
- Asplund et al. (2009) Asplund, M., Grevesse, N., Sauval, A. J., & Scott, P. 2009, ARA&A, 47, 481
- Baldwin et al. (1981) Baldwin, J. A., Phillips, M. M., & Terlevich, R. 1981, PASP, 93, 5
- Bassett et al. (2013) Bassett, R., Papovich, C., Lotz, J. M., Bell, E. F., Finkelstein, S. L., Newman, J. A., Tran, K.-V., Almaini, O., Lani, C., Cooper, M., Croton, D., Dekel, A., Ferguson, H. C., Kocevski, D. D., Koekemoer, A. M., Koo, D. C., McGrath, E. J., McIntosh, D. H., & Wechsler, R. 2013, ApJ, 770, 58
- Bauer et al. (2011) Bauer, A. E., Gr tzbauch, R., J rgensen, I., Varela, J., & Bergmann, M. 2011, Monthly Notices of the Royal Astronomical Society, 411, 2009
- Bayliss et al. (2014) Bayliss, M. B., Ashby, M. L. N., Ruel, J., Brodwin, M., Aird, K. A., Bautz, M. W., Benson, B. A., Bleem, L. E., & et al. 2014, ApJ, 794, 12
- Beers et al. (1990) Beers, T. C., Flynn, K., & Gebhardt, K. 1990, AJ, 100, 32
- Brammer et al. (2012) Brammer, G. B., van Dokkum, P. G., Franx, M., Fumagalli, M., Patel, S., Rix, H.-W., Skelton, R. E., Kriek, M., Nelson, E., Schmidt, K. B., Bezanson, R., & et al. 2012, ApJS, 200, 13
- Brodwin et al. (2013) Brodwin, M., Stanford, S. A., Gonzalez, A. H., Zeimann, G. R., Snyder, G. F., Mancone, C. L., & et al. 2013, ArXiv e-prints
- Calzetti et al. (2000) Calzetti, D., Armus, L., Bohlin, R. C., Kinney, A. L., Koornneef, J., & Storchi-Bergmann, T. 2000, ApJ, 533, 682
- Cardelli et al. (1989) Cardelli, J. A., Clayton, G. C., & Mathis, J. S. 1989, ApJ, 345, 245
- Chabrier (2003) Chabrier, G. 2003, PASP, 115, 763
- Chary & Elbaz (2001) Chary, R. & Elbaz, D. 2001, ApJ, 556, 562
- Chiang et al. (2013) Chiang, Y.-K., Overzier, R., & Gebhardt, K. 2013, ApJ, 779, 127
- Cooper et al. (2008) Cooper, M. C., Tremonti, C. A., Newman, J. A., & Zabludoff, A. I. 2008, MNRAS, 390, 245
- Daddi et al. (2007) Daddi, E., Dickinson, M., Morrison, G., Chary, R., & et al. 2007, ApJ, 670, 156
- Davé et al. (2011a) Davé, R., Finlator, K., & Oppenheimer, B. D. 2011a, MNRAS, 416, 1354
- Davé et al. (2011b) Davé, R., Oppenheimer, B. D., & Finlator, K. 2011b, ArXiv e-prints
- Eisenhardt et al. (2008) Eisenhardt, P. R. M., Brodwin, M., Gonzalez, A. H., Stanford, S. A., & et al. 2008, ApJ, 684, 905
- Ellison et al. (2009) Ellison, S. L., Simard, L., Cowan, N. B., Baldry, I. K., Patton, D. R., & McConnachie, A. W. 2009, MNRAS, 396, 1257
- Erb et al. (2006a) Erb, D. K., Shapley, A. E., Pettini, M., Steidel, C. C., Reddy, N. A., & Adelberger, K. L. 2006a, ApJ, 644, 813
- Erb et al. (2006b) Erb, D. K., Steidel, C. C., Shapley, A. E., Pettini, M., Reddy, N. A., & Adelberger, K. L. 2006b, ApJ, 647, 128
- Evrard et al. (2008) Evrard, A. E., Bialek, J., Busha, M., White, M., Habib, S., Heitmann, K., Warren, M., Rasia, E., Tormen, G., Moscardini, L., Power, C., Jenkins, A. R., Gao, L., Frenk, C. S., Springel, V., White, S. D. M., & Diemand, J. 2008, ApJ, 672, 122
- Finn et al. (2005) Finn, R. A., Zaritsky, D., McCarthy, Jr., D. W., Poggianti, B., Rudnick, G., Halliday, C., Milvang-Jensen, B., Pelló, R., & Simard, L. 2005, ApJ, 630, 206
- Garn & Best (2010) Garn, T. & Best, P. N. 2010, MNRAS, 409, 421
- Genel et al. (2014) Genel, S., Vogelsberger, M., Springel, V., Sijacki, D., Nelson, D., Snyder, G., Rodriguez-Gomez, V., Torrey, P., & Hernquist, L. 2014, MNRAS, 445, 175
- Gerke et al. (2005) Gerke, B. F., Newman, J. A., Davis, M., Marinoni, C., Yan, R., Coil, A. L., Conroy, C., Cooper, M. C., Faber, S. M., Finkbeiner, D. P., Guhathakurta, P., Kaiser, N., Koo, D. C., Phillips, A. C., Weiner, B. J., & Willmer, C. N. A. 2005, ApJ, 625, 6
- Gobat et al. (2013) Gobat, R., Strazzullo, V., Daddi, E., Onodera, M., & et al. 2013, ApJ, 776, 9
- Gonzalez et al. (2012) Gonzalez, A. H., Stanford, S. A., Brodwin, M., Fedeli, C., Dey, A., Eisenhardt, P. R. M., Mancone, C., Stern, D., & Zeimann, G. 2012, ApJ, 753, 163
- Hao et al. (2011) Hao, C.-N., Kennicutt, R. C., Johnson, B. D., Calzetti, D., Dale, D. A., & Moustakas, J. 2011, ApJ, 741, 124
- Hayashi et al. (2011) Hayashi, M., Kodama, T., Koyama, Y., Tadaki, K.-i., & Tanaka, I. 2011, Monthly Notices of the Royal Astronomical Society, 415, 2670
- Hewett et al. (2006) Hewett, P. C., Warren, S. J., Leggett, S. K., & Hodgkin, S. T. 2006, MNRAS, 367, 454
- Hilton et al. (2010) Hilton, M., Lloyd-Davies, E., Stanford, S. A., Stott, J. P., Collins, C. A., Romer, A. K., Hosmer, M., & et al. 2010, ApJ, 718, 133
- Kacprzak et al. (2015) Kacprzak, G., Nanayakkara, T., Yuan, T., Tran, K.-V. H., & et al. 2015, ApJ, submitted
- Kashino et al. (2013) Kashino, D., Silverman, J. D., Rodighiero, G., Renzini, A., Arimoto, N., Daddi, E., Lilly, S. J., & et al. 2013, ApJ, 777, L8
- Kelson (1998) Kelson, D. D. 1998, Ph.D. thesis, University of California at Santa Cruz (Santa Cruz, CA: University of California)
- Kelson (2003) Kelson, D. D. 2003, PASP, 115, 688
- Kennicutt (1998) Kennicutt, R. C. 1998, ARA&A, 36, 189
- Kennicutt & Evans (2012) Kennicutt, R. C. & Evans, N. J. 2012, ARA&A, 50, 531
- Kewley et al. (2015) Kewley, L., Yuan, T., Nanayakkara, T., Kacrpzak, G., & et al. 2015, ApJ, submitted
- Kewley & Ellison (2008) Kewley, L. J. & Ellison, S. L. 2008, ApJ, 681, 1183
- Kimura et al. (2010) Kimura, M., Maihara, T., Iwamuro, F., Akiyama, M., Tamura, N., Dalton, G. B., Takato, N., Tait, P., & et al. 2010, PASJ, 62, 1135
- Kodama et al. (2004) Kodama, T., Balogh, M. L., Smail, I., Bower, R. G., & Nakata, F. 2004, MNRAS, 354, 1103
- Koyama et al. (2013a) Koyama, Y., Kodama, T., Tadaki, K.-i., Hayashi, M., Tanaka, M., Smail, I., Tanaka, I., & Kurk, J. 2013a, MNRAS, 428, 1551
- Koyama et al. (2013b) Koyama, Y., Smail, I., Kurk, J., Geach, J. E., Sobral, D., Kodama, T., Nakata, F., Swinbank, A. M., Best, P. N., Hayashi, M., & Tadaki, K.-i. 2013b, MNRAS, 434, 423
- Kriek & Conroy (2013) Kriek, M. & Conroy, C. 2013, ApJ, 775, L16
- Kriek et al. (2015) Kriek, M., Shapley, A. E., Reddy, N. A., Siana, B., Coil, A. L., Mobasher, B., Freeman, W. R., de Groot, L., & et al. 2015, ArXiv e-prints
- Kriek et al. (2009) Kriek, M., van Dokkum, P. G., Labbé, I., Franx, M., Illingworth, G. D., Marchesini, D., & Quadri, R. F. 2009, ApJ, 700, 221
- Kroupa (2001) Kroupa, P. 2001, MNRAS, 322, 231
- Kulas et al. (2013) Kulas, K. R., McLean, I. S., Shapley, A. E., & et al. 2013, ApJ, 774, 130
- Kurtz et al. (1992) Kurtz, M. J., Mink, D. J., Wyatt, W. F., Fabricant, D. G., Torres, G., Kriss, G. A., & Tonry, J. L. 1992, in Astronomical Data Analysis Software and Systems I, ed. d. M. Worrall, C. Biemesderfer, & J. Barnes, Vol. 25 (A.S.P. Conference Series), 432
- Lawrence et al. (2007) Lawrence, A., Warren, S. J., Almaini, O., Edge, A. C., Hambly, N. C., Jameson, R. F., Lucas, P., & Casali, M. a. a. 2007, MNRAS, 379, 1599
- Lotz et al. (2013) Lotz, J. M., Papovich, C., Faber, S. M., Ferguson, H. C., Grogin, N., Guo, Y., Kocevski, D., Koekemoer, A. M., Lee, K.-S., McIntosh, D., Momcheva, I., Rudnick, G., Saintonge, A., Tran, K.-V., van der Wel, A., & Willmer, C. 2013, ApJ, 773, 154
- Mannucci et al. (2010) Mannucci, F., Cresci, G., Maiolino, R., Marconi, A., & Gnerucci, A. 2010, MNRAS, 408, 2115
- McLean et al. (2012) McLean, I. S., Steidel, C. C., Epps, H. W., Konidaris, N., & et al. 2012, in Society of Photo-Optical Instrumentation Engineers (SPIE) Conference Series, Vol. 8446, Society of Photo-Optical Instrumentation Engineers (SPIE) Conference Series
- Mei et al. (2009) Mei, S., Holden, B. P., Blakeslee, J. P., Ford, H. C., Franx, M., Homeier, N. L., Illingworth, G. D., & et al. 2009, ApJ, 690, 42
- Mei et al. (2015) Mei, S., Scarlata, C., Pentericci, L., Newman, J. A., Weiner, B. J., Ashby, M. L. N., Castellano, M., Conselice, C. J., Finkelstein, S. L., Galametz, A., Grogin, N. A., Koekemoer, A. M., Huertas-Company, M., Lani, C., Lucas, R. A., Papovich, C., Rafelski, M., & Teplitz, H. I. 2015, ApJ, 804, 117
- Milvang-Jensen et al. (2008) Milvang-Jensen, B., Noll, S., Halliday, C., Poggianti, B. M., & et al. 2008, A&A, 482, 419
- Moustakas et al. (2011) Moustakas, J., Zaritsky, D., Brown, M., Cool, R., Dey, A., Eisenstein, D. J., Gonzalez, A. H., Jannuzi, B., Jones, C., Kochanek, C. S., Murray, S. S., & Wild, V. 2011, ArXiv e-prints
- Muzzin et al. (2012) Muzzin, A., Wilson, G., Yee, H. K. C., Gilbank, D., & et al. 2012, ApJ, 746, 188
- Newman et al. (2014) Newman, A. B., Ellis, R. S., Andreon, S., Treu, T., Raichoor, A., & Trinchieri, G. 2014, ApJ, 788, 51
- Noeske et al. (2007) Noeske, K. G., Weiner, B. J., Faber, S. M., Papovich, C., Koo, D. C., Somerville, R. S., Bundy, K., Conselice, C. J., & et al. 2007, ApJ, 660, L43
- Oke et al. (1995) Oke, J. B., Cohen, J. G., Carr, M., Cromer, J., Dingizian, A., Harris, F. H., Labrecque, S., Luciano, R., Schaal, W., Epps, H., & Miller, J. 1995, PASP, 107, 375
- Osterbrock (1989) Osterbrock, D. E. 1989, Astrophysics of gaseous nebulae and active galactic nuclei
- Papovich et al. (2012) Papovich, C., Bassett, R., Lotz, J. M., van der Wel, A., Tran, K.-V., Finkelstein, S. L., Bell, E. F., & et al. 2012, ApJ, 750, 93
- Papovich et al. (2010) Papovich, C., Momcheva, I., Willmer, C. N. A., Finkelstein, K. D., Finkelstein, S. L., Tran, K., & et al. 2010, ApJ, 716, 1503
- Papovich et al. (2007) Papovich, C., Rudnick, G., Le Floc’h, E., van Dokkum, P. G., Rieke, G. H., Taylor, E. N., Armus, L., Gawiser, E., Huang, J., Marcillac, D., & Franx, M. 2007, ApJ, 668, 45
- Peng et al. (2010) Peng, Y.-j., Lilly, S. J., Kovač, K., Bolzonella, M., Pozzetti, L., Renzini, A., Zamorani, G., Ilbert, O., & et al. 2010, ApJ, 721, 193
- Peng & Maiolino (2014) Peng, Y.-j. & Maiolino, R. 2014, MNRAS, 438, 262
- Pettini & Pagel (2004) Pettini, M. & Pagel, B. E. J. 2004, MNRAS, 348, L59
- Pierre et al. (2012) Pierre, M., Clerc, N., Maughan, B., Pacaud, F., Papovich, C., & Willmer, C. N. A. 2012, A&A, 540, A4
- Popesso et al. (2012) Popesso, P., Biviano, A., Rodighiero, G., Baronchelli, I., Salvato, M., Saintonge, A., Finoguenov, A., Magnelli, B., & et al. 2012, A&A, 537, A58
- Price et al. (2014) Price, S. H., Kriek, M., Brammer, G. B., Conroy, C., & et al. 2014, ApJ, 788, 86
- Quadri et al. (2012) Quadri, R. F., Williams, R. J., Franx, M., & Hildebrandt, H. 2012, ApJ, 744, 88
- Reddy et al. (2015) Reddy, N. A., Kriek, M., Shapley, A. E., Freeman, W. R., Siana, B., Coil, A. L., Mobasher, B., Price, S. H., Sanders, R. L., & Shivaei, I. 2015, ArXiv e-prints
- Rudnick et al. (2012) Rudnick, G. H., Tran, K.-V., Papovich, C., Momcheva, I., & Willmer, C. 2012, ApJ, 755, 14
- Sanders et al. (2015) Sanders, R. L., Shapley, A. E., Kriek, M., Reddy, N. A., Freeman, W. R., Coil, A. L., Siana, B., Mobasher, B., Shivaei, I., Price, S. H., & de Groot, L. 2015, ApJ, 799, 138
- Santos et al. (2014) Santos, J. S., Altieri, B., Tanaka, M., Valtchanov, I., Saintonge, A., Dickinson, M., Foucaud, S., Kodama, T., Rawle, T. D., & Tadaki, K. 2014, MNRAS, 438, 2565
- Schaye et al. (2015) Schaye, J., Crain, R. A., Bower, R. G., Furlong, M., Schaller, M., Theuns, T., Dalla Vecchia, C., & et al. 2015, MNRAS, 446, 521
- Schindler et al. (1999) Schindler, S., Binggeli, B., & Böhringer, H. 1999, A&A, 343, 420
- Shapley et al. (2014) Shapley, A. E., Reddy, N. A., Kriek, M., Freeman, W. R., Sanders, R. L., Siana, B., Coil, A. L., Mobasher, B., Shivaei, I., Price, S. H., & de Groot, L. 2014, ArXiv e-prints
- Sharples et al. (2013) Sharples, R., Bender, R., Agudo Berbel, A., Bezawada, N., Castillo, R., Cirasuolo, M., Davidson, G., Davies, R., & et al. 2013, The Messenger, 151, 21
- Shattow et al. (2013) Shattow, G. M., Croton, D. J., Skibba, R. A., Muldrew, S. I., Pearce, F. R., & Abbas, U. 2013, MNRAS, 433, 3314
- Shimakawa et al. (2015) Shimakawa, R., Kodama, T., Tadaki, K.-i., Hayashi, M., Koyama, Y., & Tanaka, I. 2015, MNRAS, 448, 666
- Shimakawa et al. (2014) Shimakawa, R., Kodama, T., Tadaki, K.-i., Tanaka, I., Hayashi, M., & Koyama, Y. 2014, MNRAS, 441, L1
- Spitler et al. (2012) Spitler, L. R., Labbé, I., Glazebrook, K., & et al. 2012, ApJ, 748, L21
- Steidel et al. (2014) Steidel, C. C., Rudie, G. C., Strom, A. L., Pettini, M., Reddy, N. A., Shapley, A. E., Trainor, R. F., Erb, D. K., Turner, M. L., Konidaris, N. P., Kulas, K. R., Mace, G., Matthews, K., & McLean, I. S. 2014, ApJ, 795, 165
- Stott et al. (2013) Stott, J. P., Sobral, D., Bower, R., Smail, I., Best, P. N., Matsuda, Y., Hayashi, M., Geach, J. E., & Kodama, T. 2013, MNRAS, 436, 1130
- Tadaki et al. (2012) Tadaki, K.-i., Kodama, T., Ota, K., & et al. 2012, MNRAS, 423, 2617
- Tanaka et al. (2013) Tanaka, M., Finoguenov, A., Mirkazemi, M., Wilman, D. J., Mulchaey, J. S., Ueda, Y., Xue, Y., Brandt, W. N., & Cappelluti, N. 2013, PASJ, 65, 17
- Taylor & Kobayashi (2015) Taylor, P. & Kobayashi, C. 2015, MNRAS, 448, 1835
- Tomczak et al. (2014) Tomczak, A. R., Quadri, R. F., Tran, K.-V. H., Labbé, I., Straatman, C. M. S., Papovich, C., Glazebrook, K., Allen, R., Brammer, G. B., Kacprzak, G. G., Kawinwanichakij, L., Kelson, D. D., McCarthy, P. J., Mehrtens, N., Monson, A. J., Persson, S. E., Spitler, L. R., Tilvi, V., & van Dokkum, P. 2014, ApJ, 783, 85
- Tonnesen & Cen (2014) Tonnesen, S. & Cen, R. 2014, ApJ, 788, 133
- Tran et al. (2010) Tran, K., Papovich, C., Saintonge, A., & et al. 2010, ApJ, 719, L126
- Tran et al. (2005a) Tran, K. H., van Dokkum, P., Illingworth, G. D., Kelson, D., Gonzalez, A., & Franx, M. 2005a, ApJ, 619, 134
- Tran et al. (2007) Tran, K.-V. H., Franx, M., Illingworth, G. D., van Dokkum, P., Kelson, D. D., Blakeslee, J. P., & Postman, M. 2007, ApJ, 661, 750
- Tran et al. (2005b) Tran, K.-V. H., van Dokkum, P., Franx, M., Illingworth, G. D., Kelson, D. D., & Schreiber, N. M. F. 2005b, ApJ, 627, L25
- Tremonti et al. (2004) Tremonti, C. A., Heckman, T. M., Kauffmann, G., Brinchmann, J., Charlot, S., White, S. D. M., & et al. 2004, ApJ, 613, 898
- Valentino et al. (2014) Valentino, F., Daddi, E., Strazzullo, V., Gobat, R., Onodera, M., Bournaud, F., Juneau, S., Renzini, A., Arimoto, N., Carollo, M., & Zanella, A. 2014, ArXiv e-prints
- Wetzel et al. (2012) Wetzel, A. R., Tinker, J. L., & Conroy, C. 2012, MNRAS, 424, 232
- Whitaker et al. (2011) Whitaker, K. E., Labbé, I., van Dokkum, P. G., & et al. 2011, ApJ, 735, 86
- Williams et al. (2009) Williams, R. J., Quadri, R. F., Franx, M., van Dokkum, P., & Labbé, I. 2009, ApJ, 691, 1879
- Wisnioski et al. (2015) Wisnioski, E., Förster Schreiber, N. M., Wuyts, S., Wuyts, E., Bandara, K., Wilman, D., Genzel, R., & et al. 2015, ApJ, 799, 209
- Wong et al. (2014) Wong, K. C., Tran, K.-V. H., Suyu, S. H., Momcheva, I. G., Brammer, G. B., Brodwin, M., Gonzalez, A. H., Halkola, A., Kacprzak, G. G., Koekemoer, A. M., Papovich, C. J., & Rudnick, G. H. 2014, ApJ, 789, L31
- Wuyts et al. (2014) Wuyts, E., Kurk, J., Förster Schreiber, N. M., Genzel, R., Wisnioski, E., Bandara, K., Wuyts, S., & et al. 2014, ApJ, 789, L40
- Yoshikawa et al. (2010) Yoshikawa, T., Akiyama, M., Kajisawa, M., Alexander, D. M., & et al. 2010, ApJ, 718, 112
- Yuan et al. (2014) Yuan, T., Nanayakkara, T., Kacprzak, G. G., Tran, K.-V. H., Glazebrook, K., Kewley, L. J., Spitler, L. R., Poole, G. B., Labbé, I., Straatman, C. M. S., & Tomczak, A. R. 2014, ApJ, 795, L20
- Yuan et al. (2013) Yuan, T.-T., Kewley, L. J., & Richard, J. 2013, ApJ, 763, 9
- Zahid et al. (2014) Zahid, H. J., Kashino, D., Silverman, J. D., Kewley, L. J., Daddi, E., Renzini, A., Rodighiero, G., & et al. 2014, ApJ, 792, 75
- Zeimann et al. (2013) Zeimann, G. R., Stanford, S. A., Brodwin, M., Gonzalez, A. H., Mancone, C., Snyder, G. F., Stern, D., Eisenhardt, P., Dey, A., & Moustakas, J. 2013, ApJ, 779, 137