Current affiliation: ]Department of Physics, California Institute of Technology, Pasadena, California 91125, USA
Doping evolution and polar surface reconstruction of the infinite-layer cuprate Sr1-xLaxCuO2
Abstract
We use angle-resolved photoemission spectroscopy to study the doping evolution of infinite-layer Sr1-xLaxCuO2 thin films grown by molecular-beam epitaxy. At low doping, the material exhibits a dispersive lower Hubbard band typical of the superconducting cuprate parent compounds. As carriers are added to the system, a continuous evolution from charge-transfer insulator to superconductor is observed, with the initial lower Hubbard band pinned well below the Fermi level and the development of a coherent low-energy band with electron doping. This two-component spectral function emphasizes the important role that strong local correlations play even at relatively high doping levels. Electron diffraction probes reveal a surface reconstruction of the material at low doping levels. Using a number of simple assumptions, we develop a model of this reconstruction based on the polar nature of the infinite-layer structure. Finally, we provide evidence for a thickness-controlled transition in ultrathin films of SrCuO2 grown on nonpolar SrTiO3, highlighting the diverse structural changes that can occur in polar complex oxide thin films.
pacs:
74.25.Jb, 74.72.Cj, 74.72.Ek, 79.60.BmI Introduction
The generic aspects of the hole-doped side of the cuprate phase diagram have been firmly established by investigating a multitude of hole-doped material families. In contrast, there exist only two families from which most of our understanding of electron doping in the cuprates is derived: Re2-xCexCuO4, where Re is a rare earth element, and “infinite-layer” Sr1-xLaxCuO2 armitage2010 . One conspicuous difference between electron and hole doping is the strength of antiferromagnetic order, which can persist up to an electron doping of luke1990 and may even coexist with superconductivity in some materials yamada2003 ; alff2003 ; harter2012 . In all of the hole-doped cuprates, on the other hand, antiferromagnetism is rapidly suppressed by and does not coexist with superconductivity. These facts highlight a clear asymmetry in the doping phase diagram of the cuprates, with important ramifications for theories of high-temperature superconductivity. Sr1-xLaxCuO2 is an ideal material for studying electron doping in the cuprates because of its uncomplicated structure, which consists of perfectly square and flat CuO2 planes separated by simple Sr1-xLax charge reservoir layers.
Bulk growth of Sr1-xLaxCuO2 is limited to polycrystalline samples due to the required high growth pressures. High quality thin films, however, can be grown by taking advantage of epitaxial stabilization tsukahara1991 ; norton1994 ; karimoto2001 ; karimoto2004 ; leca2006 . Indeed, within the last decade, complex oxide thin films have attracted increasing attention for the diverse electronic systems that they host heber2009 ; mannhart2010 . Polar structures with alternating charged atomic planes are particularly prevalent among the array of oxide structures commonly studied ohtomo2004 ; nakagawa2006 ; reyren2007 . As thin films of these materials are grown, this alternating polarity leads to a thermodynamically unstable electric potential divergence—a so-called “polar catastrophe”—which is prevented by a structural or electronic reconstruction. Undoped SrCuO2, consisting of alternating Sr2+ and (CuO2)2- planes and no mobile charges to screen the electrostatic potential buildup, is such an example.
In this paper we use in situ angle-resolved photoemission spectroscopy (ARPES) and electron diffraction to study both the doping evolution as well as the polar reconstruction in epitaxially-stabilized Sr1-xLaxCuO2 thin films grown by molecular-beam epitaxy. In Sec. II, we describe the film growth and experimental details. In Sec. III, we present measurements of Sr1-xLaxCuO2 at low doping levels, showing a dispersive lower Hubbard band (LHB) characteristic of other parent cuprates. Section IV demonstrates that with increased electron doping, a continuous evolution from insulator to superconductor occurs as spectral weight fills in the charge-transfer gap. In Sec. V, we describe electron diffraction probes that show evidence of a surface reconstruction consistent with the mitigation of a polar catastrophe in Sr1-xLaxCuO2. We also present evidence supporting a recent theoretical prediction of a thickness-controlled structural transition in ultrathin films of SrCuO2 grown on nonpolar SrTiO3. Finally, Sec. VI offers conclusions and implications of our work.
II Experimental details
Sr1-xLaxCuO2 thin films ( = 0, 0.01, 0.05, and 0.10) with a thickness of 60 unit cells (20 nm) and terminated with CuO2 were deposited using a Veeco GEN10 dual-chamber oxide molecular-beam epitaxy system. Films were grown epitaxially on (110) GdScO3 substrates, which have a distorted perovskite structure with a pseudocubic lattice constant of 3.968 Åuecker2008 . Shuttered layer-by-layer deposition was performed in a background of 80% pure distilled O3 at a pressure of Torr and with a substrate growth temperature of 510 ∘C. Depositions were monitored using reflection high-energy electron diffraction (RHEED). After growth, samples were reduced by vacuum annealing at 520 ∘C for 30 minutes in order to eliminate excess oxygen atoms. The films were then cooled to 200 ∘C before immediate transfer under ultra-high vacuum into the ARPES chamber. Samples with were superconducting, exhibiting bulk resistance transitions in the range 25 5 K. Further details of the film growth can be found in Ref. 17.
ARPES measurements were performed with a VG Scienta R4000 electron spectrometer and He-I photons (21.2 eV) at a base pressure of Torr and with an instrumental resolution better than = 20 meV and = 0.03 Å-1. The sample temperature was held at 200, 30, and 10 K for = 0.01, 0.05, and 0.10, respectively. The Fermi level was determined by measuring polycrystalline gold in electrical contact with the sample. Experimental results were confirmed by studying multiple samples. After ARPES measurements, samples were characterized by in situ low-energy electron diffraction (LEED) to examine surface structure and quality. X-ray photoelectron spectroscopy was used to verify the stoichiometry of the films, measuring a difference of less than 0.01 between the measured and nominal lanthanum doping level .
III Parent electronic structure
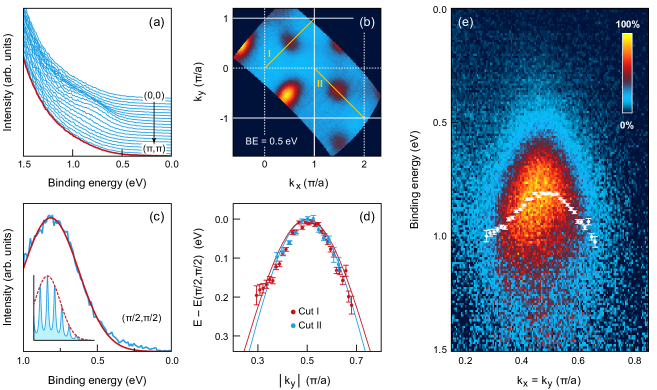
The undoped parent compounds of the cuprates are charge-transfer insulators in which strong local Coulomb interactions dominate over a conventional band structure picture. Instead, the low-energy electronic structure is composed of a LHB, which typically has a bandwidth of 0.3 eV and a maximum at dagotto1994 . In Fig. 1, we show ARPES data for Sr0.99La0.01CuO2, where was intentionally added to prevent electrostatic charging of the sample (observed in stoichiometric SrCuO2 films), pinning the chemical potential near the bottom of the upper Hubbard band. A small shoulder in the tail of the valence band is clearly present. After subtraction of a background EDC obtained by averaging the valence band tail near , we observe a dispersive peak with a broad lineshape, characteristic of the LHB in other parent cuprates shen2004 ; armitage2002 . The spectral shape of the LHB is due to Franck-Condon broadening in which the coupling to a bosonic mode causes the spectral function to split into a set of discrete peaks. Each peak represents a resonance with a different boson occupation number, with the true quasiparticle pole residing in the low-binding-energy tail of intensity shen2004 . At , the lineshape can be well-fit to a simple three-parameter Gaussian function, shown in Fig. 1(c), with the intensity maximum in the LHB at a binding energy of 0.81 eV and a full-width at half-maximum (FWHM) of 0.41 eV. This compares well with the LHB observed in other cuprate parent compounds, such as Ca2CuO2Cl2 shen2004 and Nd2CuO4 armitage2002 , where the FWHM of the LHB is measured to be 0.34 eV and 0.36 eV, respectively.
As Fig. 1(d) shows, the LHB is dispersive, exhibiting a symmetric energy maximum at . The --- model is often used to describe the motion of a doped carrier in a two-dimensional antiferromagnetic insulator, with the and parameters necessary to reproduce the clearly observed dispersion in the to direction. By fixing meV and allowing and to vary in order to match the experimentally measured curvature along the to and transverse directions, we obtain a good fit to the data with meV and meV. This is similar to the values meV, meV, and meV from Ref. 21, obtained by fitting to self-consistent Born approximation calculations of Sr2CuO2Cl2, another undoped cuprate. The similarity suggests a universality of the electronic structure of the cuprates in the limit of low doping. While weakly interacting formalisms such as density functional theory predict a metallic state, the --- model in conjunction with Franck-Condon broadening can describe the observed electronic structure, accounting for the bandwidth change from eV to eV and the dispersion symmetry around .
IV Doping evolution of low-energy states

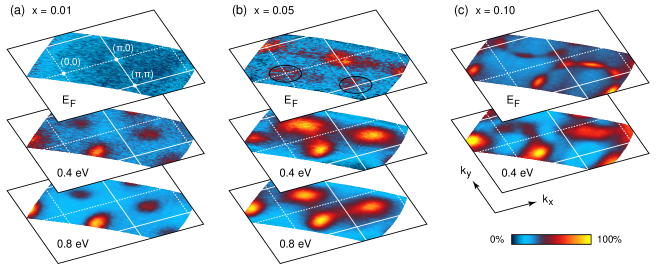
Upon addition of electrons into the CuO2 planes via the substitution of trivalent lanthanum for divalent strontium in the intervening layers, the upper Hubbard band in Sr1-xLaxCuO2 evolves into a metallic Fermi surface with spectral weight first appearing at and equivalent points, as evidenced by the Fermi surface map of the sample in Fig. 2(b). This behavior is identical to that seen in the electron-doped Re2-xCexCuO4 family armitage2002 . At , the Fermi surface consists solely of an electron pocket centered at , although spectral weight is still apparent at . As Ref. 5 describes, this unusual Fermi surface is due to strong antiferromagnetism, which gaps the quasiparticles near . Recent studies of the Re2-xCexCuO4 family have shown a clear link between oxygen content and the gapping of portions of the Fermi surface by antiferromagnetism richard2007 ; richard2008 ; song2012 . Chemical and structural similarities between the two families strongly suggests that the energy pseudogap near observed for Sr0.90La0.10CuO2 may also be due to incomplete oxygen reduction. A further discussion of the oxygen reduction step can be found in Sec. V. Figure 2 also shows maps at higher binding energies, where all three doping levels show evidence of a remnant LHB which takes the form of diffuse regions of spectral weight centered near and coexistent with the coherent bands dispersing through the Fermi level.
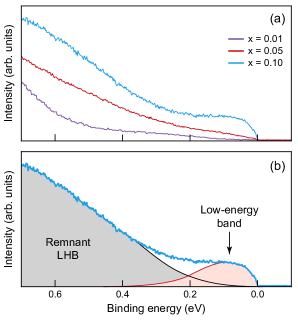
As Fig. 3 shows, along to we observe that rather than closing abruptly, the charge-transfer gap gradually fills with spectral weight upon electron doping from 1% to 10%. This is accompanied by a qualitative change in the nature of the low-energy excitations of the system: the localized states of the LHB give way to a coherent itinerant band dispersing through the Fermi level. Figures 3(c,d) highlight a notable feature in the dispersion derived from a MDC analysis: at approximately 0.2 eV, the dispersion appears to “boomerang” backwards. This phenomenon is observed at multiple equivalent points in momentum space and is inconsistent with single-band physics. Instead, the effect likely arises from a two-component spectral function illustrated in Fig. 4: a coherent low-energy band forming the Fermi surface and a large contribution of incoherent spectral weight at higher energies derived from a remnant LHB that survives even at . This behavior differs from the hole-doped cuprates or the Re2-xCexCuO4 family, where so-called “waterfalls” are observed at higher binding energies graf2007 ; inosov2007 ; ikeda2009 ; moritz2009 . Recent theoretical calculations that take into account strong electron correlations have predicted such a coexistence of a low-energy band and an incoherent high-energy branch at 10% electron doping senechal2005 ; weber2010 . Figure 3(d) also shows that the position of the LHB maximum appears to shift from towards with doping at a rate of approximately /%, which is quantitatively similar to the behavior observed for hole-doped Ca2-xNaxCuO2Cl2, where the LHB shifts with doping at a rate of /% shen2004 . Interestingly, the maximum shifts in the same direction for both electron and hole doping, counter to what would be expected from band structure calculations. The prominence of the remnant LHB in the experimental data highlights the important role that strong local electron correlations play in the electronic structure of Sr1-xLaxCuO2 even at relatively high doping levels.
We observe an interesting feature in the Fermi surface map of the sample, as circled in Fig. 2(b): weak but finite spectral weight at and . Bands at these locations in momentum space are not expected by tight-binding, density functional theory, or the --- model. Instead, it appears that the observed intensity is the result of a surface reconstruction of the sample, which causes shadows of the real spectral weight at to be reflected onto these locations in momentum space. At higher binding energies, evidence of this reconstruction is absent because reflections from intense regions of the remnant LHB fall onto each other. This surface reconstruction is described further in the next section.
V Polar surface reconstruction
The metastable infinite-layer structure, which can only be grown in polycrystalline form under high pressure or as an epitaxially-stabilized thin film, lies near a manifold of other structural phases, such as the edge-sharing chain-type structure gambardella1992 . One consequence is an elevated sensitivity to oxygen stoichiometry. For example, all as-grown Sr1-xLaxCuO2 films require a vacuum annealing step in order to eliminate excess oxygen and form the infinite-layer structure. This feature is shared by both families of electron-doped cuprates and is generally believed to be related to the absence of apical oxygen atoms in their respective crystal structures. As Fig. 5 shows, RHEED patterns before and after the oxygen reduction step show a marked structural change, and LEED performed on an unreduced film shows a number of extra diffraction peaks incommensurate with the tetragonal infinite-layer reciprocal lattice.
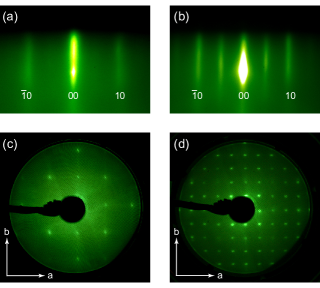
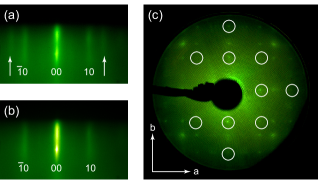
Even within the correct bulk structural phase, many nominally tetragonal transition metal oxides, such as Sr2RuO4 damascelli2000 and SrTiO3 erdman2002 , are known to support surface reconstructions because of their complex surface chemistry. Electron diffraction probes are sensitive to such reconstructions. As demonstrated in Fig. 6, both RHEED, performed after growth at high temperature, and LEED, performed at low temperature, indicate that some Sr1-xLaxCuO2 samples with low doping levels show a surface reconstruction not observed by bulk x-ray diffraction. Within the ionic limit at low doping, the infinite-layer structure is intrinsically polar, alternating between charged Sr2+ and (CuO2)2- layers. This introduces a thermodynamic instability towards reconstruction as films of the material are grown. We argue below that the observed reconstruction is most likely a result of the polar surface of Sr1-xLaxCuO2, and that a polar catastrophe is avoided in this material by the formation of ordered oxygen vacancies on the topmost CuO2 plane.
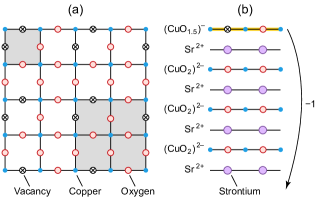
The measured Sr1-xLaxCuO2 films are terminated with a CuO2 layer, and the extra RHEED streaks associated with the reconstruction, shown in Fig. 6(b), become more intense during the vacuum annealing step that occurs at the end of film growth. This strongly suggests that the reconstruction is related to the removal of oxygen from the topmost CuO2 plane. Indeed, half an oxygen vacancy per unit cell will change the net charge of the terminal CuO2 atomic layer from to , resulting in a cancellation of the divergent electric potential associated with alternating charged layers nakagawa2006 . Under this constraint, only one structure is consistent with a symmetry. One orientation of this structure is displayed in Fig. 7, with three others related by in-plane 90∘ rotations. The measured widths of both RHEED streaks and LEED spots indicate that such oxygen vacancy ordering persists over an in-plane length scale of at least 10 unit cells. We emphasize that the clear diffraction peaks in LEED measurements definitively rule out the possibility that the surface consists of domains of and reconstructions, a fact greatly limiting the set of possible oxygen vacancy structures to consider. If a single domain of our proposed model existed on the film surface, an anisotropic LEED structure factor would be observed. Because we instead observe four-fold symmetric diffraction patterns, the films likely contain domains of all four rotational orientations.
Higher doping levels lead to better metallic screening of the polar electric potential divergence, and the band gap of a material can play a large role in its polar reconstruction gu2009 . It is therefore natural to expect the tendency towards a polar surface reconstruction to be diminished at higher doping levels. Indeed, we note that for , about half of films showed evidence of a reconstruction either by RHEED or LEED, while for , only one out of eight films showed the phenomenon. The observed film-to-film variability at fixed doping may be related to the fact that the formation of long-range structural order at the surface of the film, necessary for observing the reconstruction with diffraction probes, is likely sensitive to temperature, oxygen partial pressure, and other growth parameters.

Despite a dramatic reconstruction of the terminal CuO2 surface in Sr1-xLaxCuO2, ARPES measurements are mostly consistent with a pristine unreconstructed material, with the Fermi surface enclosing the correct Luttinger volume. Figure 8 shows a Fermi surface map for an sample, identical to the top panel of Fig. 2(b), where there is some evidence of a reconstruction in the form of weak shadow bands at and . With this exception, the ARPES data can be analyzed without considering the reconstruction. If the model presented above is correct, the large number of oxygen vacancies on the film surface will naturally alter the valence states of the topmost copper and oxygen atoms, moving their energies away from the Fermi level. Low-energy photoemission on such films will therefore effectively probe the first buried CuO2 plane in the material. This will slightly suppress the photoemission intensity near the Fermi level because photoelectrons must travel through the top atomic layer before leaving the sample, explaining the high relative background intensity that is observed in the photoemission data of all Sr1-xLaxCuO2 films studied.
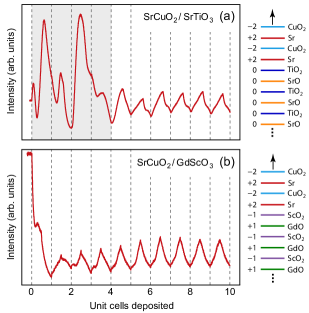
Recently, Ref. 35 predicted that ultrathin films of polar SrCuO2 grown on nonpolar SrTiO3 substrates would exhibit a thickness-controlled transition from a chain-type structure for unit cells to the infinite-layer structure for unit cells. As Fig. 9 shows, we observe evidence for such a transition in RHEED oscillations during the growth of the first few unit cells of SrCuO2 on (001) SrTiO3. The first four unit cells consistently show a different pattern of oscillations, and only after deposition of the fourth unit cell do the typical oscillations begin. Interestingly, when films are grown on polar (110) GdScO3 substrates, this behavior is suppressed and the first four deposition periods show oscillations qualitatively similar to those at later times. This atomic reconstruction, occurring during the formation of the first few unit cells of SrCuO2, is likely related to electrostatic instabilities of both the film and the substrate. This may explain why film growth on a polar substrate such as GdScO3 results in qualitatively different RHEED oscillations even during deposition of the first atomic layers.
VI Conclusion
In conclusion, we have used in situ ARPES in conjunction with molecular-beam epitaxy to study the doping evolution of thin films of the infinite-layer electron doped cuprate Sr1-xLaxCuO2. At low doping, a dispersive LHB characteristic of cuprate parent compounds is observed. With the addition of electron carriers, a transition from charge-transfer insulator to metallic superconductor is observed as spectral weight, first appearing at , gradually fills in the charge-transfer gap. Most notably, we observe the coexistence of a remnant LHB with the coherent low-energy states, even for . Electron diffraction was used to study the polar surface reconstruction observed in low-doped films. This reconstruction can be explained with a simple model by considering the polar nature of Sr1-xLaxCuO2. Finally, we have presented evidence supporting the theoretical prediction of a thickness-controlled transition in ultrathin films of Sr1-xLaxCuO2 grown on nonpolar substrates. Our work shows that strong local correlations, forming a remnant LHB, remain important in the cuprates even at high electron-doping levels. Furthermore, it appears that in films of Sr1-xLaxCuO2 in the ionic limit at low doping, a polar catastrophe is avoided via a structural rather than an electronic reconstruction. Our observations highlight the need for deeper investigation into the stability and structural changes that occur in polar complex oxide thin films and their surfaces.
ACKNOWLEDGMENTS
We are grateful to Haofei Wei for help with sample characterization. This work was supported by the Air Force Office of Scientific Research (Grant No. FA9550-11-1-0033) and the National Science Foundation through the MRSEC program (Grant No. DMR-1120296). L.M. was supported by the Army Research Office (Grant No. W911NF-09-1-0415), D. E. S. acknowledges support from the National Science Foundation under Grant No. DGE-0707428 and through the IGERT program under Grant No. DGE-0654193, and E. J. M. acknowledges support from an NSERC PGS.
References
- (1) N. P. Armitage, P. Fournier, and R. L. Greene, Rev. Mod. Phys. 82, 2421 (2010).
- (2) G. M. Luke, L. P. Le, B. J. Sternlieb, Y. J. Uemura, J. H. Brewer, R. Kadono, R. F. Kiefl, S. R. Kreitzman, T. M. Riseman, C. E. Stronach, M. R. Davis, S. Uchida, H. Takagi, Y. Tokura, Y. Hidaka, T. Murakami, J. Gopalakrishnan, A. W. Sleight, M. A. Subramanian, E. A. Early, J. T. Markert, M. B. Maple, and C. L. Seaman, Phys. Rev. B 42, 7981 (1990).
- (3) K. Yamada, K. Kurahashi, T. Uefuji, M. Fujita, S. Park, S.-H. Lee, and Y. Endoh, Phys. Rev. Lett. 90, 137004 (2003).
- (4) L. Alff, Y. Krockenberger, B. Welter, M. Schonecke, R. Gross, D. Manske, and M. Naito, Nature 422, 698 (2003).
- (5) J. W. Harter, L. Maritato, D. E. Shai, E. J. Monkman, Y. Nie, D. G. Schlom, and K. M. Shen, Phys. Rev. Lett. 109, 267001 (2012).
- (6) T. Tsukahara, M. Yoshimoto, H. Nagata, T. Hashimoto, S. Gonda, and H. Koinuma, Solid State Ionics 49, 183 (1991).
- (7) D. P. Norton, B. C. Chakoumakos, J. D. Budai, D. H. Lowndes, B. C. Sales, J. R. Thompson, and D. K. Christen, Science 265, 2074.
- (8) S. Karimoto, K. Ueda, M. Naito, and T. Imai, Appl. Phys. Lett. 79, 2767 (2001).
- (9) S. Karimoto and M. Naito, Appl. Phys. Lett. 84, 2136 (2004).
- (10) V. Leca, D. H. A. Blank, G. Rijnders, S. Bals, and G. van Tendeloo, Appl. Phys. Lett. 89, 092504 (2006).
- (11) J. Heber, Nature 459, 28 (2009).
- (12) J. Mannhart and D. G. Schlom, Science 327, 1607 (2010).
- (13) A. Ohtomo and H. Y. Hwang, Nature 427, 423 (2004).
- (14) N. Nakagawa, H. Y. Hwang, and D. A. Muller, Nature Mater. 5, 204 (2006).
- (15) N. Reyren, S. Thiel, A. D. Caviglia, L. Fitting Kourkoutis, G. Hammerl, C. Richter, C. W. Schneider, T. Kopp, A.-S. Rüetschi, D. Jaccard, M. Gabay, D. A. Muller, J.-M. Triscone, and J. Mannhart, Science 317, 1196 (2007).
- (16) R. Uecker, B. Velickov, D. Klimm, R. Bertram, M. Bernhagen, M. Rabe, M. Albrecht, R. Fornari, and D. G. Schlom, J. Cryst. Growth 310, 2649 (2008).
- (17) L. Maritato, A. Galdi, P. Orgiani, J. W. Harter, J. Schubert, K. M. Shen, and D. G. Schlom, J. Appl. Phys. 113, 053911 (2013).
- (18) E. Dagotto, Rev. Mod. Phys. 66, 763 (1994).
- (19) K. M. Shen, F. Ronning, D. H. Lu, W. S. Lee, N. J. C. Ingle, W. Meevasana, F. Baumberger, A. Damascelli, N. P. Armitage, L. L. Miller, Y. Kohsaka, M. Azuma, M. Takano, H. Takagi, and Z.-X. Shen, Phys. Rev. Lett. 93, 267002 (2004).
- (20) N. P. Armitage, F. Ronning, D. H. Lu, A. Damascelli, K. M. Shen, D. L. Feng, H. Eisaki, Z.-X. Shen, P. K. Mang, N. Kaneko, M. Greven, Y. Onose, Y. Taguchi, and Y. Tokura, Phys. Rev. Lett. 88, 257001 (2002).
- (21) T. Tohyama and S. Maekawa, Supercond. Sci. Technol. 13, R17 (2000).
- (22) P. Richard, M. Neupane, Y.-M. Xu, P. Fournier, S. Li, P. Dai, Z. Wang, and H. Ding, Phys. Rev. Lett. 99, 157002 (2007).
- (23) P. Richard, M. Neupane, Y.-M. Xu, P. Fournier, S. Li, P. Dai, Z. Wang, and H. Ding, Physica B 403, 1170 (2008).
- (24) D. Song, S. R. Park, C. Kim, Y. Kim, C. Leem, S. Choi, W. Jung, Y. Koh, G. Han, Y. Yoshida, H. Eisaki, D. H. Lu, Z.-X. Shen, and C. Kim, Phys. Rev. B 86, 144520 (2012).
- (25) J. Graf, G.-H. Gweon, K. McElroy, S. Y. Zhou, C. Jozwiak, E. Rotenberg, A. Bill, T. Sasagawa, H. Eisaki, S. Uchida, H. Takagi, D.-H. Lee, and A. Lanzara, Phys. Rev. Lett. 98, 067004 (2007).
- (26) D. S. Inosov, J. Fink, A. A. Kordyuk, S. V. Borisenko, V. B. Zabolotnyy, R. Schuster, M. Knupfer, B. Büchner, R. Follath, H. A. Dürr, W. Eberhardt, V. Hinkov, B. Keimer, and H. Berger, Phys. Rev. Lett. 99, 237002 (2007).
- (27) M. Ikeda, T. Yoshida, A. Fujimori, M. Kubota, K. Ono, Y. Kaga, T. Sasagawa, and H. Takagi, Phys. Rev. B 80, 184506 (2009).
- (28) B. Moritz, F. Schmitt, W. Meevasana, S. Johnston, E. M. Motoyama, M. Greven, D. H. Lu, C. Kim, R. T. Scalettar, Z.-X. Shen, and T. P. Devereaux, New J. Phys. 11, 093020 (2009).
- (29) D. Sénéchal, P.-L. Lavertu, M.-A. Marois, and A.-M. S. Tremblay, Phys. Rev. Lett. 94, 156404 (2005).
- (30) C. Weber, K. Haule, and G. Kotliar, Nature Phys. 6, 574 (2010).
- (31) M. T. Gambardella, B. Domengès, and B. Raveau, Mater. Res. Bull. 27, 629 (1992).
- (32) A. Damascelli, D. H. Lu, K. M. Shen, N. P. Armitage, F. Ronning, D. L. Feng, C. Kim, Z.-X. Shen, T. Kimura, Y. Tokura, Z. Q. Mao, and Y. Maeno, Phys. Rev. Lett. 85, 5194 (2000).
- (33) N. Erdman, K. R. Poeppelmeier, M. Asta, O. Warschkow, D. E. Ellis, and L. D. Marks, Nature 419, 55 (2002).
- (34) X. Gu, I. S. Elfimov, and G. A. Sawatzky, arXiv:0911.4145 [cond-mat.mes-hall].
- (35) Z. Zhong, G. Koster, and P. J. Kelly, Phys. Rev. B 85, 121411(R) (2012).