Optical and near-infrared spectroscopy of the black hole Swift J1753.5-0127
Abstract
We report on a multiwavelength observational campaign of the black hole X-ray binary Swift J1753.50127 that consists of an ESO/X-shooter spectrum supported by contemporaneous Swift/XRT+UVOT and ATCA data. ISM absorption lines in the X-shooter spectrum allows us to determine along the line-of-sight to the source. We also report detection of emission signatures of He II , H, and, for the first time, H I and Pa. The double-peaked morphology of these four lines is typical of the chromosphere of a rotating accretion disk. Nonetheless, the paucity of disk features points towards a low level of irradiation in the system. This is confirmed through spectral energy distribution modeling and we find that the UVOT+X-shooter continuum mostly stems from the thermal emission of a viscous disk. We speculate that the absence of reprocessing is due to the compactness of an illumination-induced envelope that fails to reflect enough incoming hard X-ray photons back to the outer regions. The disk also marginally contributes to the Compton-dominated X-ray emission and is strongly truncated, with an inner radius about a thousand times larger than the black hole’s gravitational radius. A near-infrared excess is present, and we associate it with synchrotron radiation from a compact jet. However, the measured X-ray flux is significantly higher than what can be explained by the optically thin synchrotron jet component. We discuss these findings in the framework of the radio quiet versus X-ray bright hypothesis, favoring the presence of a residual disk, predicted by evaporation models, that contributes to the X-ray emission without enhancing the radio flux.
Subject headings:
binaries: close X-rays: binaries Infrared: stars accretion, accretion discs Stars: individual: Swift J1753.50127 ISM: jets and outflowsI. Introduction
Microquasars are disk-accreting X-ray binaries characterized by the presence of collimated bipolar radio ejections called jets. When in outburst, they transition between two canonical spectral states, dubbed soft when the disk dominates the X-ray emission and hard when continuous compact radio jets are present (see e.g. Fender et al., 2004). In the hard state, microquasars have consequently long been known to exhibit a very tight radio/X-ray correlation spanning several orders of magnitudes. First measured for a couple of sources almost 20 years ago (Hannikainen et al., 1998; Corbel et al., 2000), this relation was progressively extended to almost all known systems (see e.g. Gallo et al., 2003; Corbel et al., 2013; Gallo et al., 2014). Nonetheless, it quickly appeared that what was initially thought to be a universal relation, , is actually not followed by a growing number of outliers that exhibit a lower-than-expected radio flux for a given X-ray luminosity (see e.g. Corbel et al., 2004; Gallo, 2007; Coriat et al., 2011). Such sources are often referred to as radio quiet microquasars (Soleri & Fender, 2011; Coriat et al., 2011), by analogy with active galactic nuclei (AGN).
| Swift/XRT | Swift/UVOT | X-shooter | ATCA | |||||||||
|---|---|---|---|---|---|---|---|---|---|---|---|---|
| Date\tmark[a] | 56885.3 | 56885.3 | 56886.0 | 56885.3 | ||||||||
| Band\tmark[b] | 0.4–7.5 keV | UVB | VIS | NIR | 5.5 GHz | 9 GHz | ||||||
| Exposure\tmark[c] | 1920 | 628 | 454 | 304 | 156 | 157 | 156 | 6720 | 6060 | |||
| Filter\tmark[a] | ||
|---|---|---|
| uvw2 | 1928 | 8.170.39 |
| um2 | 2246 | 6.050.38 |
| uw1 | 2600 | 8.550.49 |
| u | 3465 | 10.80.5 |
| b | 4392 | 9.270.42 |
| v | 5468 | 7.810.52 |
One such radio quiet microquasar, Swift J1753.50127 was discovered by the Swift Burst Alert Telescope on 2005 June 30 (Palmer et al., 2005). It is the microquasar with the shortest orbital period, first found to be lower than 3.25 hours (Zurita et al., 2008), and later refined to 2.85 hours (Neustroev et al., 2014). With such a short period, it is very likely that the companion star is a cold M dwarf, although it has never been formally identified. In fact, besides the orbit, very little is known about the parameters of the system. The presence of non P-Cygni emission lines in its ultraviolet (UV) spectrum and the absence of eclipse put the inclination in the range 40°80° (Froning et al., 2014) and Reis et al. (2009) measured from X-ray spectral fitting. The distance is also poorly constrained but is believed to be between 1 kpc and 8 kpc (Cadolle Bel et al., 2007; Durant et al., 2008), although larger values cannot be ruled out. Likewise, the black hole (BH) mass is unknown, with estimates ranging from a typical value (Cadolle Bel et al., 2007; Zurita et al., 2008) to (Neustroev et al., 2014).
Swift J1753.50127 has never returned to quiescence since the beginning of its outburst in 2005, and it remained almost ten years in the hard state before transitioning to the soft state in February 2015. Although this extended period of heightened flux has put the source under a thorough scrutiny, the reasons behind this behavior remain uncertain. Moreover, whether the accretion disk is truncated as expected in the framework of advection-dominated accretion flows (ADAF, see e.g. Narayan & Yi, 1995) or extends up to its innermost stable circular orbit (ISCO) is still unclear. Recently, Froning et al. (2014) modeled the UV to near-infrared (near-IR) spectral energy distribution (SED) of the source with a viscous accretion disk and concluded that the disk had to be strongly truncated. On the other hand, Reis et al. (2009) fitted the XMM-Newton spectrum with a reflection model and found no truncation at all. The compact jet contribution to the optical and near-IR domains is also unknown.
In this paper we report on a multiwavelength study of Swift J1753.50127 in the hard state, centered on its optical and near-IR spectroscopic emission as observed in August 2014. Our main goals are (1) to study the geometry of the system; and (2) to constrain the contribution of the compact jet to the optical and near-IR emission. A work focusing on its early-April 2014 radio and X-ray properties, when the source was in a low-luminosity hard state, is presented in a companion paper (Tomsick et al., 2015, hereafter T15). The observations and data reduction procedures are presented in Section 2. Section 3 is devoted to analysis of the optical and near-IR spectrum, and Section 4 focuses on modeling the radio to X-ray SED. We discuss our results and their implications on our understanding of outliers to the radio/X-ray correlation of microquasars in Section 5, and we conclude in Section 6.
| Observation date | ||
|---|---|---|
| MJD 55274.4 | ||
| MJD 55454.0 | ||
| MJD 55456.5 | ||
| MJD 55736.4 | ||
| MJD 55918.7 |
II. Observations
The data set consists of contemporaneous observations obtained on 2014 August 16 with (1) ESO+VLT/X-shooter (Obs. ID 093.D-0786, PI Rahoui); (2) the X-Ray Telescope (XRT, Burrows et al., 2005) and the Ultra-Violet/Optical Telescope (UVOT, Roming et al., 2005) mounted on the Swift (Gehrels et al., 2004) satellite (Obs. ID 00033140032, PI Tomsick); and the Australia Telescope Compact Array (ATCA) at 5.5 GHz and 9 GHz (PI Coriat). A summary is given in Table 1.
II.1. X-shooter observations
We obtained medium-resolution spectroscopy of Swift J1753.50127 with the three available arms of X-shooter (Vernet et al., 2011), UVB, VIS and NIR (13, 12, and 12 slit-widths, respectively), giving simultaneous nm spectral coverage. Atmospheric conditions were medium-to-good, with a clear sky, seeing at 500 nm in the range 12-15, and an airmass between 1.1 and 1.3. The exposure time of each individual frame was set to 210 s, 210 s, and 70 s in the UVB, VIS, and NIR arms, respectively, and a total of 32, 32, and 96 frames were taken, with three near-IR exposures being obtained for each UV/optical exposure. Standard ABBA dithering was used for effective background subtraction, and the A0V telluric standard star HR6572 was observed in similar conditions for telluric features removal and flux-calibration.
We reduced the data using the dedicated pipeline (v. 2.5.2) implemented in the ESO data reduction environment Reflex v. 2.6 (Freudling et al., 2013). It follows the standard steps for echelle spectroscopy reduction and produces a cleaned, background-subtracted, and wavelength-calibrated 2D spectroscopic image. We then used the routines apall and telluric implemented in IRAF v. 2.16111 IRAF is distributed by the National Optical Astronomy Observatories, which are operated by the Association of Universities for Research in Astronomy, Inc., under cooperative agreement with the National Science Foundation. to extract the 1D spectra and remove the telluric features. We finally performed the flux-calibration following the procedure presented in Rahoui et al. (2012, 2014), and rebinned the spectra from their original pixel resolution, i.e. 0.2 Å, 0.2 Å, and 0.6 Å, to 1 Å, 1 Å, and 3 Å in the UVB, VIS, and NIR arms, respectively.
II.2. Swift observations
| He II | H | H | He I | Pa | |||
|---|---|---|---|---|---|---|---|
| 46682 | 47044 | 48597 | 65472 | 65802 | 109069 | 128156 | |
| -2.30.5 | -1.70.4 | +4.11.4 | -1.40.2 | -1.50.3 | -8.8 | -7.51.2 | |
| FWHMc | 1948199 | 1481183 | 87621147 | 1244174 | 1250111 | 3771474 | 2904319 |
| 1.95 | 1.440.45 | 3.450.69 | 0.840.22 | 0.870.22 | 2.210.42 | 1.280.20 | |
We reduced the XRT data with HEASOFT v. 6.16 and the 2014
October 2 calibration data base (CALDB) version. We used
xrtpipeline v. 0.13.1 to collect events in Windowed Timing
(WT) mode to avoid pile-up. The source and background spectra were
extracted with xselect v. 2.4c using 40-pixel square boxes in
the range 0.4–10 keV. We generated the ancillary response file (ARF)
with xrtmkarf and used the latest version (v. 015) of the
response matrices provided by the Swift team. We rebinned
the spectrum to obtain a minimum of 100 counts per channel.
The UVOT photometry was obtained in all filters, uvw2, uvm2, uvw1, u, b, and v, and we produced an image in each of them with uvotimsum. We then used uvotsource to extract the source in a 5″ region and the background counts in a 15″ source-free circular aperture, respectively. The derived Swift J1753.50127 flux densities are listed in Table 2.
II.3. ATCA observations
The array was in the compact H75 configuration and the observation was conducted with the Compact Array Broadband Backend (CABB, Wilson et al., 2011) and each frequency band was composed of 2048 1-MHz channels. We used PKS B1934–638 for absolute flux and bandpass calibration, and PKS J1741-038 to calibrate the antenna gains as a function of time. Flagging, calibration and imaging were carried out with the Multi-channel Image Reconstruction, Image Analysis and Display software (MIRIAD, Sault et al., 1995). Due to poor weather conditions, most of the observation was flagged and Swift J1753.50127 was not detected. We obtained the following 3- upper limits: 0.15 mJy at 5.5 GHz and 0.20 mJy at 9GHz, respectively.
II.4. WISE observations
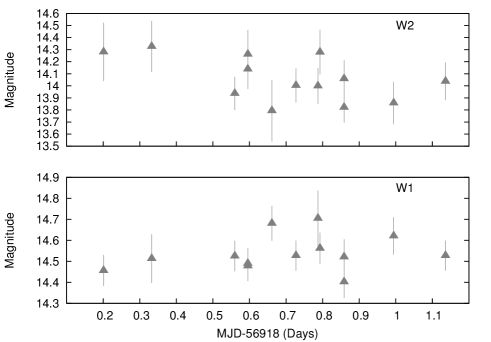
For comparison only, we also make use of Wide-Field Infrared Survey Explorer (WISE, Wright et al., 2010) data. The source was observed with WISE at five different epochs, around MJD 55274, MJD 55454, MJD 55456, MJD 56736, and MJD 56918 (see Table 3 for the weight-averaged flux densities). In particular, the MJD 56918 observation occurred about one month after our X-shooter observations (MJD 56885) and consists of 13 W1 (3.35 m) and W2 (4.5 m) frames of 7.7 s each obtained during the NEOWISE reactivation survey (Mainzer et al., 2014) between MJD 56918.2 and MJD 56919.1 (Figure 1). These magnitudes cannot therefore be considered as contemporaneous to our data and this is the reason why we only superimpose the resulting weight-averaged flux densities on the modeled SEDs.
 |
 |
 |
 |
III. The optical and near-IR spectrum
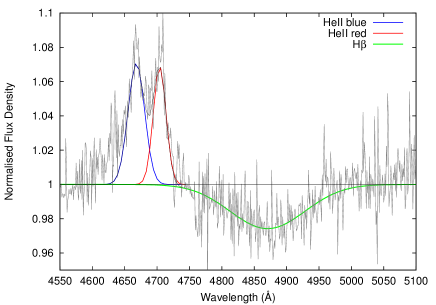
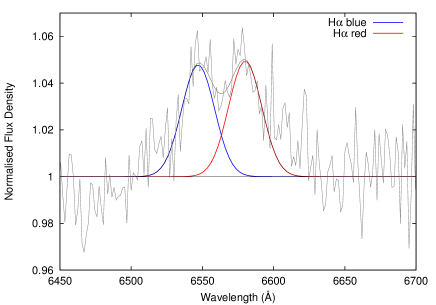
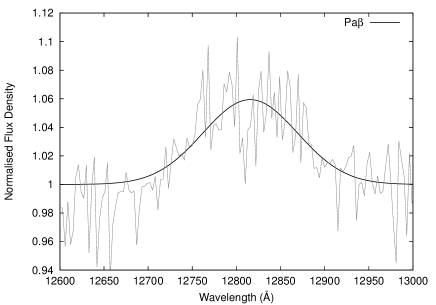
Figure 2 displays the flux-calibrated X-shooter 350-2400 nm spectrum, on which the detected spectroscopic features are marked and the UVOT flux densities superimposed. Figure 3 highlights the lines fitted with one or two Gaussian(s) and Table 4 lists their main parameters. The full-widths at half-maximum (FWHMs) were quadratically corrected for the instrumental broadening and the underlying continuum was locally assessed with a first-order polynomial. The continuum level being the primary source of inaccuracy, each measurement was repeated several times with different continuum placements within the same wavelength range to obtain a set of values that eventually averaged out. The listed uncertainties are therefore the scatter to the mean rather than just statistical.
III.1. The spectroscopic content
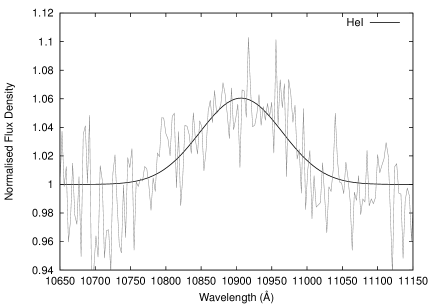
In the optical domain, Neustroev et al. (2014) detected He II Å and H in August 2013 spectra. This was the first report of optical emission features since the very early outburst of Swift J1753.50127 (Torres et al., 2005), as both Cadolle Bel et al. (2007) and Durant et al. (2009) reported the absence of optical emission lines during observations that took place in August 2005 and June 2007, respectively. Froning et al. (2014) also reported the detection of UV emission lines in October 2012 HST spectra. This likely hints at a renewed activity of the accretion disk anywhere between 2007 and 2012, although we cannot be more accurate. Neustroev et al. (2014) showed that the two lines were double-peaked and the authors measured total FWHMs of 4250 km s-1 and 2450 km s-1, peak-to-peak separations of 2690 km s-1 and 1650 km s-1, and total equivalent widths of 4.3 Å and 3.6 Å for He II and H, respectively. In our spectrum, we also report the two emission lines, which are still double-peaked, and we fitted their profiles with two Gaussians. Our measurements are in agreement with the values given in Neustroev et al. (2014), and we derive peak-to-peak separations of km s-1 and km s-1 for He II and H, respectively. We also report a very broad trough longwards of He II (FWHM km s-1) that is present in all the individual spectra and that we tentatively associate with H. Such Balmer absorption lines have been detected in other microquasars (e.g. Callanan et al., 1995; Bianchini et al., 1997; Soria et al., 2000; Dubus et al., 2001; Rahoui et al., 2014) and are thought to originate in the viscous accretion disk (La Dous, 1989). In the near-IR, we report for the first time the presence of very broad emission lines of He I and Pa centered at 10906 Å and 12815 Å, respectively. We believe their profiles are double-peaked, although double-Gaussian fits are statistically not required for either of them due to low S/N ratios. Their FWHMs, measured through single-Gaussian fitting, are roughly on par with the total FHWMs of the optical emission lines, hinting at similar locations in the accretion disc. Besides the features discussed above, no other emission lines are detected.
| DIB | 0.270.02 | 0.470.03\tmark[a] |
| Na I D2 | 0.710.05 | 0.420.04\tmark[b] |
| Na I D1 | 0.570.04 | 0.470.05\tmark[b] |
| K I | 0.120.02 | 0.430.07\tmark[c] |
III.2. The interstellar reddening
 |
 |
We surveyed the X-shooter spectrum to find interstellar lines relevant for the determination of the reddening suffered by Swift J1753.50127 along its line-of-sight. We unambiguously identified four of them with S/N high enough to be used to that purpose: the diffuse interstellar band (DIB) at 5780 Å, the D2 and D1 Na I doublet at 5890 Å and 5896 Å, respectively, as well as the K I line at 7699 Å. We measured their respective equivalent widths through Gaussian fitting and used various vs relations Jenniskens & Desert (1994) for DIB , Munari & Zwitter (1997) for K I, and Poznanski et al. (2012) for the Na I doublet to derive four measurements that we averaged to yield (see Table 5). This result is similar to previous measurements, in particular found in Durant et al. (2009) and in Froning et al. (2014). Moreover, of relevance for multiwavelength SED modeling, this interstellar reddening value is consistent with a column density between cm-2 and cm-2, using the average total-to-selective extinction ratio and the relations and given in Güver & Özel (2009) and Foight et al. (2015), respectively.
III.3. The continuum
Swift J1753.50127 exhibits a very blue spectrum and the equivalent widths of the near-infrared emission lines are significantly larger than those at optical wavelengths despite similar or lower intrinsic fluxes. Considering that these features are likely formed in the outer regions of the accretion disk, this points towards the disk as the main contributor to the continuum.
Furthermore, the optical flux level is similar to those reported in previous studies, which is consistent with the very weak average photometric variability of the source. However, Neustroev et al. (2014) reported a flattening of the continuum between 4000 Å and 5400 Å, which is not present in our spectrum. The authors also argue that the optical continuum was variable on a night-to-night timescale, strongly between 4000 Å and 5400 Å, and marginally beyond. To check if we could detect any similar variations, we extracted all the individual 210 s X-shooter spectra and compared them; we could not find any significant flickering, neither in flux level nor in shape, beyond the noise level. It is not clear if this can be interpreted as a non variability of the continuum at short timescales, or if 210 s is sufficient to smooth out the variations, like in the GX 3394 case (Rahoui et al., 2012).
IV. Spectral energy distribution modeling
 |
 |
| \tmark[a] | ||
|---|---|---|
| \tmark[b] | 0.130.01 | |
| \tmark[c] | ||
| \tmark[d] | 0.120.02 | tied to |
| \tmark[e] | 60 (fixed) | 60 (fixed) |
| \tmark[f] | ||
| (d.o.f) | 0.91 (173) | 0.86 (172) |
In the following, the X-shooter spectrum and UVOT photometric points were corrected for interstellar reddening using the extinction law given in Fitzpatrick (1999) with (see Section 3.2) and a selective-to-total extinction ratio equal to the Galactic average value .
IV.1. The X-ray emission
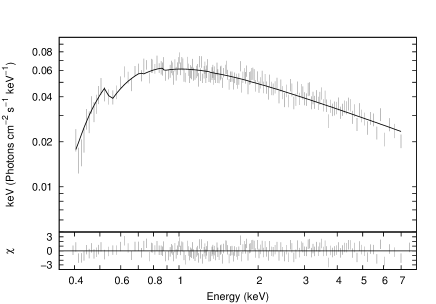
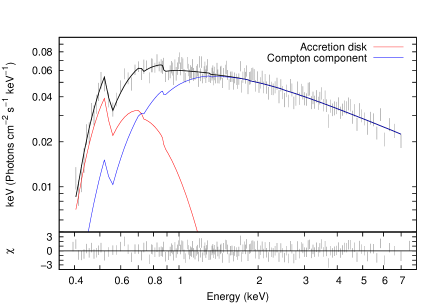
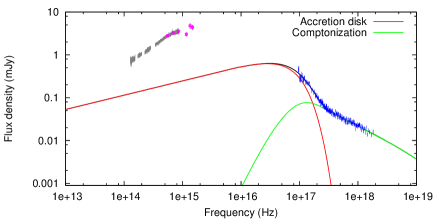
We fitted the spectrum using Xspec v. 12.8.2, first with an absorbed spherical Comptonization component, tbabscomptt (Titarchuk, 1994). We used the abundances given in Wilms et al. (2000), and fixed the electron temperature to 60 keV after confirming that this parameter was not constrained (see the T15 for a measurement of from our 2014 April NuSTAR observations). The best-fit parameters are listed in the left column of Table 6, and the best-fit model is displayed in the left panel of Figure 4. While the result is satisfactory, with a seed-photons temperature , an optical depth , and a reduced value of 0.91, the measured best-fit column density cm-2 is a factor two lower than the expected extinction along the line-of-sight to Swift J1753.50127 (see Section 4.2 for a discussion about the interstellar reddening). This likely means that the soft X-ray flux is underestimated, and we thus performed the fit again adding an accretion disk component, modeled with diskbb. We tied the seed-photons temperature to the disk temperature, and left the electron temperature fixed to 60 keV. The best-fit parameters are listed in the right column of Table 6, and the best-fit spectrum is displayed in the right panel of Figure 4. Adding an accretion disk only slightly improves the fit, with a reduced of 0.86. However, the measured column density, cm-2 is much more consistent with the expected interstellar reddening. The seed-photons blackbody included in comptt is also negligible compared to the disk blackbody emission. We conclude that this implies the presence of an extra soft component contributing to the X-ray emission of Swift J1753.50127, although we stress that our Swift data alone are not sufficient to prove the accretion disk hypothesis.
| \tmark[b] | ||
|---|---|---|
| \tmark[c] | ||
| (d.o.f) | 1.17 (6170) | 0.97 (6168) |
IV.2. The optical and near-IR emission
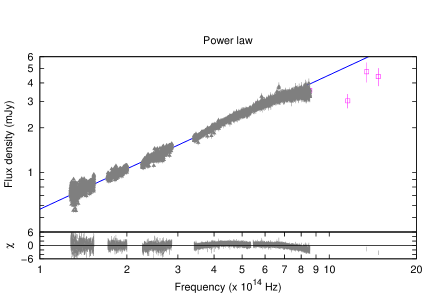
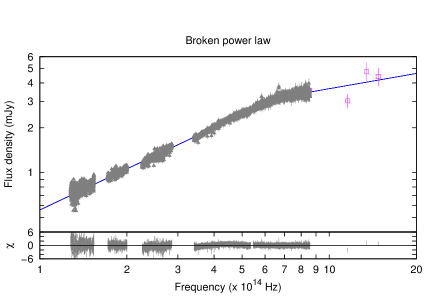
Froning et al. (2014) showed that the UV, optical, and near-IR emission of Swift J1753.50127 during their 2012 October 2 observations was likely due to a strongly truncated accretion disk, with the presence of a possible near-IR excess. The authors also argued that the simultaneous Swift spectrum was perfectly modeled with an absorbed power law without any need for a disk component. In our case, the presence of double-peaked emission lines in the very blue X-shooter spectrum as well as the lack of short timescale variability of the continuum also favor the accretion disk as the main contributor to the optical and near-IR emission. This is confirmed by the phenomelogical modeling of the UVOT+X-shooter continuum with a broken power law (displayed in Figure 5, see Table 7 for the best-fit parameters). Beyond the break, the spectral index is roughly consistent with the canonical value, 1/3, expected from a viscous accretion disk (Shakura & Syunyaev, 1973). Below, the spectral index is flatter than a typical Raleigh-Jeans tail, pointing towards the contribution of at least one extra component.
In contrast to Froning et al. (2014), our derived 0.3-8 keV flux of Swift J1753.50127 is erg cm-2 s-1, i.e. about 80% larger than their reported value, and we argue that an extra soft X-ray component is required. It is therefore likely that the disk is both responsible for this soft X-ray excess and a significant fraction of the optical and near-IR emission. Nonetheless, as seen in Figure 6, the accretion disk continuum as derived from the X-ray fit only is unable to account for the UVOT and X-shooter flux level, and a complete characterization of the accretion disk properties requires a simultaneous modeling of the Swift/XRT+UVOT and X-shooter data.
IV.3. Broadband SED
We therefore fitted the radio, UV/optical/near-IR, and X-ray SED of Swift J1753.50127 with several models that include an accretion disk. We chose diskir, introduced in Gierliński et al. (2008), for the following reasons: (1) it is designed to self-consistently fit optical/near-IR and X-ray data as it includes a Comptonization component; (2) it takes X-ray irradiation phenomena into account; and (3) it allows a derivation of the outer radius of the accretion disk.We also fixed a few parameters of the diskir model after several attempts failed to constrain them. As previously mentioned, the electron temperature of the Comptonization component was fixed to 60 keV. The irradiation radius , which represents the size of the inner disk region which is illuminated by the corona, was fixed to to 1.0001 , the minimum allowed value towards which it was converging. The fraction of hard X-ray emission thermalized in the inner disk, , was frozen to the recommended value for the hard state, 0.1, while the fraction of X-ray emission thermalized in the outer disk, , which systematically converged to 0, was eventually fixed to that value.
IV.3.1 Diskir only
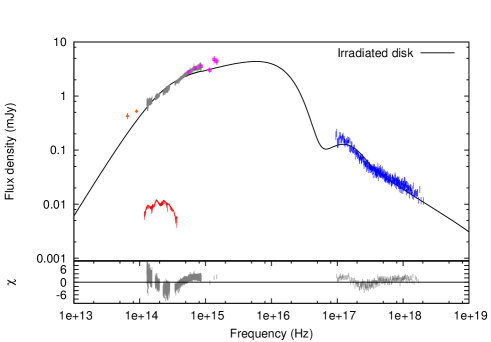
We first attempted to fit the X-shooter and XRT-UVOT SED of Swift J1753.50127 with diskir only. Figure 7 displays the best-fit model and Table 8 lists the best-fit parameters. It is clear that diskir alone is insufficient to describe both the X-ray and optical/near-IR data, with a reduced of 6.1. Figure 7 also shows the superimposed near-IR spectrum of a M4V star at 3 kpc, illustrating that no contribution is expected from the companion star and we can therefore confirm that besides the disk, another non-stellar component must contribute to the X-ray and optical/near-IR emission. We also stress that the fit gives a column density consistent with the interstellar reddening and points towards a cold and truncated accretion disk.
IV.3.2 Diskir and blackbody
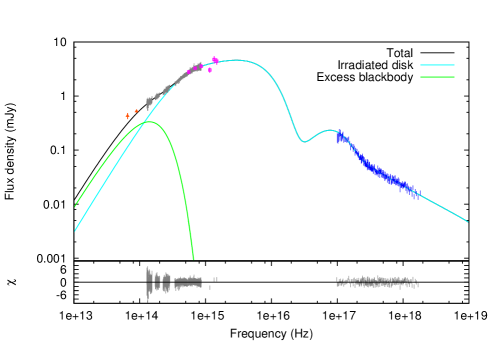
The phenomenological modeling displayed in Figure 5 as well as the diskir-only fit are consistent with the presence of an excess in the optical and near-IR domains. Although it is clear that the emission from the companion star is negligible, the stellar hemisphere facing the black hole could still be irradiated by the X-ray emission, leading to such an excess. Alternatively, a warm dust component similar to those previously detected in other microquasars (see e.g. Rahoui et al., 2010) could also be present. To test these possibilities, we fit the X-shooter and XRT-UVOT SED of Swift J1753.50127 adding a spherical blackbody to diskir; the best-fit parameters are listed in the second column of Table 8 and the best-fit SED is displayed in Figure 8. The addition of the blackbody emission clearly improves the fit, with a reduced of 0.94, confirming the presence of an excess in the optical and near-IR domains. However, the best-fit parameters are neither consistent with stellar irradiation nor warm dust. Indeed, the best-fit temperature, K, is too high to be that of warm dust, which sublimes around 1500 K (see e.g. Draine, 2003), while the best-fit radius, for a distance of 3 kpc, is too large to be that of an M dwarf star, typically smaller that 0.6 (Boyajian et al., 2012). As such, the optical and near-IR excess must therefore stem from another process.
IV.3.3 Diskir and broken power law
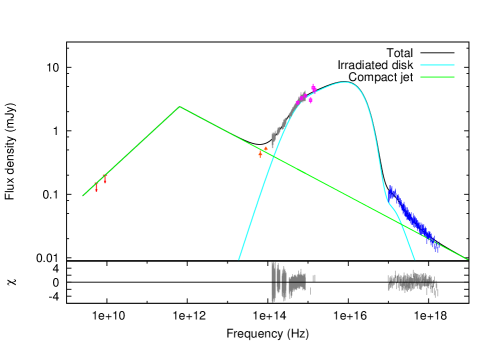
Our observations occurred when Swift J1753.50127 was in the hard state and the source is regularly detected at radio frequencies. In particular, its radio flux at 15.4 GHz was measured with AMI at about 290 Jy a few days after our observations (M. Kolehmainen, private communication). It is therefore reasonable to expect that a compact jet contributes to its optical and near-IR emission through synchrotron radiation, as seen in many other microquasars (see e.g. Eikenberry et al., 1998; Corbel & Fender, 2002; Chaty et al., 2003; Russell et al., 2006, 2010). To test this hypothesis, we replaced the blackbody by a broken power law to mimic the bolometric emission of the jet as calculated in Blandford & Konigl (1979), i.e. a combination of optically thick synchrotron () from the radio domain to a spectral break where the synchrotron becomes optically thin (). Unfortunately, Swift J1753.50127 was not detected at radio frequencies during our observations due to poor conditions, and we can only rely on radio upper limits to constrain the optically thick spectral index . Here, we therefore consider the two following cases: (1) we fix , i.e. the value derived from the radio upper limits at 5.5 and 9 GHz; and (2) is left free to vary, but the broken power law is forced to match at least the upper limit at 5.5 GHz; the derived break frequencies must consequently be considered as lower limits. The best-fit models for the two cases are displayed in Figure 9 and Figure 10, respectively, and Table 8 lists the best-fit parameters.
Case 2 clearly is the best fit, with a reduced of 0.94, and is also the most phenomenologically relevant. Indeed, the derived parameters point towards a weak contribution to the XRT spectrum from a cold and truncated disk, while the coronal emission strongly dominates the X-ray emission. Likewise, the optical and near-IR spectrum is well described by the thermal emission from the viscous accretion disk, with an excess due to the synchrotron emission from the jet, both optically thick and thin, as the spectral break is located around Hz or 1.60 m. We nonetheless stress here that the location of the spectral break in the near-IR domain may be an artificial effect of the fitting process due to the lack of information between the radio and X-shooter data. We refer the reader to the next section for a discussion on the reliability of this location and the good agreement between the fit and the WISE flux densities obtained about a month after our observations.
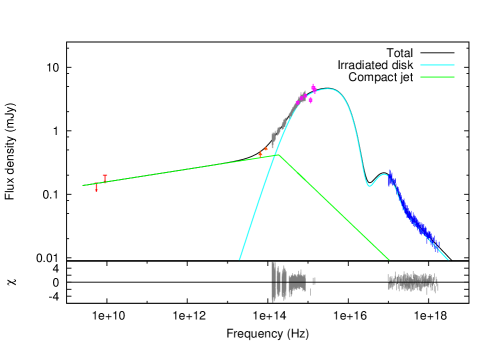
In contrast to Case 2, Case 1 is worse, with a reduced of 1.11. More importantly, it is also less relevant from a physical point of view as the derived ratio between the Comptonization component and the unilluminated disk is inconsistent with hard state spectra of microquasars, with , whereas a value larger than 1 is expected. A possible explanation is that the fitting process tends to overestimate the contribution from the jet at the expense of that from the corona. Furthermore, while theoretically not ruled out (Blandford & Konigl, 1979), an optically thick synchrotron spectral index of 0.6 has, to our knowledge, never been observed for Swift J1753.50127. In Soleri & Fender (2011), the authors report on several radio spectral indices observed between 2005 and 2009 and find a maximum index of about 0.3, which is similar to the value we report in T15.
| tbabsdiskir | tbabs(diskir+bbody) | tbabs(diskir+bknpow) | ||
| Case 1 | Case 2 | |||
| \tmark[a] | 0.01 | |||
| \tmark[b] | ||||
| \tmark[c] | ||||
| \tmark[d] | (fixed) | 60 (fixed) | (fixed) | (fixed) |
| \tmark[e] | ||||
| \tmark[f] | 0.10 (fixed) | 0.10 (fixed) | 0.10 (fixed) | 0.10 (fixed) |
| \tmark[g] | 0 (fixed) | 0 (fixed) | 0 (fixed) | 0 (fixed) |
| \tmark[h] | ||||
| \tmark[i] | ||||
| \tmark[j] | 1.0001 (fixed) | 1.0001 (fixed) | 1.0001 (fixed) | 1.0001 (fixed) |
| (fixed) | ||||
| \tmark[l] | ||||
| \tmark[m] | ||||
| \tmark[n] | 237625 | |||
| \tmark[o] | 0.91 | |||
| (d.o.f) | 6.09 (6344) | 0.93 (6342) | 1.11 (6344) | 0.94 (6343) |
V. Discussion
The following discussion is based on our best-fit results for Case 2 and, unless stated otherwise, we assume the following system parameters: (1) 40° inclination; (2) a mass ratio (lower limits, Neustroev et al., 2014); (3) BH mass; (4) semi-major axis (upper limits, Neustroev et al., 2014); and (5) 3 kpc distance, which roughly corresponds to the expected value for a 5 BH (Froning et al., 2014). Using the approximate formulas given in Eggleton (1983) and Frank et al. (2002), we derive a Roche lobe radius cm, a tidal radius cm, and a circularization radius cm. Finally, in the Keplerian approximation, the velocity of the accretion disk region that most contributes to a given Gaussian line is related to its FWHM in km s-1 as
| (1) |
If the line is double-peaked, we also can derive the Keplerian velocity from the peak-to-peak separation following
| (2) |
The Keplerian radius of the region that most contributes to the lines is then given by
| (3) |
where is the gravitational radius.
V.1. The accretion disk properties
All our SED fits listed in Table 8 point towards a very truncated accretion disk. From our best fit, we infer an inner radius cm and an outer radius cm for case 2. If we assume that the trough detected in the optical spectrum is H absorption from the disk, then Equation 1 and Equation 3 also lead to . Likewise, assuming H originates from the outer accretion disk, we infer cm from both its FWHM and peak-to-peak separation. Both our SED modeling and X-shooter spectrum are therefore consistent with each other and point towards a small and very truncated accretion disk, with . Such a large truncation is possible for an ADAF-like flow, but it is thought to be typical of the quiescent state of microquasars, during which their luminosity drops below (Narayan & McClintock, 2008). In contrast, the Swift J1753.50127 bolometric luminosity during our observation is about , more typical of a relatively faint hard state. Interestingly, another outlier, GRO J0422+32, was found to have an even larger disk/ADAF transition radius (Esin et al., 1998) ; this might hint at the presence of very large truncations in the hard state of outliers.
The low number of emission lines, likely all double-peaked, in the spectrum of Swift J1753.50127 is in stark contrast to the wealth of emission lines, mostly single-peaked, detected in the hard state optical/near-IR spectra of other microquasars (see e.g. Bandyopadhyay et al., 1997; Wu et al., 2001; Rahoui et al., 2014). Outer regions of accretion disks can be directly illuminated by the hard X-ray emission from the Comptonization component and/or the compact jets in the hard state, resulting into strong UV/optical/near-IR excess. The paucity of emission lines as well as the fact that a significant fraction of the X-shooter continuum can be explained solely by the thermal emission from the viscous accretion disk therefore hints at a very low level of outer accretion disk irradiation.
Possible reasons are the low X-ray luminosity or the outer accretion disk not being flared up. However, even a weak X-ray illumination of the accretion disk chromosphere is thought to create an inflated envelope (Begelman et al., 1983) that, in the hard state, would likely play an important role in reflecting a significant fraction of the X-ray emission back to the outer regions, where it would be thermalized (Begelman & McKee, 1983; Jimenez-Garate et al., 2002; Gierliński et al., 2009). Following Begelman et al. (1983), such an envelope could exist in a quasi-hydrostatic equilibrium at any radius in the disk if , where
| (4) |
is the Compton temperature, with the irradiating X-ray luminosity, and
| (5) |
is the escape temperature. Equating Equation 4 and Equation 5 leads to the typical radius within which the envelope is in quasi-hydrostatic equilibrium
| (6) |
also called the Compton radius. For the Swift J1753.50127 parameters and X-ray emission, this results in K and . In the GX 3394 case, in which a high level of X-ray irradiation is found (Rahoui et al., 2014), the same calculations lead to K and compared to . The quasi-hydrostatic envelope therefore covers about 40% of the accretion disk in Swift J1753.50127 versus 67% in GX 3394. Even if other parameters may account for the low level of thermalized hard X-ray photons, a reasonable explanation is thus that a significant fraction of hard X-ray photons do not reach the outer regions of the accretion disk. It is also interesting that the Compton temperature is more than four times larger in Swift J1753.50127 than GX 3394 despite the latter being ten times more X-ray luminous than the former ( vs , respectively). In the X-ray spectrum of GX 3394 in the hard state, a significant contribution from the accretion disk is present (Rahoui et al., 2012). In contrast, the Swift J1753.50127 X-ray emission mostly stems from Comptonization (see the next section and T15). This actually illustrates the fact that Compton heating is as sensitive to the hardness of the X-ray spectrum as to the X-ray luminosity itself (see Equation 4). This is why bright hard states of microquasars could be more favorable than soft states to Compton heating of accretion disk chromospheres and the presence of thermally driven winds launched from the envelope (see Rahoui et al., 2014, for a discussion on GX 3394). Nonetheless, a necessary condition is that the irradiating X-ray emission is at least twice as bright than a critical luminosity defined as
| (7) |
The presence of Compton-heated winds can therefore be ruled out for Swift J1753.50127 as , to compare to a luminosity of about .
V.2. The compact jet emission and the origin of the X-ray emission
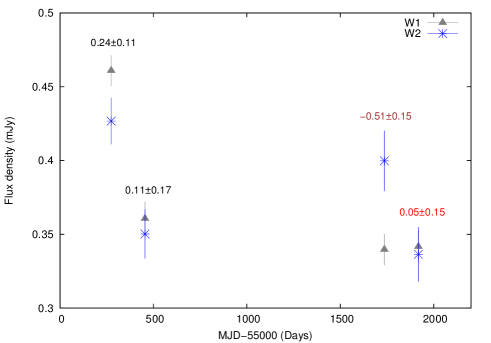
The SED modeling points towards the detection of the compact jet in the near-IR via, at least, an optically thin synchrotron component well-constrained by the presence of a near-IR excess. But whether optically thick synchrotron emission contributes to the optical/near-IR domain depends on the frequency turnover and the non-detection of the source in the radio domain strongly limits our capacity to constrain its location although it is very likely beyond Hz. We note that the W1 and W2 WISE flux densities obtained about one month after our observations are almost consistent with our Case 2 scenario, for which the spectral break is located in the near-IR domain, beyond Hz. If a coincidence cannot be ruled out, this could also mean that the average compact jet emission was relatively constant over a few months and that Case 2 properly describes the jet properties. To check to which extent such a weakly-inverted infrared emission is common, we measured the mid-infrared slopes at other epochs based on the archival WISE data. Figure 11 displays the dereddened W1 and W2 WISE flux densities of Swift J1753.50127 for MJD 55274, MJD 55454, MJD 56736, and MJD 56918; note that we do not include the measurements for MJD 55456 as they are similar to those on MJD 55454. These flux densities were first corrected for the accretion disk contribution as measured in our fits. We thus assume that the accretion disk emission is relatively constant, which is reasonable considering the low variability of the optical magnitudes of the source since the decay of the initial outburst (see Figure 1 in Shaw et al., 2013). Assuming that no other component, in particular dust, contributed (see e.g. Rahoui et al., 2010; Chaty & Rahoui, 2012), these flux densities therefore trace the compact jet emission and we can estimate the spectral index of its synchrotron radiation at each epoch. Besides MJD 56918 data that we already show in our fits, we find that this index was also positive and consistent with optically thick synchrotron on MJD 55274 and MJD 55454 (hence MJD 55456) which strengthens the possibility that the spectral break was indeed located in the near-IR domain during our observations. In contrast, the spectral index is negative and consistent with optically thin synchrotron only once, on MJD 56736. Interestingly, these WISE data were obtained about 20 days before our April 2014 observations. This is consistent with the results presented in T15, where we find that the compact jet synchrotron emission in the WISE bands was optically thin, and where we report a spectral break in the range Hz, derived with much better radio constraints when the X-ray luminosity of Swift J1753.50127 was about 50% lower. It is therefore very likely that the turnover shifted to higher frequencies in August compared to April, especially considering that the near-IR excess was much larger, hinting at a more important contribution from the compact jet. Such behavior may be expected as or whether we consider a radiatively efficient or inefficient flow, respectively (Falcke & Biermann, 1995; Heinz & Sunyaev, 2003). However, Russell et al. (2013) did not find any correlation between the spectral break frequency and the X-ray luminosity, and other parameters such as the base radius of the jet and/or the strength of the magnetic field must be considered (see e.g. Chaty et al., 2011; Gandhi et al., 2011); a detailed analysis is out of the scope of this paper and we refer to T15 for a comprehensive discussion of the compact jet energetics.
Nonetheless, whichever spectral break frequency we consider, it is clear that the optically thin synchrotron from the compact jet marginally contributes to the soft X-ray spectrum, which almost completely stems from the Comptonization component. This is a property that Swift J1753.50127 shares with other outliers, such as XTE J1650500 (Corbel et al., 2004), XTE J1720318, (Chaty & Bessolaz, 2006) and Cygnus X-1 (Rahoui et al., 2011). Outliers are characterized by a steeper X-ray/radio correlation so that the radio flux density for a given X-ray luminosity is systematically lower than what is expected. A possible explanation, dubbed the radio quiet hypothesis, is that compact jets in outliers are intrinsically weaker. On the other hand, Coriat et al. (2011) estimated for H1743322 and proposed that the accretion flow in outliers may rather be radiatively efficient () as opposed to “standard” microquasars for which it is radiatively inefficient (); this is the X-ray bright hypothesis. An alternative explanation still consistent with the X-ray bright phenomenon is however the presence of an extra component in the soft X-ray band that is not related to the jet but contributes to the X-ray emission, effectively creating an X-ray excess. What this component could be is a matter of debate, but the geometry of the system, i.e. a highly truncated accretion disk and a large ADAF-like Comptonization component, could be consistent with the presence of the condensation-induced residual inner accretion disk predicted by evaporation models (Liu & Meyer-Hofmeister, 2001; Liu et al., 2007; Meyer-Hofmeister & Meyer, 2014). These residual disks could be irradiated by the hard X-rays but would only carry a very small fraction of the total accreted material. They could in consequence be responsible for an excess soft X-ray emission while contributing very little to the fueling of the compact jet. Finally, Coriat et al. (2011) showed that H1743322 transitions back to the “standard” radio/X-ray track below a critical luminosity, and this behavior was also observed in XTE J1550564 (Russell et al., 2010) and XTE J1752533 (Ratti et al., 2012). This could also be explained by the presence of a residual inner disk, as the model predicts that such a disk can only exist between about (see Meyer-Hofmeister & Meyer, 2014, for a more detailed discussion on the effects of residual disks on the X-ray/radio correlation in microquasars).
VI. Summary and conclusion
We have presented a multiwavelength study of the outlier Swift J1753.50127 that focused primarily on its X-shooter spectrum. Based on the spectral analysis of double-peaked emission lines as well as SED modeling, we find that the optical and near-IR emission of the source mostly stems from the thermal radiation of a very truncated accretion disk, with . There also is a significant contribution from the compact jet, the spectral break of which may be located in the near-IR. Nonetheless, its optically thin synchrotron radiation cannot account for the soft X-ray emission of Swift J1753.50127, which mainly originates from a very large ADAF-like Comptonization component. Finally, the level of irradiation of the outer accretion disk is low, and we propose that this may be due to the relative compactness of a hard X-ray-induced envelope above the disk plane that cannot reflect enough X-ray photons back to the outer regions.
Although the presence of strongly truncated accretion disks in the hard state of microquasars is still a matter of debate, our results and those presented in T15 are consistent with previous multiwavelength studies of Swift J1753.50127 that all hint at large inner radii (see e.g. Zhang et al., 2010; Froning et al., 2014). On the other hand, several authors claimed the detection of a cold accretion disk extending to the ISCO (Reis et al., 2009; Reynolds et al., 2010; Mostafa et al., 2013), based solely on X-ray data, in particular the detection of iron emission lines. These seemingly contradictory results can be reconciled if we consider the presence of both a strongly truncated disk and a residual one created by condensation of the Comptonization component. This illustrates the importance of quasi-simultaneous X-ray and optical/near-IR datasets to constrain the properties of accretion disks. We therefore recommend further multiwavelength observations of outliers to understand to which extent the presence of residual inner disks may be a common pattern.
Acknowledgments
We thank the referee for her/his very insightful and constructive comments. FR thanks the ESO staff who performed the service observations. JAT acknowledges partial support from NASA under Swift Guest Observer grants NNX13AJ81G and NNX14AC56G. SC acknowledges the financial support from the UnivEarthS Labex programme of Sorbonne Paris Cité (ANR-10-LABX-0023 and ANR-11-IDEX-0005-02), and from the CHAOS project ANR-12-BS05-0009 supported by the French Research National Agency. EK acknowledges support from TUBITAK BIDEB 2219 program. This work was supported by the Spanish Ministerio de Economía y Competitividad (MINECO) under grant AYA2013-47447-C3-1-P (SM). This research has made use of data obtained from the High Energy Astrophysics Science Archive Research Center (HEASARC), provided by NASA’s Goddard Space Flight Center. This publication also makes use of data products from NEOWISE, which is a project of the Jet Propulsion Laboratory/California Institute of Technology, funded by the Planetary Science Division of the National Aeronautics and Space Administration. The Australia Telescope Compact Array is part of the Australia Telescope which is funded by the Commonwealth of Australia for operation as a National Facility managed by CSIRO. This research has made use of NASA’s Astrophysics Data System, of the SIMBAD, and VizieR databases operated at CDS, Strasbourg, France.
References
- Bandyopadhyay et al. (1997) Bandyopadhyay, R., Shahbaz, T., Charles, P. A., van Kerkwijk, M. H., & Naylor, T. 1997, MNRAS, 285, 718
- Begelman & McKee (1983) Begelman, M. C., & McKee, C. F. 1983, ApJ, 271, 89
- Begelman et al. (1983) Begelman, M. C., McKee, C. F., & Shields, G. A. 1983, ApJ, 271, 70
- Bianchini et al. (1997) Bianchini, A., della Valle, M., Masetti, N., & Margoni, R. 1997, A&A, 321, 477
- Blandford & Konigl (1979) Blandford, R. D., & Konigl, A. 1979, ApJ, 232, 34
- Boyajian et al. (2012) Boyajian, T. S., et al. 2012, ApJ, 757, 112
- Burrows et al. (2005) Burrows, D. N., et al. 2005, Space Sci. Rev., 120, 165
- Cadolle Bel et al. (2007) Cadolle Bel, M., et al. 2007, ApJ, 659, 549
- Callanan et al. (1995) Callanan, P. J., et al. 1995, ApJ, 441, 786
- Chaty & Bessolaz (2006) Chaty, S., & Bessolaz, N. 2006, A&A, 455, 639
- Chaty et al. (2011) Chaty, S., Dubus, G., & Raichoor, A. 2011, A&A, 529, A3+
- Chaty et al. (2003) Chaty, S., Haswell, C. A., Malzac, J., Hynes, R. I., Shrader, C. R., & Cui, W. 2003, MNRAS, 346, 689
- Chaty & Rahoui (2012) Chaty, S., & Rahoui, F. 2012, ApJ, 751, 150
- Corbel et al. (2013) Corbel, S., Coriat, M., Brocksopp, C., Tzioumis, A. K., Fender, R. P., Tomsick, J. A., Buxton, M. M., & Bailyn, C. D. 2013, MNRAS, 428, 2500
- Corbel & Fender (2002) Corbel, S., & Fender, R. P. 2002, ApJL, 573, L35
- Corbel et al. (2004) Corbel, S., Fender, R. P., Tomsick, J. A., Tzioumis, A. K., & Tingay, S. 2004, ApJ, 617, 1272
- Corbel et al. (2000) Corbel, S., Fender, R. P., Tzioumis, A. K., Nowak, M., McIntyre, V., Durouchoux, P., & Sood, R. 2000, A&A, 359, 251
- Coriat et al. (2011) Coriat, M., et al. 2011, MNRAS, 414, 677
- Draine (2003) Draine, B. T. 2003, ARA&A, 41, 241
- Dubus et al. (2001) Dubus, G., Kim, R. S. J., Menou, K., Szkody, P., & Bowen, D. V. 2001, ApJ, 553, 307
- Durant et al. (2008) Durant, M., Gandhi, P., Shahbaz, T., Fabian, A. P., Miller, J., Dhillon, V. S., & Marsh, T. R. 2008, ApJL, 682, L45
- Durant et al. (2009) Durant, M., Gandhi, P., Shahbaz, T., Peralta, H. H., & Dhillon, V. S. 2009, MNRAS, 392, 309
- Eggleton (1983) Eggleton, P. P. 1983, ApJ, 268, 368
- Eikenberry et al. (1998) Eikenberry, S. S., Matthews, K., Murphy, Jr., T. W., Nelson, R. W., Morgan, E. H., Remillard, R. A., & Muno, M. 1998, ApJL, 506, L31
- Esin et al. (1998) Esin, A. A., Narayan, R., Cui, W., Grove, J. E., & Zhang, S.-N. 1998, ApJ, 505, 854
- Falcke & Biermann (1995) Falcke, H., & Biermann, P. L. 1995, A&A, 293, 665
- Fender et al. (2004) Fender, R. P., Belloni, T. M., & Gallo, E. 2004, MNRAS, 355, 1105
- Fitzpatrick (1999) Fitzpatrick, E. L. 1999, PASP, 111, 63
- Foight et al. (2015) Foight, D., Guver, T., Ozel, F., & Slane, P. 2015, ArXiv e-prints 1504.07274
- Frank et al. (2002) Frank, J., King, A., & Raine, D. J. 2002, Accretion Power in Astrophysics (Cambridge University Press)
- Freudling et al. (2013) Freudling, W., Romaniello, M., Bramich, D. M., Ballester, P., Forchi, V., García-Dabló, C. E., Moehler, S., & Neeser, M. J. 2013, A&A, 559, A96
- Froning et al. (2014) Froning, C. S., Maccarone, T. J., France, K., Winter, L., Robinson, E. L., Hynes, R. I., & Lewis, F. 2014, ApJ, 780, 48
- Gallo (2007) Gallo, E. 2007, in American Institute of Physics Conference Series, Vol. 924, The Multicolored Landscape of Compact Objects and Their Explosive Origins, ed. T. di Salvo, G. L. Israel, L. Piersant, L. Burderi, G. Matt, A. Tornambe, & M. T. Menna, 715–722
- Gallo et al. (2003) Gallo, E., Fender, R. P., & Pooley, G. G. 2003, MNRAS, 344, 60
- Gallo et al. (2014) Gallo, E., et al. 2014, MNRAS, 445, 290
- Gandhi et al. (2011) Gandhi, P., et al. 2011, ApJL, 740, L13+
- Gehrels et al. (2004) Gehrels, N., et al. 2004, ApJ, 611, 1005
- Gierliński et al. (2008) Gierliński, M., Done, C., & Page, K. 2008, MNRAS, 388, 753
- Gierliński et al. (2009) —. 2009, MNRAS, 392, 1106
- Güver & Özel (2009) Güver, T., & Özel, F. 2009, MNRAS, 400, 2050
- Hannikainen et al. (1998) Hannikainen, D. C., Hunstead, R. W., Campbell-Wilson, D., & Sood, R. K. 1998, A&A, 337, 460
- Heinz & Sunyaev (2003) Heinz, S., & Sunyaev, R. A. 2003, MNRAS, 343, L59
- Jenniskens & Desert (1994) Jenniskens, P., & Desert, F.-X. 1994, A&AS, 106, 39
- Jimenez-Garate et al. (2002) Jimenez-Garate, M. A., Raymond, J. C., & Liedahl, D. A. 2002, ApJ, 581, 1297
- La Dous (1989) La Dous, C. 1989, A&A, 211, 131
- Liu & Meyer-Hofmeister (2001) Liu, B. F., & Meyer-Hofmeister, E. 2001, A&A, 372, 386
- Liu et al. (2007) Liu, B. F., Taam, R. E., Meyer-Hofmeister, E., & Meyer, F. 2007, ApJ, 671, 695
- Mainzer et al. (2014) Mainzer, A., et al. 2014, ApJ, 792, 30
- Meyer-Hofmeister & Meyer (2014) Meyer-Hofmeister, E., & Meyer, F. 2014, A&A, 562, A142
- Mostafa et al. (2013) Mostafa, R., Mendez, M., Hiemstra, B., Soleri, P., Belloni, T., Ibrahim, A. I., & Yasein, M. N. 2013, MNRAS, 431, 2341
- Munari & Zwitter (1997) Munari, U., & Zwitter, T. 1997, A&A, 318, 269
- Narayan & McClintock (2008) Narayan, R., & McClintock, J. E. 2008, New Astron. Rev., 51, 733
- Narayan & Yi (1995) Narayan, R., & Yi, I. 1995, ApJ, 452, 710
- Neustroev et al. (2014) Neustroev, V. V., Veledina, A., Poutanen, J., Zharikov, S. V., Tsygankov, S. S., Sjoberg, G., & Kajava, J. J. E. 2014, MNRAS, 445, 2424
- Palmer et al. (2005) Palmer, D. M., Barthelmey, S. D., Cummings, J. R., Gehrels, N., Krimm, H. A., Markwardt, C. B., Sakamoto, T., & Tueller, J. 2005, The Astronomer’s Telegram, 546, 1
- Poznanski et al. (2012) Poznanski, D., Prochaska, J. X., & Bloom, J. S. 2012, MNRAS, 426, 1465
- Rahoui et al. (2010) Rahoui, F., Chaty, S., Rodriguez, J., Fuchs, Y., Mirabel, I. F., & Pooley, G. G. 2010, ApJ, 715, 1191
- Rahoui et al. (2014) Rahoui, F., Coriat, M., & Lee, J. C. 2014, MNRAS, 442, 1610
- Rahoui et al. (2011) Rahoui, F., Lee, J. C., Heinz, S., Hines, D. C., Pottschmidt, K., Wilms, J., & Grinberg, V. 2011, ApJ, 736, 63
- Rahoui et al. (2012) Rahoui, F., et al. 2012, MNRAS, 422, 2202
- Ratti et al. (2012) Ratti, E. M., et al. 2012, MNRAS, 423, 2656
- Reis et al. (2009) Reis, R. C., Fabian, A. C., Ross, R. R., & Miller, J. M. 2009, MNRAS, 395, 1257
- Reynolds et al. (2010) Reynolds, M. T., Miller, J. M., Homan, J., & Miniutti, G. 2010, ApJ, 709, 358
- Roming et al. (2005) Roming, P. W. A., et al. 2005, Space Sci. Rev., 120, 95
- Russell et al. (2006) Russell, D. M., Fender, R. P., Hynes, R. I., Brocksopp, C., Homan, J., Jonker, P. G., & Buxton, M. M. 2006, MNRAS, 371, 1334
- Russell et al. (2010) Russell, D. M., Maitra, D., Dunn, R. J. H., & Markoff, S. 2010, MNRAS, 405, 1759
- Russell et al. (2013) Russell, D. M., et al. 2013, MNRAS, 429, 815
- Sault et al. (1995) Sault, R. J., Teuben, P. J., & Wright, M. C. H. 1995, in Astronomical Society of the Pacific Conference Series, Vol. 77, Astronomical Data Analysis Software and Systems IV, ed. R. A. Shaw, H. E. Payne, & J. J. E. Hayes, 433
- Shakura & Syunyaev (1973) Shakura, N. I., & Syunyaev, R. A. 1973, A&A, 24, 337
- Shaw et al. (2013) Shaw, A. W., et al. 2013, MNRAS, 433, 740
- Soleri & Fender (2011) Soleri, P., & Fender, R. 2011, MNRAS, 413, 2269
- Soria et al. (2000) Soria, R., Wu, K., & Hunstead, R. W. 2000, ApJ, 539, 445
- Titarchuk (1994) Titarchuk, L. 1994, ApJ, 434, 570
- Tomsick et al. (2015) Tomsick, J. A., et al. 2015, ApJ, in press, astro-ph 1506.06780
- Torres et al. (2005) Torres, M. A. P., et al. 2005, The Astronomer’s Telegram, 566, 1
- Vernet et al. (2011) Vernet, J., et al. 2011, A&A, 536, A105
- Wilms et al. (2000) Wilms, J., Allen, A., & McCray, R. 2000, ApJ, 542, 914
- Wilson et al. (2011) Wilson, W. E., et al. 2011, MNRAS, 416, 832
- Wright et al. (2010) Wright, E. L., et al. 2010, AJ, 140, 1868
- Wu et al. (2001) Wu, K., Soria, R., Hunstead, R. W., & Johnston, H. M. 2001, MNRAS, 320, 177
- Zhang et al. (2010) Zhang, H., Yuan, F., & Chaty, S. 2010, ApJ, 717, 929
- Zurita et al. (2008) Zurita, C., Durant, M., Torres, M. A. P., Shahbaz, T., Casares, J., & Steeghs, D. 2008, ApJ, 681, 1458