light-gray
Measuring Word Significance
using
Distributed
Representations of Words
Abstract
Distributed representations of words as real-valued vectors in a relatively low-dimensional space aim at extracting syntactic and semantic features from large text corpora. A recently introduced neural network, named word2vec [Mikolov et al., 2013a, Mikolov et al., 2013b], was shown to encode semantic information in the direction of the word vectors. In this brief report, it is proposed to use the length of the vectors, together with the term frequency, as measure of word significance in a corpus. Experimental evidence using a domain-specific corpus of abstracts is presented to support this proposal. A useful visualization technique for text corpora emerges, where words are mapped onto a two-dimensional plane and automatically ranked by significance.
1 Introduction
Discovering the underlying topics or discourses in large text corpora is a challenging task in natural language processing (NLP). A statistical approach often starts by determining the frequency of occurrence of terms across the corpus, and using the term frequency as a criterion for word significance—a thesis put forward in a seminal paper by Luhn [Luhn, 1958]. From the list of terms ranked by frequency, terms that are either too rare or too common are usually dropped, for they are of little use. For a domain-specific corpus, the top ranked terms in the trimmed list often nicely summarize the main topics of the corpus, as will be illustrated below.
For more detailed corpus analysis, such as discovering the subtopics covered by the documents in the corpus, the term frequency list by itself is, however, of limited use. The main problem is that within a given frequency range, function words, which primarily have an organizing function and carry little or no meaning, appear together with content words, which represent central features of texts and carry the meaning of the context. In other words, the rank of a term in the frequency list is by itself not indicative of meaning [Luhn, 1958].
This problem can be tackled by replacing the corpus-wide term frequency with a more refined weighting scheme based on document-specific term frequency [Aizawa, 2000]. In such a scheme, a document is taken as the context in which a word appears. Since key words are typically repeated in a document, they tend to cluster and to be less evenly distributed across a text corpus than function words of the same frequency. The fraction of documents containing a given term can then be used to distinguish them. Much more elaborate statistical methods have been developed to further explore the distribution of terms in collections of documents, such as topic modeling [Blei et al., 2003] and spacing statistics [Ortuño et al., 2002].
An even more refined weighting scheme is obtained by reducing the context of a word from the document in which it appears to a window of just a few words. Such a scheme is suggested by Harris’ distributional hypothesis [Harris, 1954] which states “that it is possible to define a linguistic structure solely in terms of the ‘distributions’ (= patterns of co-occurrences) of its elements”, or as Firth famously put it [Firth, 1957] “a word is characterized by the company it keeps”.
Word co-occurrence is at the heart of several machine learning algorithms, including the recently introduced word2vec by Mikolov and collaborators [Mikolov et al., 2013a, Mikolov et al., 2013b]. Word2vec is a neural network with a single hidden layer that uses word co-occurrence for learning a relatively low-dimensional vector representation of each word in a corpus, a so-called distributed representation [Hinton, 1986]. The dimension is typically chosen of order 100 or 1000. This is easily orders of magnitude smaller than the size of a vocabulary, which would be the dimension when a one-hot representation of words is chosen instead. Given the words appearing in a context, the neural network learns by predicting (the representation of) the word in the middle, or vice versa. During training, words that appear in similar contexts are grouped together in the same direction by this unsupervised learning algorithm. The distributed representation thus ultimately captures semantic similarities between words. This has been impressively demonstrated by a series of experiments in the original word2vec papers, where semantic similarity was measured by the dot product between normalized vectors.
In this brief report, we consider the problem of identifying significant terms that give information about content in text corpora made up of short texts, such as abstracts of scientific papers, or news summaries. It is proposed to use the L2 norm, or length of a word vector, in combination with the term frequency, as measure of word significance.
In a discussion forum dedicated to word2vec,111http://groups.google.com/forum/#!forum/word2vec-toolkit it has been argued by some that the length of a vector merely reflects the frequency with which a word appears in the corpus, while others argued that it in addition reflects the similarity of the contexts in which a word appears. According to this thesis, a word that is consistently used in a similar context will be represented by a longer vector than a word of the same frequency that is used in different contexts. Below, we provide experimental support for this thesis. It is this property that justifies measuring significance by word vector length, for words represented by long vectors refer to a distinctive context.
It is further proposed that the scatter plot of word vector length versus term frequency of all the words in the vocabulary provides a useful two-dimensional visualization of a text corpus.
2 Dataset
For our experiments we use a dataset from the arXiv,222http://arxiv.org/ a repository of scientific preprints. The dataset consists of about 29k papers from one single subject class in the arXiv, viz. the hep-th section on theoretical high-energy physics posted in the period from January 1992 to April 2003. Although full papers are available, we consider only title and abstract of the papers, which have about 100 word tokens on average.333The dataset is available from the KDD Cup 2003 homepage http://www.sigkdd.org/kdd-cup-2003-network-mining-and-usage-log-analysis
LaTeX (or TeX) commands are removed from input through use of the detex program.444http://www.cs.purdue.edu/homes/trinkle/detex/ The input text is further converted to lowercase, and punctuation marks and special symbols are separated from words, as was done in the preprocessing step of a word2vec experiment by Mikolov on the IMDB dataset of movie reviews.555https://groups.google.com/forum/#!msg/word2vec-toolkit/Q49FIrNOQRo/J6KG8mUj45sJ
2.1 Term Frequency List
| term | ||
|---|---|---|
| theory | 1.90 | 27702 |
| field | 2.00 | 17510 |
| gauge | 2.13 | 15536 |
| string | 2.33 | 13523 |
| model | 2.19 | 12389 |
| quantum | 2.14 | 12307 |
| theories | 2.22 | 10528 |
| space | 2.18 | 8035 |
| also | 1.67 | 7907 |
| models | 2.39 | 7313 |
| two | 2.03 | 7286 |
| fields | 2.11 | 7261 |
| solutions | 2.49 | 7129 |
| show | 1.87 | 7125 |
| action | 2.39 | 6602 |
| one | 1.82 | 6440 |
| black | 3.24 | 6011 |
| dimensions | 2.34 | 5953 |
| symmetry | 2.35 | 5792 |
| group | 2.46 | 5696 |
| equations | 2.54 | 5509 |
| algebra | 2.70 | 5461 |
After removing stop words and punctuation marks, the list of 50 most frequently used words in the corpus reduces to the one given in Table 1. Deriving from a domain-specific dataset, this list indeed gives a succinct and fairly precise characterization of the hep-th corpus, which is primarily about “gauge theory”, “quantum field theories”, and “string theory”. It correctly reveals the importance of “models” in this research area, as well as the importance of the concepts “space”, “solutions”, “action”, “dimensions”, “symmetry group”, “equations”, and “algebra”. The term “black” refers to “black holes”, which play a distinctive role in this corpus. The term “also” is not filtered out by the NLTK666www.nltk.org/ stop word list we use. Finally, “show” (used exclusively as verb in this corpus, not as noun) appears mostly in the context “we show that” and reveals that a large portion of the corpus consists of research papers. Note that “show” is the only verb besides the stop word “be” that made it into the top 50 list.
3 Experiments
We next turn to word2vec.777The code is available for download at https:// code.google.com/p/word2vec For training the neural network, we use the same parameter settings as advertised for the IMDB dataset referred to above.888Specifically, the parameters used are: word2vec -train $inputfile -output $outputfile -cbow 0 -size 100 -window 10 -negative 5 -hs 0 -sample 1e-4 -threads 40 -binary 0 -iter 20 -min-count 1 With these settings, the vector dimension is 100, the (maximum) context window size is 10, and the algorithm makes 20 passes through the dataset for learning. The total number of tokens processed by the algorithm is 3.2M. As is typical for a highly specific domain, the vocabulary is relatively small, containing about 44k terms, of which about half is used only once.
3.1 Similarity Distribution
During training, similar words are grouped together in the same direction by the learning algorithm, so that after training the vectors encode word semantics. One of the most popular measures of semantic similarity in NLP is the cosine similarity given by the dot product between two normalized vectors. Denoting the cosine of the angle between the two vectors, the cosine similarity can take values in the interval .
To analyze the hep-th corpus, we built a histogram of the cosine similarity between arbitrarily chosen pairs of word vectors. The words are randomly selected from the vocabulary irrespective their frequency. We have, however, discarded terms that appear only once. The result, given in Fig. 1, is a bell-shaped distribution.
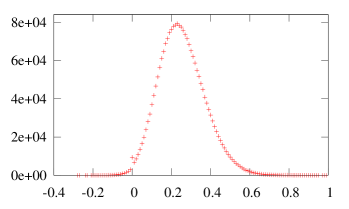
To our surprise, the distribution is not centered around zero, but around a positive value, . This means that word vectors in the hep-th corpus have on average a certain similarity. Closely related to this is that the average word vector is non-zero, having a small length, ( when words that only appear once are excluded). This vector marks the center of the word cloud spanned in the word vector space by all the words in the vocabulary.
To see if this behavior is shared by general purpose corpora, we considered Wikipedia by way of example.999For a cleaned version of the Wikipedia corpus from October 2013, see https://blog.lateral.io/2015/06/the-unknown-perils-of-mining-wikipedia/ For that corpus, covering diverse topics, we found, as expected, the histogram to be centered around zero (and slightly right skewed). The non-zero value found for the hep-th corpus is therefore probably a sign of the homogeneity of this dataset.
The reason for excluding terms that only appear once, which after all make up half of the vocabulary, is that they have their own bell-shaped distribution, slightly more peaked than the one shown in Fig. 1 and centered at a higher cosine similarity of about .
Note the outlier at zero cosine similarity in the distribution in Fig. 1. The reason for this outlier eludes us.
3.2 Vector Length as Significance Factor
To demonstrate that, besides depending on consistent use, the length of a word vector also depends on term frequency, we consider the months of the year, see Table 2. Apart from the word token “may”, which in addition denotes a verbal auxiliary and is therefore used in many different contexts, these terms consistently appear in the abstracts of the hep-th corpus to indicate the time of a school or conference where the paper was presented. The data clearly show that for fixed context, the vector length increases with term frequency, see Fig. 2.
| month | ||
|---|---|---|
| january | 4.16 | 16 |
| february | 4.19 | 15 |
| march | 4.90 | 37 |
| april | 4.07 | 13 |
| may | 2.23 | 2229 |
| june | 5.95 | 73 |
| july | 5.54 | 54 |
| august | 5.10 | 31 |
| september | 5.54 | 51 |
| october | 3.83 | 11 |
| november | 4.35 | 15 |
| december | 4.39 | 17 |
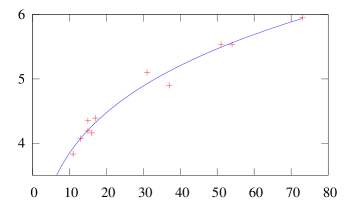
The three terms with the largest vector length are besides “june”, “school” () and “conference” (). If we take vector length as a measure of word significance, this finding surprisingly supports another thesis by Luhn [Luhn, 1958], which states that:
The more often certain words are found in each other’s company within a sentence, the more significance may be attributed to each of these words.
Here, the phrase “certain words” refers to words that
a writer normally repeats [] as he advances or varies his arguments and as he elaborates on an aspect of a subject.
Table 2 also nicely demonstrates that term frequency alone does not determine the length of a word vector. The term “may” has a much higher frequency than the other terms in the table, yet it is represented by the shortest vector. This is because it is used in the corpus mostly as a verbal auxiliary in opposing contexts. When a word appears in different contexts, its vector gets moved in different directions during updates. The final vector then represents some sort of weighted average over the various contexts. Averaging over vectors that point in different directions typically results in a vector that gets shorter with increasing number of different contexts in which the word appears. For words to be used in many different contexts, they must carry little meaning. Prime examples of such insignificant words are high-frequency stop words, which are indeed represented by short vectors despite their high term frequencies, see Table 3.
| term | ||
|---|---|---|
| the | 1.49 | 257866 |
| of | 1.51 | 148549 |
| . | 1.43 | 131022 |
| , | 1.41 | 84595 |
| in | 1.59 | 80056 |
| a | 1.61 | 72959 |
| and | 1.51 | 71170 |
| to | 1.61 | 53265 |
| we | 1.88 | 49756 |
| is | 1.69 | 49446 |
| for | 1.62 | 34970 |
| ) | 2.03 | 28878 |
3.3 Vector Length vs. Term Frequency
To study to what extent term frequency and word vector length can serve as indicators of a word’s significance, we represent all words in the vocabulary in a two-dimensional scatter plot using these variables as coordinates. Figure 3 gives the result for the hep-th corpus.
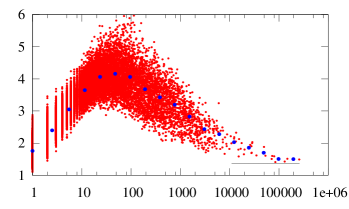
For given term frequency, the vector length is seen to take values only in a narrow interval. That interval initially shifts upwards with increasing frequency. Around a frequency of about 30, that trend reverses and the interval shifts downwards.
Both forces determining the length of a word vector are seen at work here. Small-frequency words tend to be used consistently, so that the more frequently such words appear, the longer their vectors. This tendency is reflected by the upwards trend in Fig. 3 at low frequencies. High-frequency words, on the other hand, tend to be used in many different contexts, the more so, the more frequently they occur. The averaging over an increasing number of different contexts shortens the vectors representing such words. This tendency is clearly reflected by the downwards trend in Fig. 3 at high frequencies, culminating in punctuation marks and stop words with short vectors at the very end.
Words represented by the longest vectors in a given frequency bin often carry the content of distinctive contexts. Typically, these contexts are topic-wise not at the core of the corpus but more on the outskirts. For example, the words with the longest vector in the high-frequency ranges with , “inflation” (), “sitter” () as in “de Sitter”, and “holes” () as in “black holes”, all refer to general relativity. General relativity, having its own subject class (gr-qc) in the arXiv, is not one of the main subjects of the hep-th corpus. It takes a distinctive position in this corpus as it mostly appears in studies that aim at reconciling general relativity with the laws of quantum mechanics.
3.4 POS Tagging
To further assess the ability of word vector length to measure word significance, we assign part-of-speech (POS) tags to each word in the corpus. For this task, we use the Stanford POS tagger101010Specifically, we use the english-caseless-left3words-distsim tagger. For details on this model and for downloading, see http://nlp.stanford.edu/software/tagger.shtml. [Toutanova et al., 2003]. The final tag assigned to a word in the vocabulary is decided by majority vote.
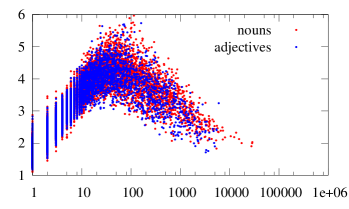
By the way that word2vec learns word representations, we expect nouns (excluding proper nouns) and adjectives to be similarly distributed in the - plane. This is indeed what we observe, see Fig. 4. Note that these word types pervade almost the entire region covered in the full plot in Fig. 3 by the complete vocabulary.
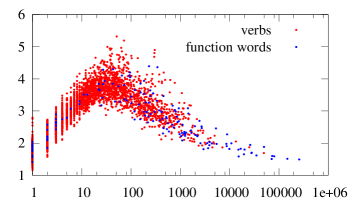
We also find verbs and adverbs to be similarly distributed in the - plane. Again this was to be expected given that word2vec learns word representations from word co-occurrences. Somewhat surprisingly, we observe in Fig. 5 that the distribution of verbs also overlaps with that of function words.111111As function words we classify: prepositions (IN), pronouns (PRP, PRP$, WP, WP$), determiners (DT, PDT, WDT), conjunctions (CC), modal verbs (MD), and particles (RP). In brackets, we included here the tags used by the Stanford POS tagger. These word types no longer pervade the entire region covered in the full plot, but are confined to the bottom band, corresponding to short vectors. The fact that function words are represented by short vectors underscores the ability of vector length to measure word significance.
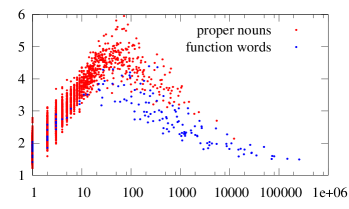
This proficiency is even more brought out by comparing the distribution of function words and proper nouns, which typically are indicative of distinctive contexts in the hep-th corpus. The plot in Fig. 6 shows a clear separation of proper nouns and function words for sufficiently large term frequencies.
3.5 Visualization
These results suggest an interesting technique for visualizing text corpora. By labeling the data points in the - scatter plot with their terms, one obtains a two-dimensional visualization of all the words in the vocabulary. One advantage of a - plot is that words are ranked by significance, thus allowing for effective exploration of a corpus. To deal with the large number of data points, an interactive visualization tool can be build that allows the user to navigate a mouse pointer over the plot, and that shows only the labels of the data points in the vicinity of the pointer.
There exist other techniques for visualizing high-dimensional data, such as the popular t-distributed stochastic neighbor embedding (t-SNE) [van der Maaten and Hinton, 2008]. That machine learning algorithm, being an example of multidimensional scaling, projects high-dimensional data points onto a plane such that the distances, or similarities between them are preserved as well as possible. Words of similar meaning thus tend to be projected together by the t-SNE algorithm. Since the cosine similarity is independent of vector lengths, word significance is ignored when using this measure. The t-SNE algorithm therefore arranges the data points entirely differently from our proposal. Moreover, in contrast to the axes in the - scatter plot, those in the t-SNE plot have no direct meaning.
4 Discussion
Most applications of distributed representations of words obtained through word2vec so far centered around semantics. A host of experiments have demonstrated the extent to which the direction of word vectors captures semantics. In this brief report, it was pointed out that not only the direction, but also the length of word vectors carries important information. Specifically, it was shown that word vector length furnishes, in combination with term frequency, a useful measure of word significance. Also an alternative to the t-SNE algorithm for projecting word vectors onto a plane was introduced, where words are ordered by significance rather than similarity.
We have restricted ourselves to unigrams in this exploratory study. For more extended experiments and applications, including important bi- and tri-grams into the vocabulary will certainly improve results. We have also restricted ourselves to running word2vec using parameters that were recommended by the developers, and have not attempted to optimize them.
Finally, the question arises whether word vectors produced by other highly scalable machine learning algorithms built on top of word co-occurrences, such as the log bilinear model [Mnih and Kavukcuoglu, 2013] and GloVe [Pennington et al., 2014], also encode word significance in their length.
References
- [Aizawa, 2000] Akiko Aizawa. 2000. The feature quantity: An information theoretic perspective of tfidf-like measures. In Proc. of ACM SIGIR 2000, pages 104–111, New York, NY. ACM Press.
- [Blei et al., 2003] David M. Blei, Andrew Y. Ng, and Michael I. Jordan. 2003. Latent dirichlet allocation. Journal of Machine Learning Research, 3:993–1022.
- [Firth, 1957] John R. Firth. 1957. A synopsis of linguistic theory 1930-1955. In Studies in linguistic analysis, pages 1–32. Blackwell, Oxford.
- [Harris, 1954] Zellig Harris. 1954. Distributional structure. Word, 10(23):146–162.
- [Hinton, 1986] Geoffrey E. Hinton. 1986. Learning distributed representations of concepts. In Proc. 8th Annual Conf. of the Cognitive Science Society, pages 1–12, Hillsdale, NJ. Erlbaum.
- [Luhn, 1958] Hans P. Luhn. 1958. The automatic creation of literature abstracts. IBM J. Res. Dev., 2(2):159–165.
- [van der Maaten and Hinton, 2008] Laurens van der Maaten and Geoffrey E. Hinton. 2008. Visualizing high-dimensional data using t-SNE. Journal of Machine Learning Research, 9:2579–2605.
- [Mikolov et al., 2013a] Tomas Mikolov, Kai Chen, Greg Corrado, and Jeffrey Dean. 2013a. Efficient estimation of word representations in vector space. In Proceedings of the International Conference on Learning Representations (ICLR).
- [Mikolov et al., 2013b] Tomas Mikolov, Ilya Sutskever, Kai Chen, Gregory S. Corrado, and Jeffrey Dean. 2013b. Distributed representations of words and phrases and their compositionality. In Advances in Neural Information Processing Systems 26, pages 3111–3119.
- [Mnih and Kavukcuoglu, 2013] Andriy Mnih and Koray Kavukcuoglu. 2013. Learning word embeddings efficiently with noise-contrastive estimation. In Advances in Neural Information Processing Systems 26, pages 2265–2273.
- [Ortuño et al., 2002] Miguel Ortuño, Pedro Carpena, Pedro Bernaola-Galván, Enrique Muñoz, and Andrés M. Somoza. 2002. Keyword detection in natural languages and DNA. Europhysics Letters, 57(5):759–764.
- [Pennington et al., 2014] Jeffrey Pennington, Richard Socher, and Christopher Manning. 2014. Glove: Global Vectors for Word Representation. In Proceedings of the 2014 Conference on Empirical Methods in Natural Language Processing (EMNLP), pages 1532–1543.
- [Toutanova et al., 2003] Kristina Toutanova, Dan Klein, Christopher D. Manning, and Yoram Singer. 2003. Feature-rich part-of-speech tagging with a cyclic dependency network. In Proceedings of the 2003 Conference of the North American Chapter of the Association for Computational Linguistics on Human Language Technology, volume 1, pages 173–180, Stroudsburg, PA. ACL.