The Mid-Infrared Instrument for the James Webb Space Telescope, I: Introduction
Abstract
MIRI (the Mid-Infrared Instrument for the James Webb Space Telescope (JWST)) operates from 5 to 28.5 m and combines over this range: 1.) unprecedented sensitivity levels; 2.) sub-arcsec angular resolution; 3.) freedom from atmospheric interference; 4.) the inherent stability of observing in space; and 5.) a suite of versatile capabilities including imaging, low and medium resolution spectroscopy (with an integral field unit), and coronagraphy. We illustrate the potential uses of this unique combination of capabilities with various science examples: 1.) imaging exoplanets; 2.) transit and eclipse spectroscopy of exoplanets; 3.) probing the first stages of star and planet formation, including identifying bioactive molecules; 4.) determining star formation rates and mass growth as galaxies are assembled; and 5.) characterizing the youngest massive galaxies.
1 Introduction
The growth in capabilities for infrared astronomy since the 1960s (Low et al., 2007) has been spectacular. What is little-appreciated is that the gains are not evenly distributed over even the wavelength range accessible from the ground. In the near infrared, there has been a gain of about 10,000 in detection limits and instruments have gone from single detectors to mosaics of arrays totaling nearly 100 million pixels (Caldwell et al., 2004; Dalton et al., 2006). By comparison, the sensitivity gains for mid-IR photometry from the 1970s are more like a factor of 30 (mostly due to the growth in telescope size) and until recently the largest arrays in use have no more than 100 thousand pixels (Kataza et al., 2000; Lagage et al., 2000)111VISIR has recently been upgraded to a a million pixels, that is 1000 times fewer than the most ambitious instruments in the NIR. Some major telescopes (e.g., Gemini, Keck) do not even offer general-purpose mid-IR instruments, i.e. wide field imagers and moderate resolution spectrometers.
The reason for this disparity is that the huge thermal background from the atmosphere and groundbased telescopes both blinds mid-infrared instruments and also overwhelms large-format detector arrays. Consequently, the mid-infrared range has been strongly dependent on cooled telescopes in space such as IRAS (the Infrared Astronomical Satellite), ISO (the Infrared Space Observatory), Spitzer, Akari, and WISE (the Wide-Field Infrared Survey Explorer). The elimination of thermal emission by the atmosphere and telescope for these missions resulted in huge gains in sensitivity. However, launching these telescopes into space imposed another limitation: they all had small apertures, of only 40 - 85 cm, and therefore provided limited angular resolution. In fact, for some of the mid-infrared bands on Spitzer, the ultimate sensitivity limit in deep imaging was set by confusion noise because of the limited angular resolution.
A simple comparison indicates the advance afforded by the James Webb Sace Telescope (JWST). Compared with 8-m groundbased telescopes (e.g., COMICS (the Cooled Mid-IR Camera and Spectrometer) on Subaru, CanariCam on the Gran Telescopio Canarias, VISIR (the VLT Imager and Spectrometer for the mid-IR) on the VLT (Very Large Telescope)), the angular resolution is similar but with a potential gain in imaging sensitivity by a factor of about 3000 and for moderate resolution (R = / 3000) spectroscopy a factor of about 1000 (see Glasse et al. (2014) (Paper IX) for more information about the MIRI sensitivity). Compared with Spitzer, the potential gain in the mid-IR where JWST is natural background limited (roughly 5 - 12 m) is about a factor of 50 (see http://www.stsci.edu/jwst/science/sensitivity for more comparisons). The factor of seven improvement over that mission in the diffraction limit with JWST (e.g., from an image full width at half maximum of 58 at 24 m with Spitzer to 07 at 21 m with JWST) is equivalent to going from a 330 Kpixel to a 16 Mpixel digital camera. That is, for the first time in the mid-IR, MIRI on JWST will combine: 1.) the incredible sensitivity levels just mentioned; 2.) sub-arcsec angular resolution; 3.) freedom from atmospheric interference; 4.) the inherent stability of observing in space; and 5.) a suite of versatile capabilities including imaging, low and moderate resolution spectroscopy (with an integral field unit), and coronagraphy.
This paper introduces a set of ten papers covering all aspects of MIRI and published by the Publications of the Astronomical Society of the Pacific, PASP volume 127, pages 584 - 696. The other papers can be consulted from PASP, or at the MIRI web site222http://ircamera.as.arizona.edu/MIRI. The latter has additional information about the instrument and will be updated as we progress toward launch in 2018.
2 MIRI and the JWST
“HST and Beyond” (Dressler et al., 1996) provided the initial momentum for a large, infrared-optimized space telescope333a concept then termed the Next Generation Space Telescope (NGST) that has led to JWST. The report described the science opportunities for wavelengths between 1 and 5m, strongly emphasizing the potential for extremely high redshift galaxy studies. Out of this concept came the “First Light Machine” theme. The telescope was then envisioned as an ambitious but relatively inexpensive mission for which a focused science program was appropriate. The core instruments were aligned with the “HST and Beyond” program; they consisted of an imager and a spectrometer both operating out to 5m. However, this report added “Extension of this telescope’s wavelength range shortward to about 0.5m and longward to at least 20m would greatly increase its versatility and productivity. The Committee strongly recommends this course ….”
The astronomy community understood the huge advances possible at the longer wavelengths, and almost immediately plans were explored for a Mid-Infrared Instrument (MIRI), building on the scientific momentum gained with the ISO results and the technical advances in preparation for Spitzer. The project decided that this instrument would require a 50/50 partnership between Europe and the US. Following separate competitive processes the MIRI team was selected on both sides of the Atlantic. Initially a cryostat to cool the instrument was to be provided by the European Space Agency (ESA), but this component was shifted to the US as part of the negotiations for ESA to supply the JWST launch vehicle. Eventually to save weight, a closed cycle cooler was adopted in place of the cryostat.
The MIRI optical system was built by the European Consortium of national efforts, from Belgium, Denmark, France, Germany, Ireland, the Netherlands, Spain, Sweden, Switzerland, and the United Kingdom, led by Gillian Wright, the European Principal Investigator, and Alistair Glasse, Instrument Scientist. EADS-Astrium provided the project office and management, and the full instrument test was conducted at Rutherford Appleton Laboratory. The Jet Propulsion Laboratory (JPL) provided the core instrument flight software, the detector system, including infrared detector arrays obtained from Raytheon Vision Systems, collaborated with Northrop Grumman Aerospace Systems on the cooler development and test, and managed the US effort. The JPL Instrument Scientist is Michael Ressler and the MIRI Science Team Lead is George Rieke. The fully tested instrument was delivered to Goddard Space Flight Center at the end of May, 2012, where it is being integrated with the other components of JWST. The Space Telescope Science Institute (STScI) is the JWST operations center and is developing software for the MIRI operations, user interaction, data reduction, and archive. However, the success in building MIRI and the work to integrate it with the rest of JWST, to devise plans for its use, and to support that use with data pipelines and analysis tools depends on the efforts of many MIRI team members in both Europe and the US. Some of these people appear as co-authors of the following papers, but there are many more.
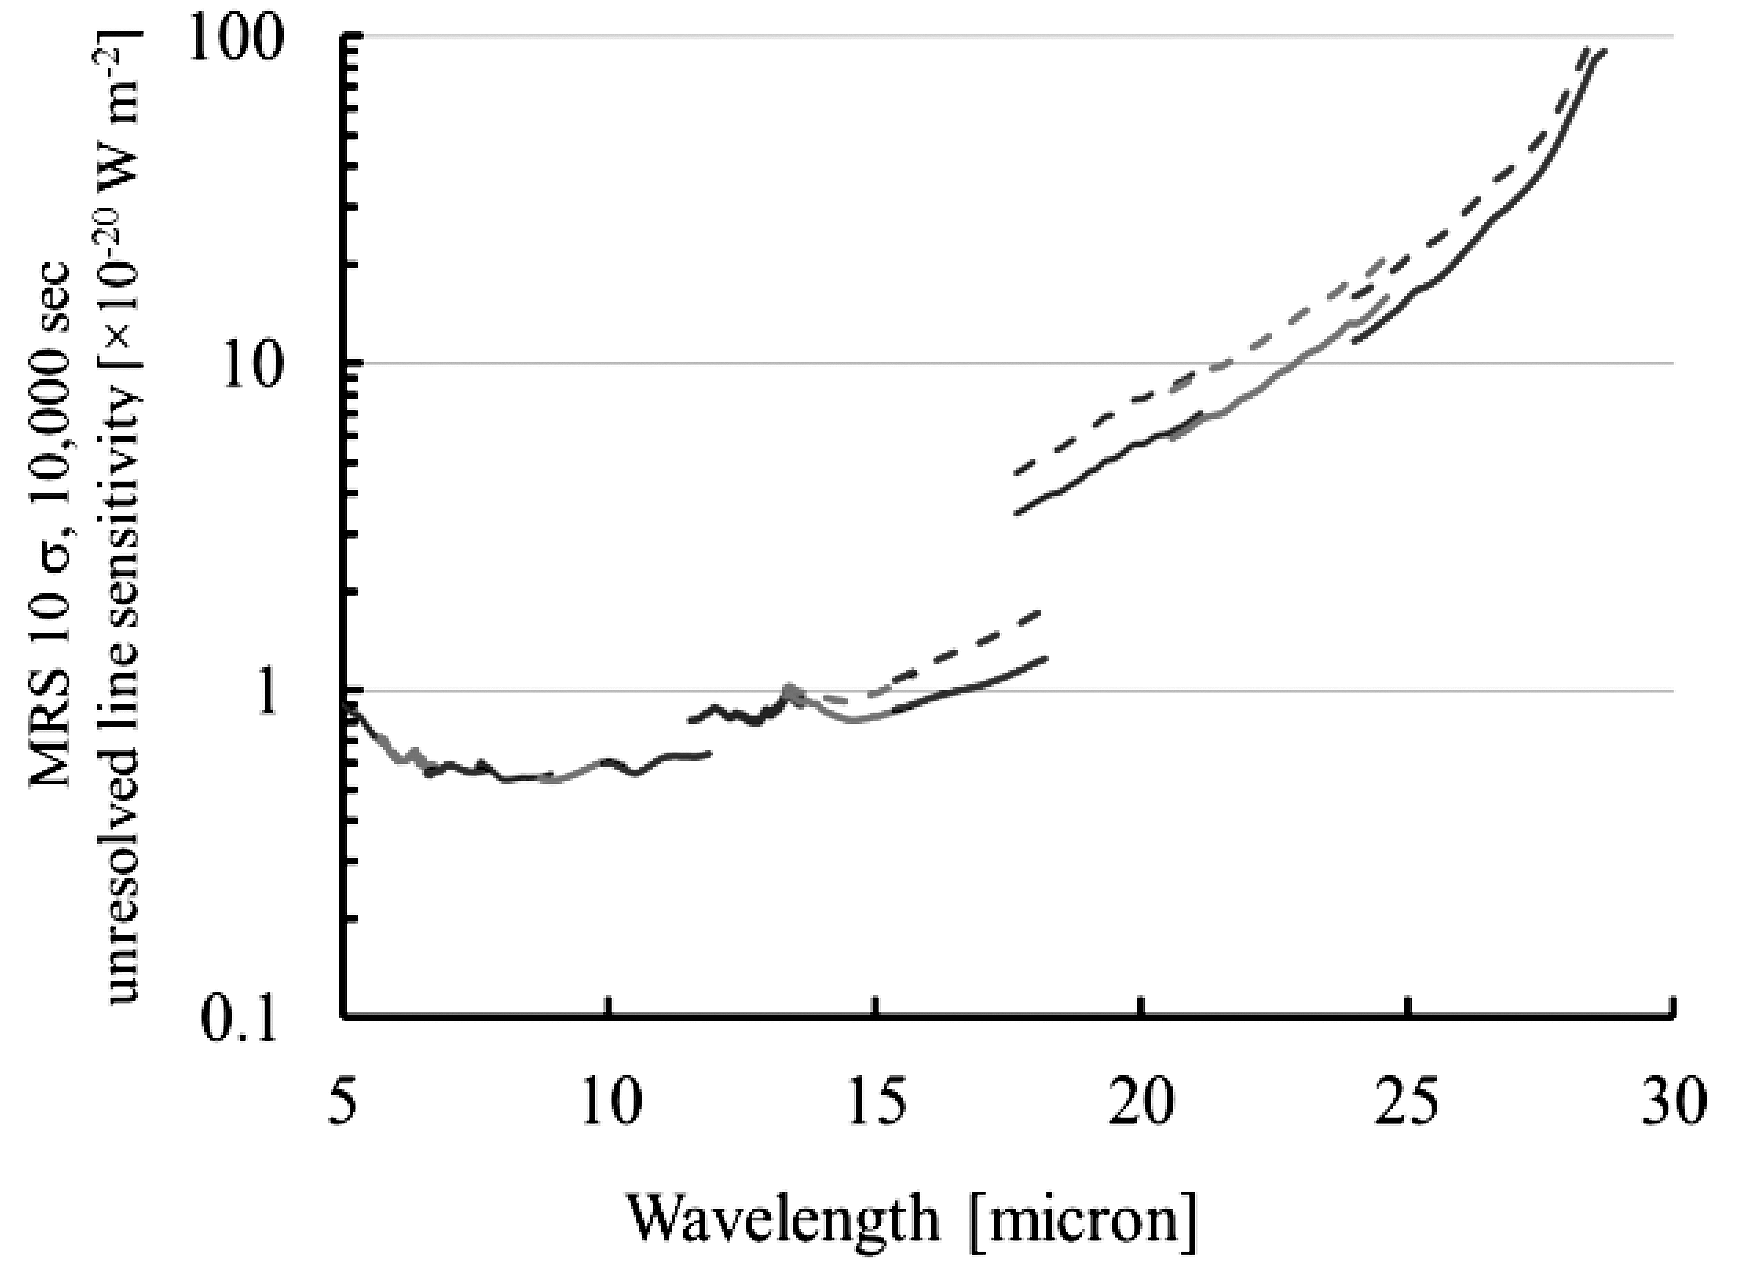
The MIRI design was driven by the need to provide a full suite of capabilities in a single instrument for wavelengths beyond 5 m. It therefore combines imaging, coronagraphy, low resolution spectroscopy, and medium-resolution, integral-field-unit spectroscopy. Tables 1, 2, and 3 and Figure 1 provide a high level summary of the instrument capabilities, based on current estimates (which remain uncertain in some areas, such as the level of emission from the observatory into the long wavelength MIRI bands). This information is provided here for convenience, but a more detailed summary is provided by Glasse et al. (2014) (Paper IX). The instrument images will be diffraction limited at all wavelengths, so their full width at half maxima is given by the expression 0.035 (m) arcsec. Additional information about MIRI can be found at http://ircamera.as.arizona.edu/MIRI and http://www.stsci.edu/jwst/instruments/miri/. Up-to-date estimates of the instrument sensitivity and other performance parameters should be obtained from these websites or from the relevant observing planning tools at STScI. We describe a few of the science programs enabled by these capabilities in the following section.
3 Sample Science Programs
The overall science capabilities of JWST are presented in Gardner et al. (2006). Rather than trying to condense that discussion, here we describe a small number of programs to highlight the impact of the unique capabilities provided by MIRI and in some cases to introduce new suggestions from the astronomical community for JWST programs.
3.1 Exoplanet Imaging
The discovery and study of exoplanets is the greatest astronomy initiative of the past decade. However, virtually all known exoplanets have been found indirectly - through their effect on the radial velocities of their stars, or by transit observations. Imaging of exoplanets is the next frontier; from the current successes (e.g., Kalas et al. (2008); Marois et al. (2008); Lagrange et al. (2010); Bailey et al. (2014)), it promises to be rich with discoveries. Exporing it thoroughly will reveal the regions of planetary systems beyond 10 AU and will return information needed to probe the origins and physical nature of the gas- and ice-giant planets that form in this region. The strength of the JWST instruments in general and MIRI in particular is their ability to image very faint planets, probing down to masses of order 0.1 - 0.2 M.
Possible methods for direct imaging of exoplanets have been evaluated by Beichman et al. (2010). The MIRI coronagraph is optimized for such studies, since its four quadrant phase masks (4QPMs) allow information to be obtained to within /D of the star. The large telescope aperture places this limit at about 5 AU at 10 pc for the coronagraph channels at 11 - 16m, and the sensitivity allows detection of low mass planets (see Figure 2). MIRI detects the thermal radiation (rather than reflected light) and hence is most sensitive to young exoplanets. Figure 2 summarizes the results of the Beichman et al. (2010) study; it projects that many planets are most detectable with MIRI among the JWST instruments. For the 25 most favorable cases, the study predicted that MIRI would have a high success rate in finding any planets with average masses of 1–2 MJup at average separations of 60 AU. More importantly, JWST will achieve detections with multiple instruments, and these cases are the ones where the additional information will allow testing theories of exoplanet evolution.
3.2 Transit and eclipse spectroscopy of exoplanets
The stability of observations from space has allowed HST and Spitzer to make a series of remarkable observations of transits and secondary eclipses by exoplanets during the past decade, initiating the study of their physical properties such as energy balance and atmospheric composition and circulation. The expansion of this field of study with JWST is described in Deming et al. (2009) and Fortney et al. (2013). From the former paper, we take one example that builds on the unprecedented sensitivity of MIRI and the stability of the space environment.
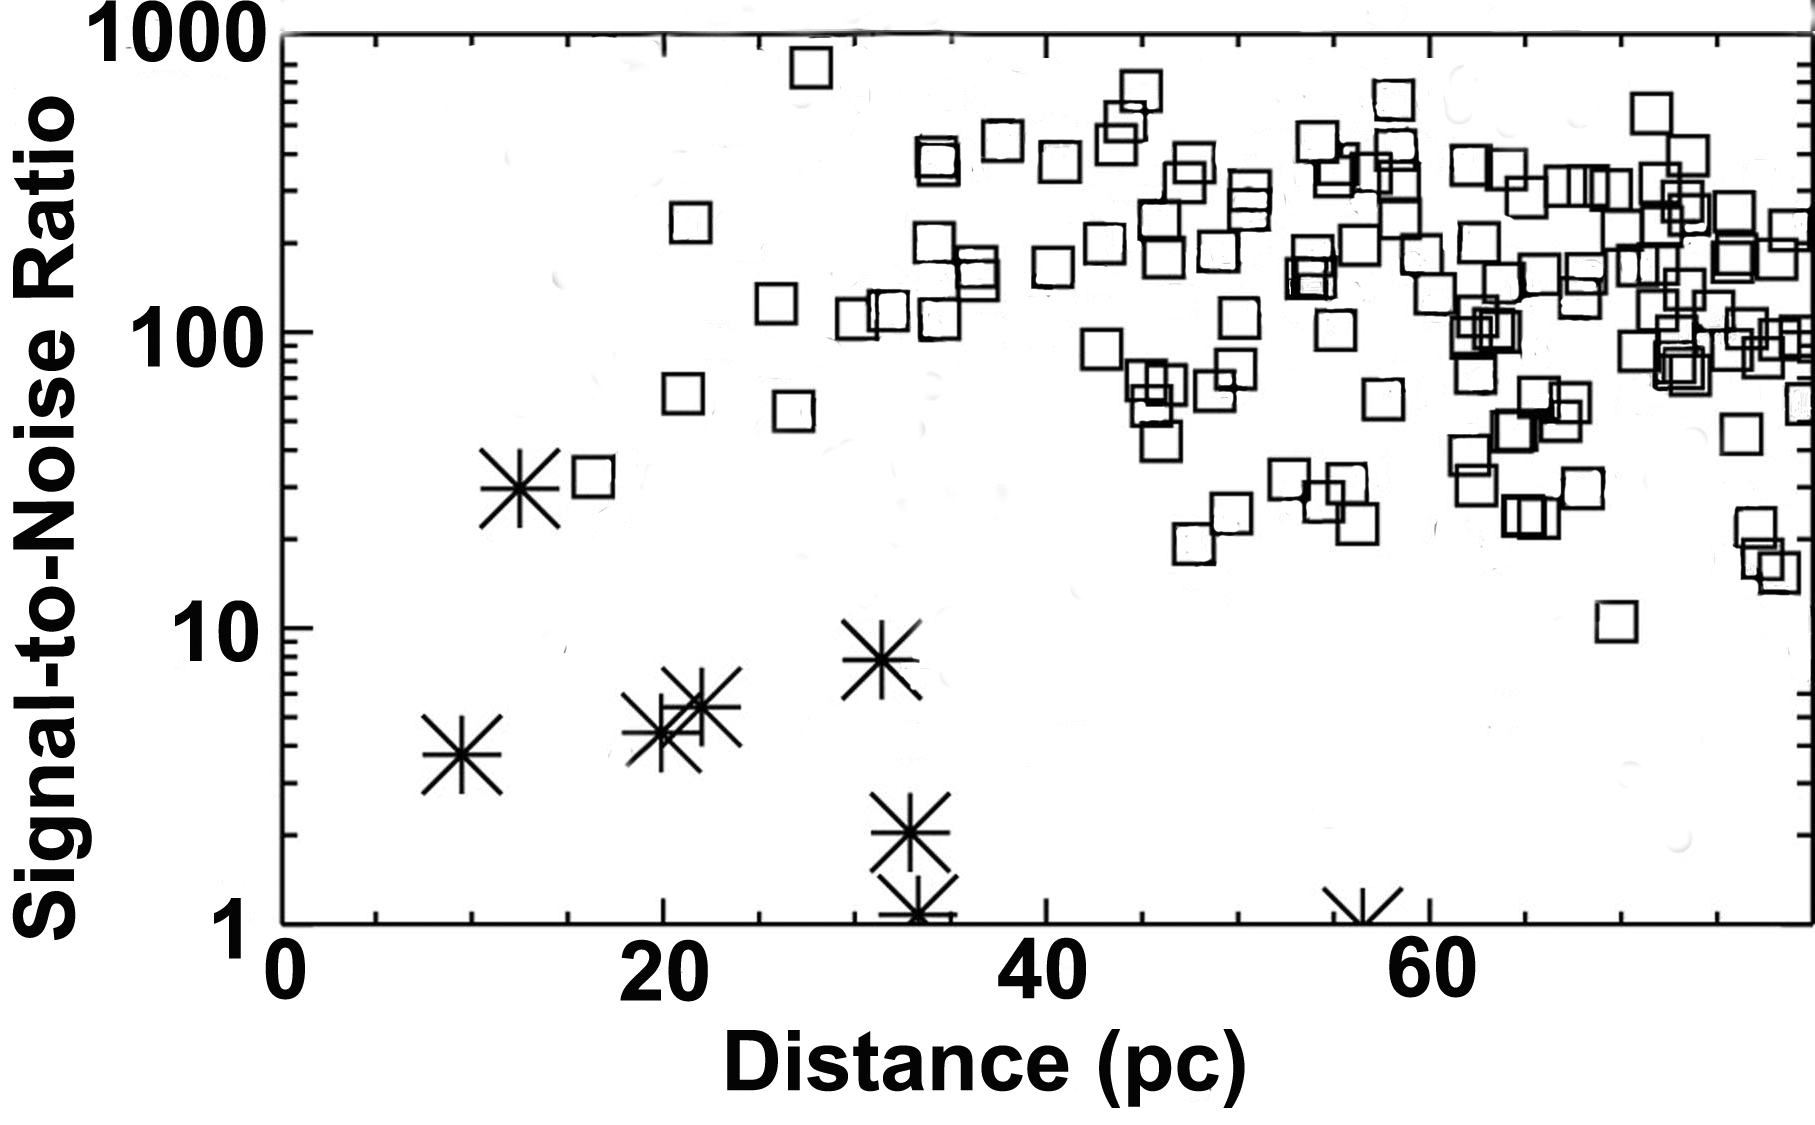
Figure 3 shows the spectrum of a model atmosphere of a super-Earth with deep absorption around 15 m due to CO2. The ratio of the signals in the two indicated filters is a sensitive measure of the depth of the 15 m absorption and hence of the CO2 content of the atmosphere of the planet; observations of secondary eclipses with the two filters would allow a sensitive search for CO2 absorption. The scheduled launch of the Transiting Exoplanet Survey Satellite (TESS) in 2017 will provide optimal targets for transit and eclipse observations over the JWST mission. Figure 4 shows that a number of the anticipated super-Earths might be searched for CO2 with a high priority program (the signal to noise ratios are calculated assuming all eclipses available during the JWST mission are observed).
In addition, the figure demonstrates that high signal-to-noise could be achieved on eclipses of many Neptune-sized planets, opening the possibility of obtaining spectra of them. Taking the example of GJ 436b (a hot Neptune measured in transit with Spitzer photometry (Stevenson et al., 2010)), ten transits would yield a LRS spectrum with a ratio of signal to noise of about 20 and a resolution of 100. Such a spectrum would allow detailed studies of the atmospheric composition, including molecular features such as those from H2O, NH3, and CH4. Such species dominate the molecular atmospheric opacity where giant planets have significant levels of thermal emission and hence are important in understanding their energy balance and emission. In general, the targets suitable for MIRI will also yield spectra with the JWST near infrared spectrometer (NIRSpec) that are sensitive to water and the CO2 band at 4.3 m (Deming et al., 2009). Monitoring planets around their orbits with these instruments will probe energy transport by their atmospheres as different regions of the planet are exposed and potentially, if the planet is on an elliptical orbit, as it experiences differing levels if heating. Thus, MIRI will enable detailed characterization of super-Earths and larger planets.
3.3 Early stages of star and planet formation
The embedded phase is a critical period in the evolution of a young star, when its final mass and the characteristics of any protoplanetary disk are determined. Many physical processes occur simultaneously in the first few yr: infall in the collapsing envelope, formation of the disk, outflows sweeping up and shocking the material, and UV photons heating and dissociating the gas, thereby affecting the next generation of protostars. Large scale surveys of Galactic star-forming clouds with Herschel and Spitzer have advanced our understanding enormously (Dunham et al. 2014), but studies of individual sources have been hampered by poor spatial and spectral resolution and sensitivity. MIRI’s integral field unit (IFU) spatial resolution down to 02 and field of view (FOV) of are well matched to the sizes of the young disks ( 100 AU) and envelopes ( 2000 AU).
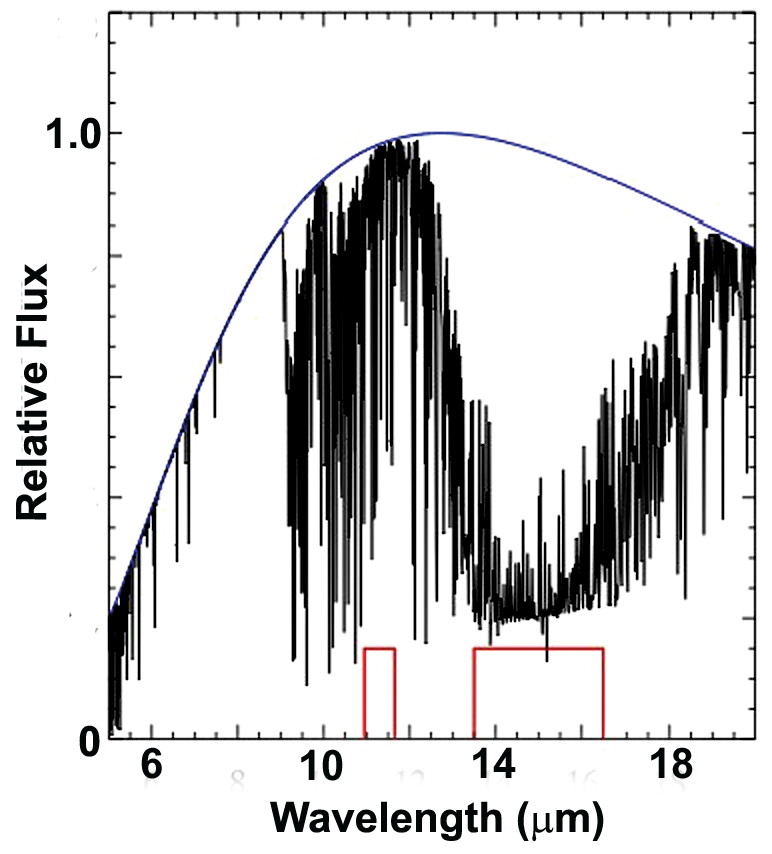
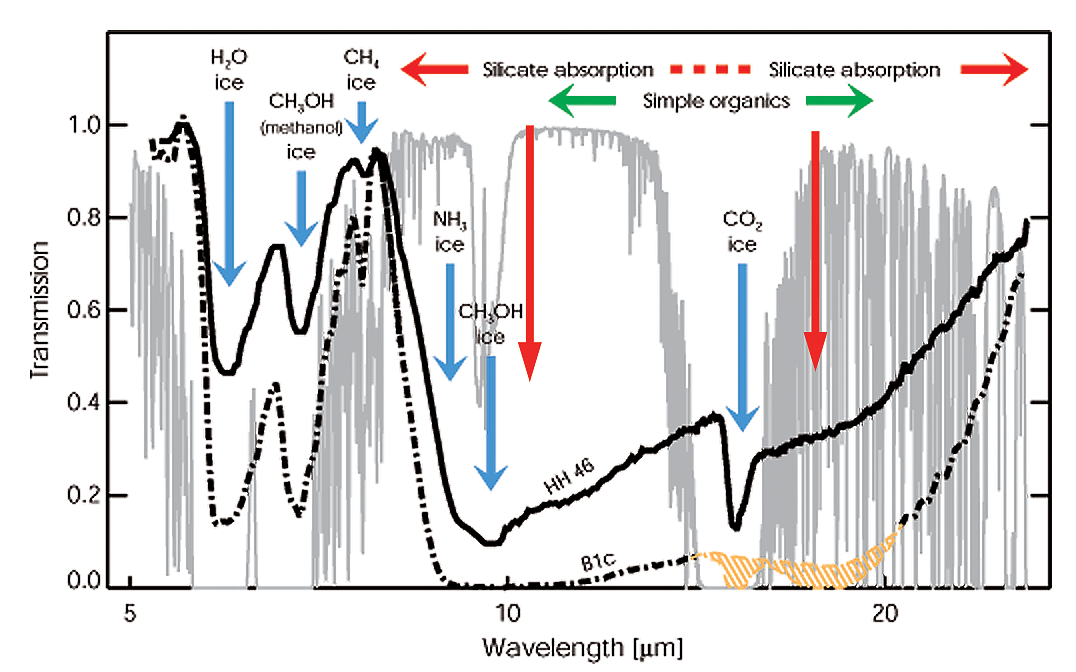
Figure 5 shows the Spitzer-IRS spectrum of a deeply embedded low-mass protostar (b1c) and a less-obscured object for comparison (HH 46). The mid-infrared continuum is generated by warm dust close to the protostar in the inner envelope or young disk. Silicate grain cores and ices in the cold surrounding envelope produce deep absorption features. There are a few windows (5–8 m, near 14 m and beyond 20 m) for looking deep into protostellar cores to characterize the physical structure of the warm component (Cernicharo et al. 2000). These interstellar windows give access to a rich set of spectral emission features that can trace chemical processes in the youngest protoplanetary disks, including astrobiologically important substances such as water and organic molecules. Ironically, much of the spectral range in these windows is blocked by the terrestiral atmosphere. MIRI will be able to probe the earliest, most deeply embedded stages of star formation, from very low-luminosity objects (, proto brown dwarfs) to the highest luminosity (), highly obscured protostellar sources.
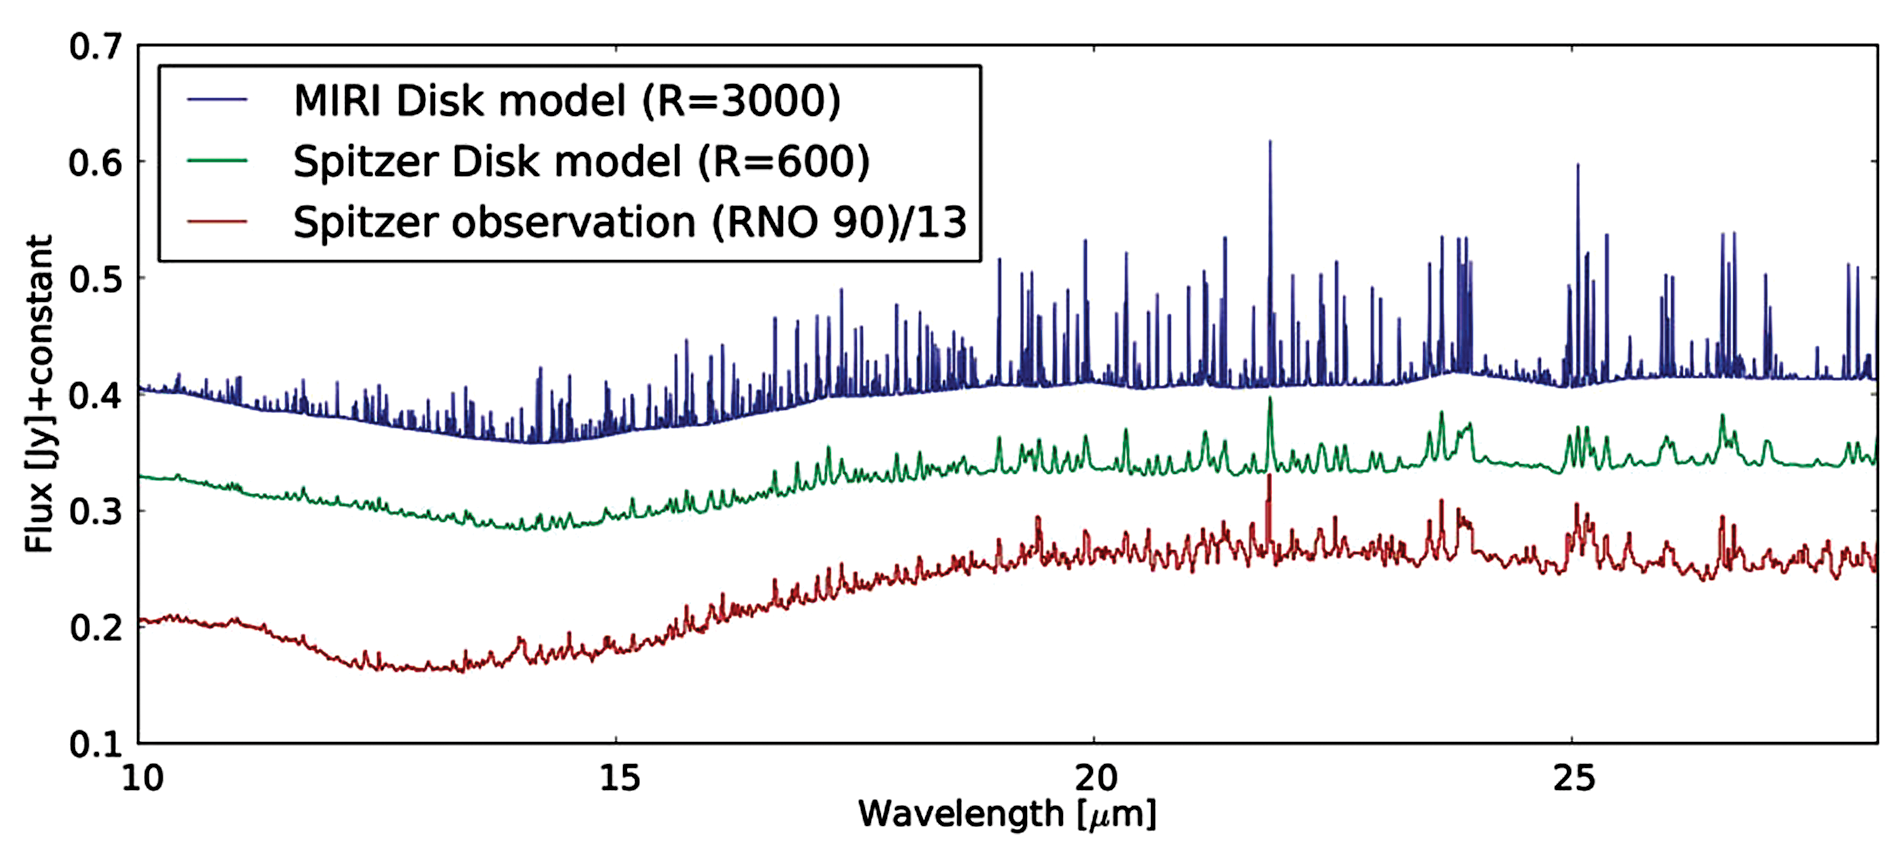
Figure 6 illustrates the richness of the molecular spectrum in a more evolved protoplanetary disk around a T Tauri star for which the envelope has dissipated (similar spectral richness is expected for embedded protostars). The high spectral resolution provided by MIRI will allow detailed study of the volatiles that dominate the condensable mass and it will support increased understanding of processes near snow lines during the period when volatile-rich planetesimals form in gas-rich protoplanetary disks. The pioneering spectroscopy of these regions with Spitzer (Carr & Najita 2008, Pontoppidan et al. 2010) has posed many questions that MIRI and JWST with their combination of high sensitivity and spectral resolution can answer: What are the abundances, temperatures, and distributions of the disk molecules, and how do they differ between substellar and higher mass young stars? Are the gas and dust distributions decoupled? The answers will give us a new perspective on the physical and chemical conditions in the giant-planet forming zones of disks.
In general, JWST/MIRI is unique for many studies of the environments where stars and planets form. The fundamental vibrational transitions of many organic molecules are in the mid-IR, for example CH4 (7.7 m), C2H2 (13.7 m), HCN (14.0 m), and CO2 (15.0 m). The first two have no dipole moment and therefore are not accessible through rotational transitions in the mm-wave. H2O has many transitions in the mid-IR, such as the bending mode at 6.0 m. Ices of these materials also absorb in broadened features near the fundamental transitions. The lowest transitions of H2 also occur within the MIRI spectral range, e.g., the J = 2 0 S(0) line of para-H2 at 28.22 m and the J = 3 1 (S(1) line of ortho-H2 at 17.03 m. Since the populations of these levels are usually thermalized, measurements of these two lines provide a direct measure of the mass and temperature of the bulk of molecular gas at temperatures between 50 and 200K. Atomic fine structure lines throughout the mid-IR (e.g., [Ne II] 12.8 m, [Ne III] 15.6 m, [Ar II] 7.0 m, [Ar III] 9.0 m, & [OIV] 25.91 m, also [FeII] 25.988 m) can probe the hardness of the radiation field, the gas density, metallicity, and the presence of shocks. This rich set of diagnostic lines can also explore the physics of the primeval jets and compare them with those from more evolved protostars. The high spatial resolution will let us identify source components, such as the outflow cavity walls, or internal disk shocks. The latter reflect the accretion history of the protostar and can test theories of episodic versus steady-state accretion (Dunham et al. 2014). These capabilities are complementary to those of ALMA (the Atacama Large Millimeter Array) for probing the gas in forming stars and planets: the two capabilities have similar angular resolution and together will probe the warm, inner, planet-forming region (MIRI) and cold outer parts (ALMA) of young stellar systems (van Dishoeck, 2004).
3.4 Galaxy assembly
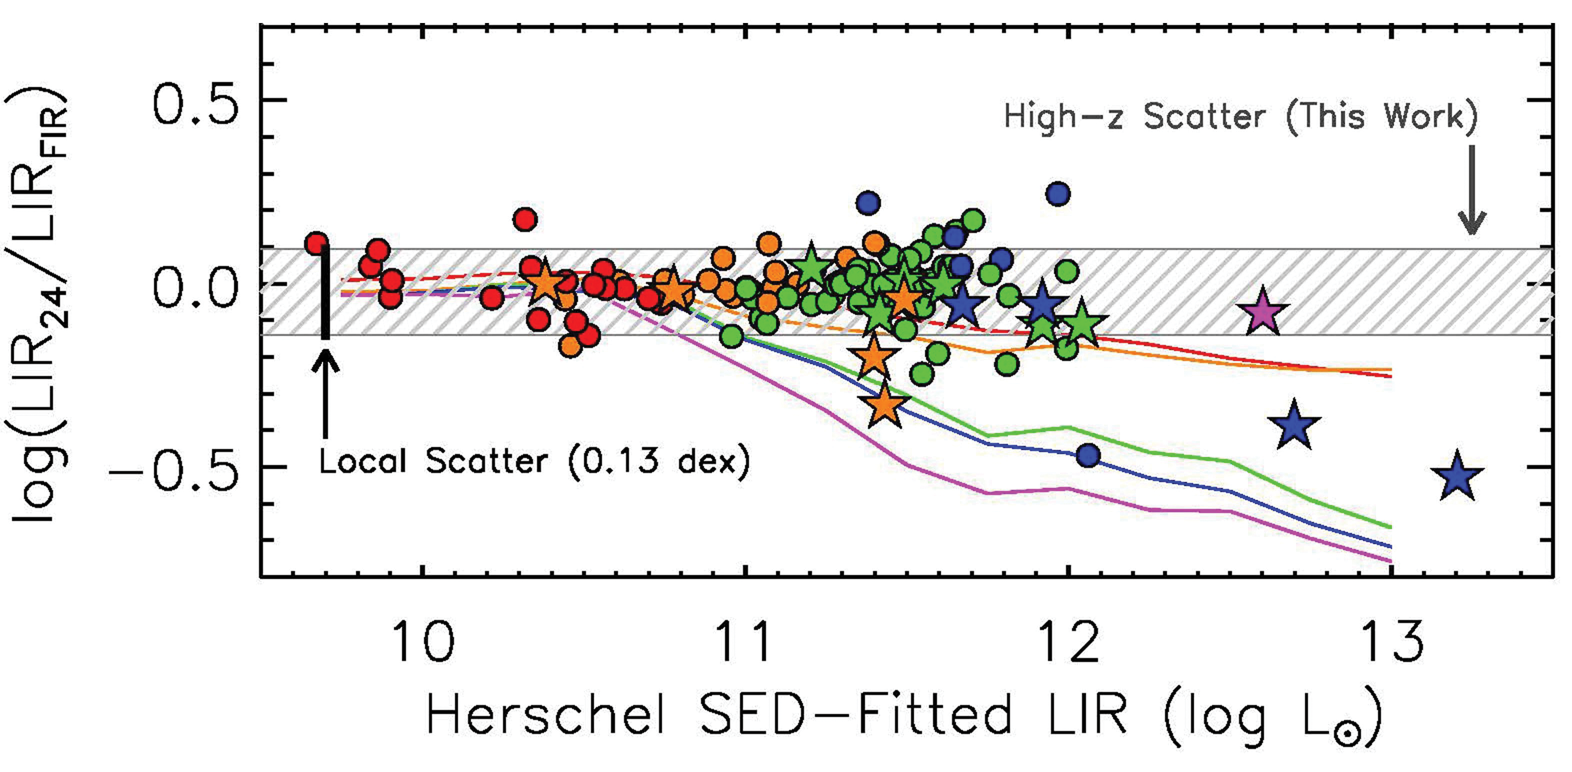
Even for well-observed local galaxies, it has proven difficult to measure star formation rates accurately because of the effects of absorption and scattering by interstellar dust (e.g., Calzetti et al. (2010)). Dust obscuration remains a significant obstacle to accurate measures of star formation to z of 2 and beyond (e.g., Reddy et al. (2010)), and the available data (Spitzer, Herschel) cannot survey deep enough to characterize it completely (see, e.g., Figure 4 in Elbaz et al. 2011). With careful calibration of the evolution of infrared spectral energy distributions, it has been found that photometry at 24 m can measure star formation rates accurately (typical errors of 0.13 dex) out to z 2.5 (Rujopakarn et al. (2013)), see Figure 7. Thus, deep MIRI surveys at 21 m will be able to measure dust-embedded star formation rates to z 2 and down to far infrared luminosities of 3 X 10¹⁰ L⊙. To complete our understanding of dust-embedded star formation at even higher redshift, z 2, accurate star formation rates in dusty galaxies will require ALMA observations.
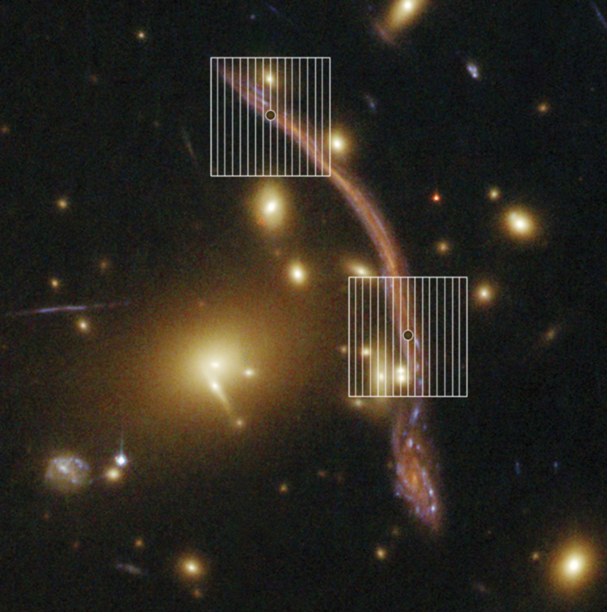
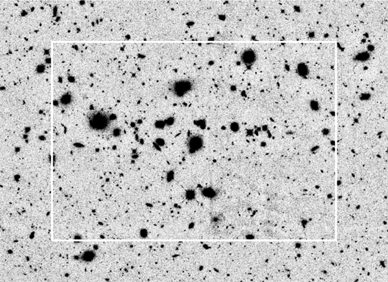
The reason that galaxies at z 1 and above have relatively similar infrared spectral energy distributions is that their star formation, even at very high luminosities, tends to be spread over a multi-kpc diameter region. High optical depths in the mid-infrared are therefore rare and seldom have a substantial effect on the mid-infrared output, allowing a standard template to produce accurate estimates of the star formation rates (Rujopakarn et al., 2013). This situation contrasts with local very luminous galaxies, where the star formation tends to be concentrated in regions well under a kpc in diameter centered on the galaxy nucleus. To probe the morphologies of distant vigorously star forming galaxies requires high resolution imaging in the mid-infrared. Fortunately, this goal can be achieved by inverting gravitationally lensed images as shown, for example, for the huge lensed arc in Abell 370 by Richard et al. (2009). In these cases, the resolution of MIRI will provide good reconstructed images and the MRS IFU will make observations efficient as shown in Figure 8.
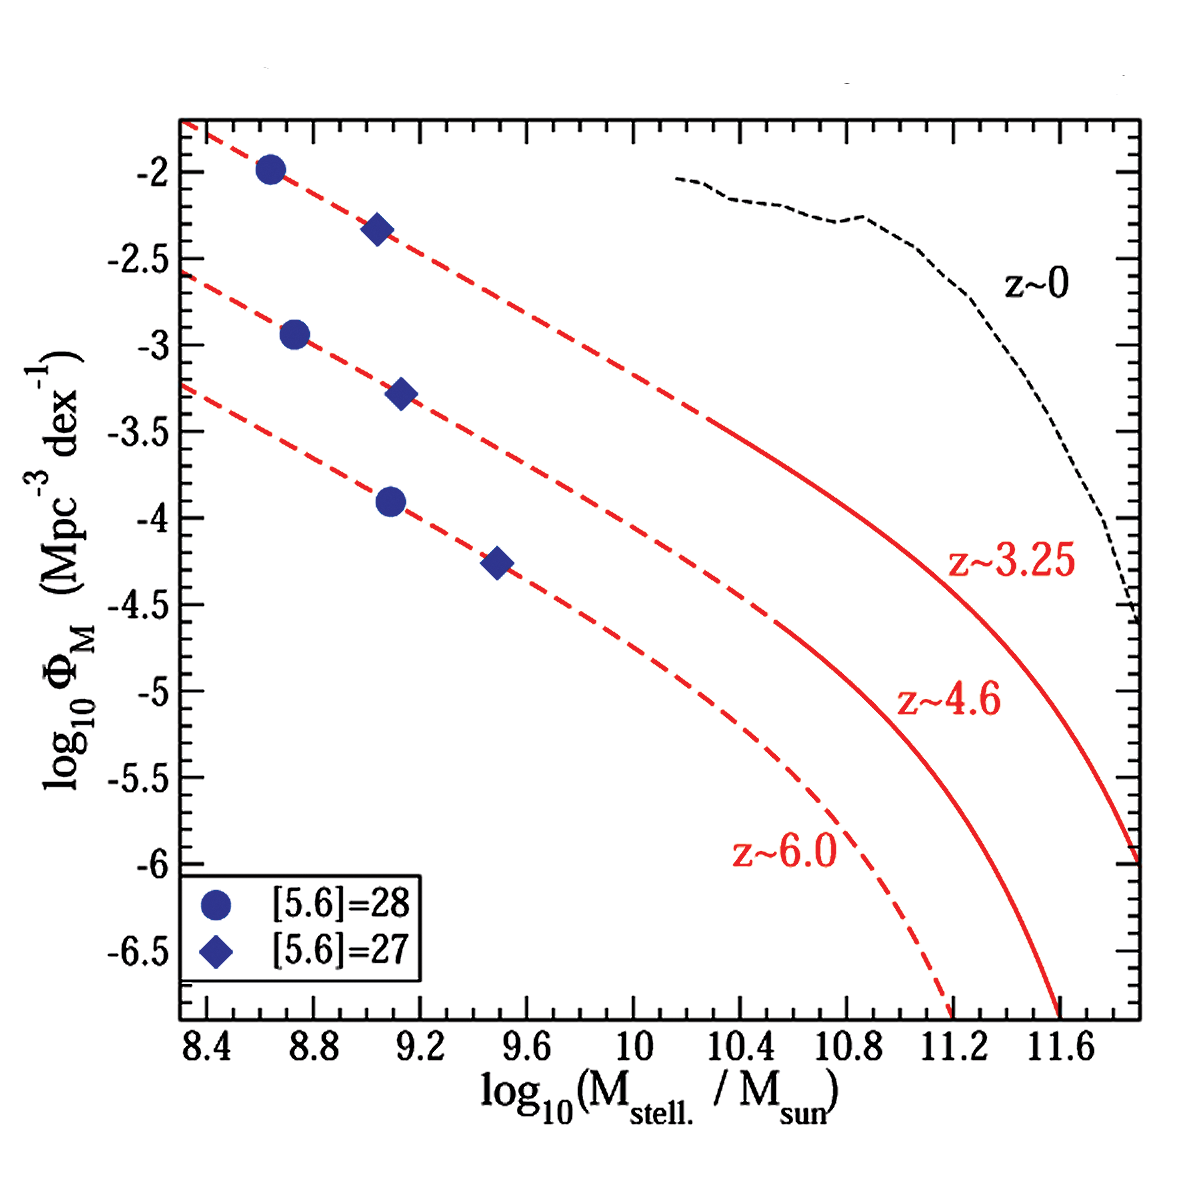
At higher redshifts, MIRI will make fundamental contributions to understanding the mass assembly of galaxies by achieving images of unprecedented depth and resolution matching the deepest images currently available in the near infrared (Figure 9). It is expected that the distribution of galaxy masses will be strongly skewed toward small masses by z 5, early in the process of galaxy assembly (Figure 10). Quantifying this behavior requires reliable determination of galaxy masses by measuring and modeling the stellar spectral energy distributions nearly out to their peak at a restframe wavelength of 1.6 m (rest). At z = 4, this peak has been shifted to 8 m, where Spitzer Infrared Array Camera (IRAC) data have been used to model galaxy masses. However, as shown in Figure 10, the sensitivity limitations (in large part due to confusion) have kept us from measuring masses down into the interesting range. The additional depth with MIRI (dashed lines in Figure 10) will probe galaxy mass assembly definitively.
3.5 The first galaxies
Finding the first galaxies was the original justification for JWST and remains its top priority. There are a number of recent theoretical studies of what this goal might entail (e.g., Pawlik et al. (2011, 2013); Zackrisson et al. (2011, 2012); Safranek-Shrader et al. (2012); Muratov et al. (2013)). These works predict a substantial range of possible properties (e.g., Zackrisson et al. (2011); Safranek-Shrader et al. (2012)), but generally agree that a “typical” first light galaxy will be of very low metallicity (by definition) and also of low mass and very faint, close to the detection limits with NIRCam (the JWST Near Infrared Camera). In such cases, JWST will be able to find candidates based on photometric redshifts, but characterizing the candidates (and even confirming that they are first light objects, i.e., with no metals and no prior history of star formation) will be challenging.
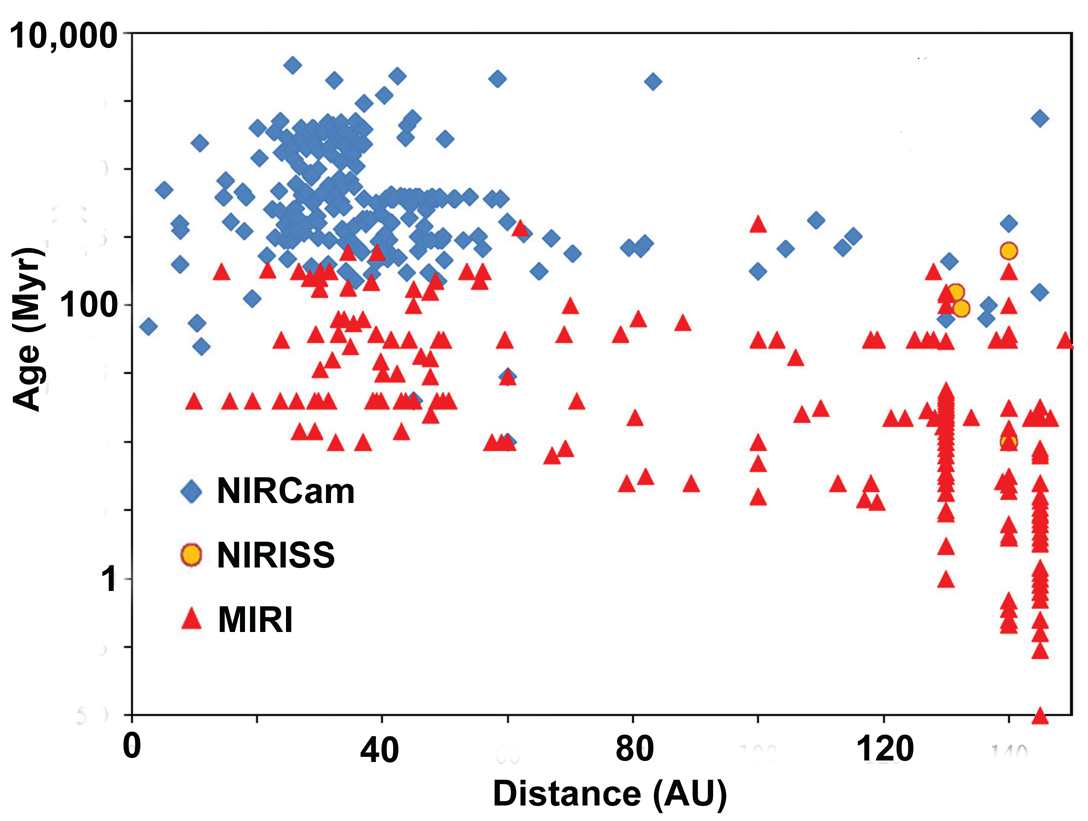
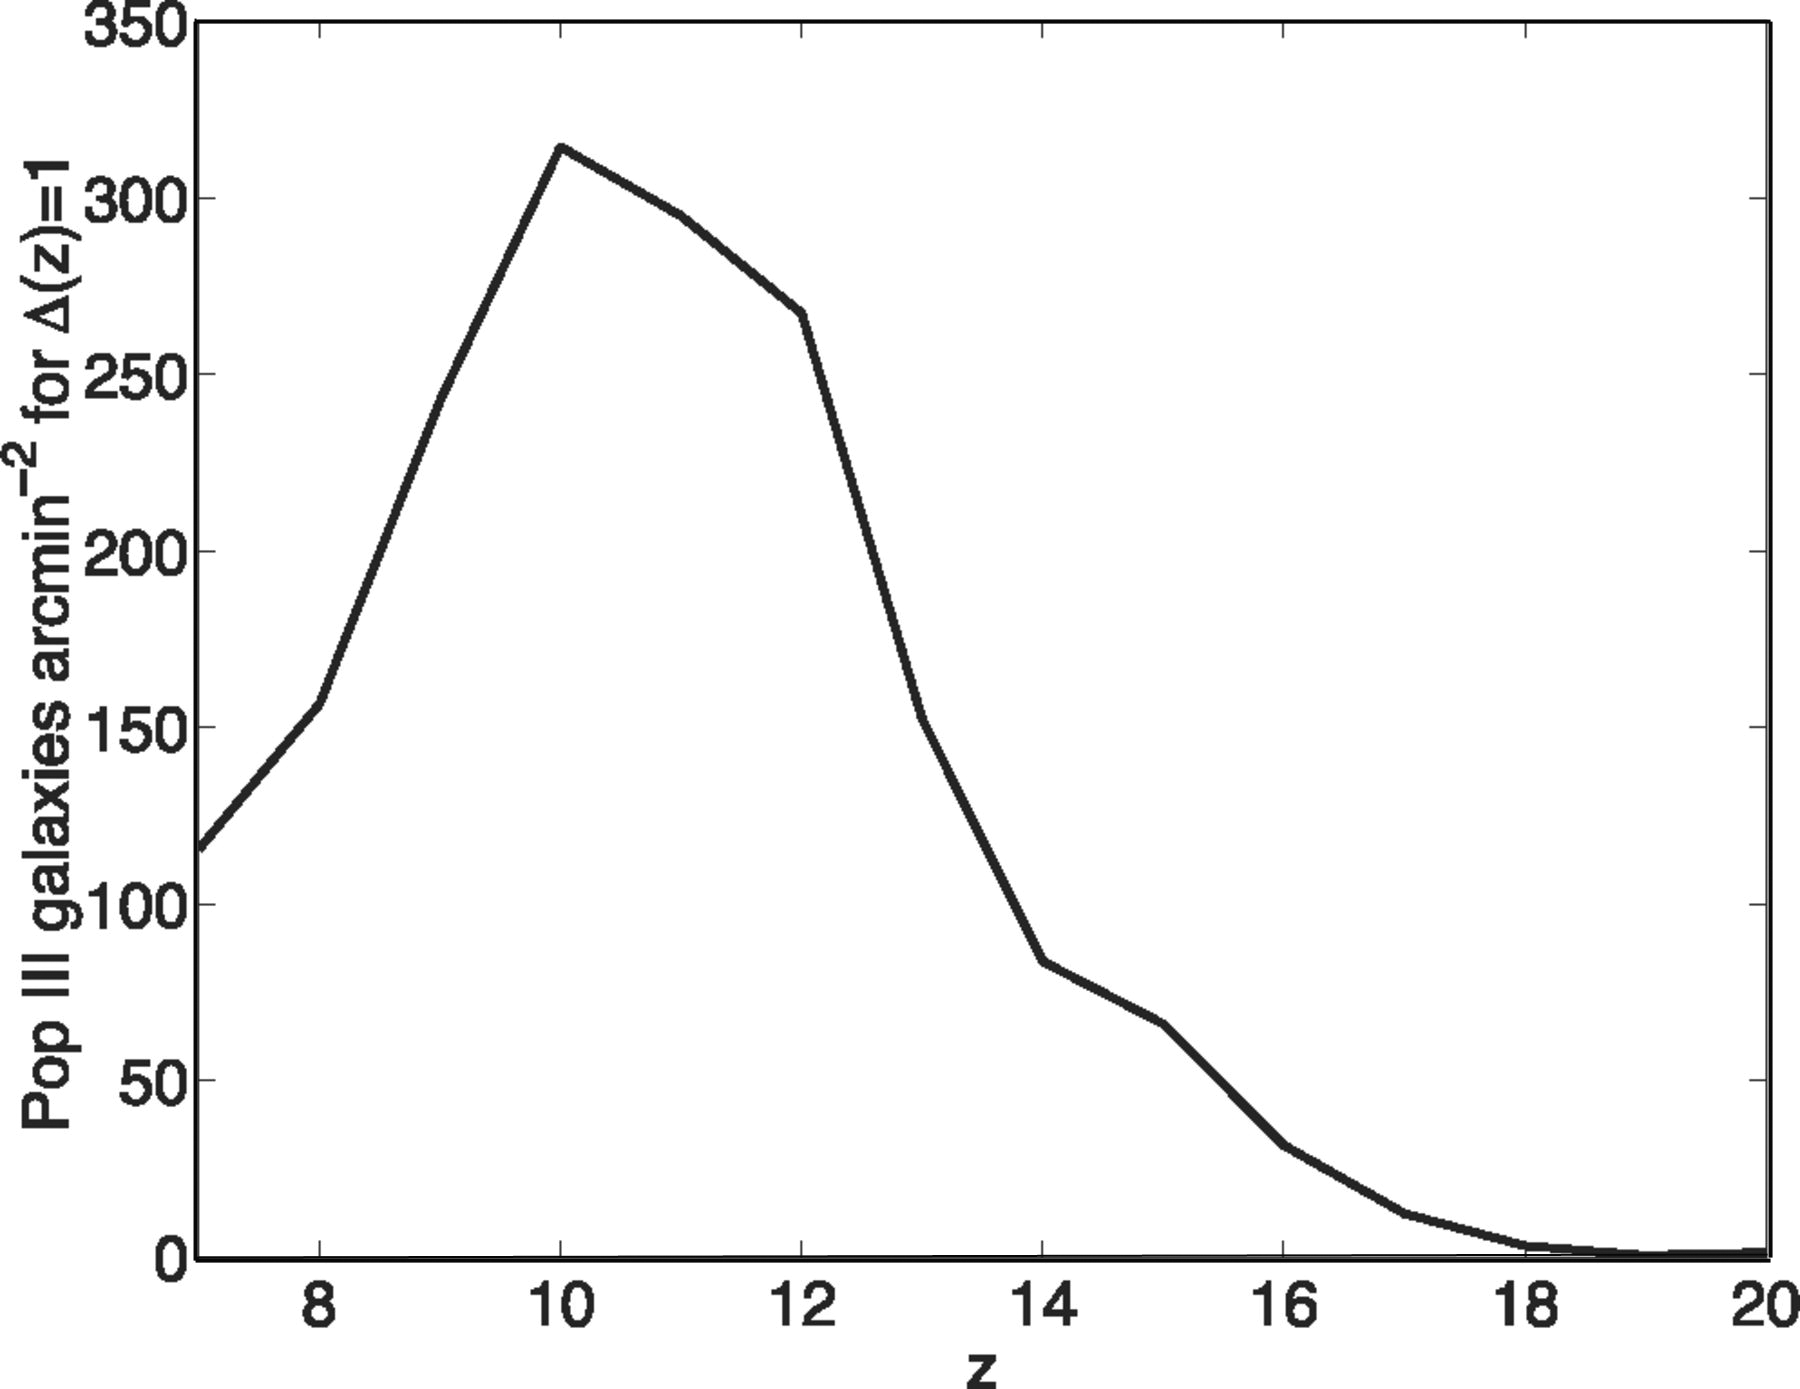
Therefore, systematic study of galaxies at these epochs will focus on the brighter examples. It is now predicted that Population III galaxies (i.e., with zero or only trace metallicity) may exist in significant numbers over a broad range of redshift (see Figure 11), down to z 7 (Zackrisson et al., 2012; Muratov et al., 2013). The luminosity distance is reduced by a factor of 1.8 (or 3.1) at this redshift compared with z = 10 (or 16), corresponding to increases in brightness by 3 (or 10). In addition, there will be a large range of halo masses, with a corresponding range of galaxy masses; studies will by necessity focus on these higher mass galaxies (Bromm & Yoshida, 2011). For example, Behroozi & Silk (2014) find that a single NIRCam survey field could have hundreds of galaxies between z = 9 and 10 and with mass 108 M⊙ (the upper limit to first-light galaxy masses in many theoretical studies (Bromm & Yoshida, 2011)). Oesch et al. (2014) report a significant number of candidates for galaxies at z 10 and M 109 M⊙. Such galaxies are where we will definitively test the “first light” hypothesis and use MIRI and the other JWST instruments to study key characteristics such as the history of star formation, the presence of active nuclei, and the buildup of metals.
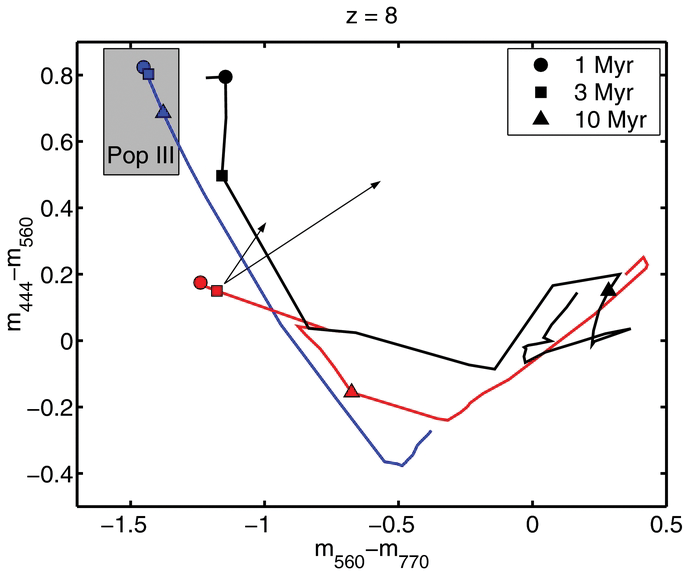
MIRI will play central roles in the first three of these four investigations. From Figure 12, MIRI colors (with NIRCam ones) can identify true Population III galaxies. MIRI detections of H (which moves into the MIRI spectral range for z 6.7) will give insights to the instantaneous star formation rates (Paardekooper et al., 2013). A 30-hour integration with the MIRI medium-resoutin spectrometer on a galaxy at z = 10 would measure (4-) the H from star formation at the rate of 8 M⊙/yr. Candidate objects at this redshift and star formation level are already being identified (Labbé et al., 2013; Holwerda et al., 2014). H line profiles will also be useful to find active galactic nuclei (AGNs). Very low metallicity galaxies have no strong emission lines between Lyman and the Balmer series (Groves et al., 2008); predictions of the strength of Ly are uncertain (e.g. Anders & Fritze v. Alvensleben, 2003; de Barros et al., 2014), with ndications that it may be very weak at z 7 (e.g., Jiang et al., 2013). Hence, H with MIRI may be the most readily detectable emission line for galaxies at z 10. At these redshifts, MIRI photometry will also be the best way to determine the strength of Balmer breaks and hence the longer term history of star formation.
4 Introduction to series of papers
This special issue of PASP contains a series of papers describing MIRI in full. The papers deal with each of the main science capabilities in turn, including imaging, prism spectroscopy, coronagraphy and integral field spectroscopy. Key to achieving the science goals is the understanding and optimisation of the performance of the three detector arrays in MIRI and of their control electronics.The operating characteristics of the detectors themselves and of their readouts and control electronics are therefore described separately. The paper on sensitivity then combines our understanding of the performance of the entire electro-optic detection chain with the expected observatory environment, into an estimation of the sensitivity that will be achieved in an observation using a single spacecraft pointing on-orbit. Finally, a snapshot of the still developing operating model and calibration pipeline for MIRI observing is presented, where the plans for calibrating, mapping and background subtraction are illustrated.
The specific papers are:
II: “Design and Build” (Wright et al., 2014) is an overall introduction to the instrument system and its thermal, mechanical, electronic and software interfaces with the JWST spacecraft. It also describes subsystems common to all the individual instrument capabilites (e.g., calibration sources).
III: “MIRIM, the MIRI imager” (Bouchet et al., 2014) gives an overview of the imaging module, which also supports the prism spectrometer and coronagraphic capabilities. It describes the overall optical design, and gives the details for the imaging band-defining filters. It also has an overview of the test campaign for the imager and its results.
IV: “The MIRI Low Resolution Spectrograph” (Kendrew et al., 2014) describes the double prism in the imager filter wheel that provides spectra with resolution of / 100, used either with a single slit (for spectra of very faint objects) or in a slitless mode (primarily envisioned for planetary transit measurements).
V: ”The Predicted Performance of the MIRI Coronagraphs,” (Boccaletti et al., 2014) describes another capability included in the MIRI imager. There are four coronagraphs, three based on quarter wave phase plates and one a classical Lyot design. The paper describes the principles of operation, the implementation in MIRI, and then models the expected performance in detail, taking account of the current best estimates for the telescope wavefront error and guiding accuracy.
VI: “The Medium-Resolution Spectrometer” (Wells et al., 2014) discusses the principles behind the optical design of the general purpose MIRI spectrometer, followed by a description of its construction and ground-test results. It concludes with a number of areas required for effective use of the instrument, such as correction for fringing in the detector arrays, generating calibration data, and corrections for stray light.
VII:“The MIRI Detectors” (Rieke et al., 2014) describes the general principles of operation of the Si:As IBC detectors in the instrument and their basic performance properties. It follows with more detailed theoretical analyses of : 1.) the trend of response with bias voltage; 2.) the detector/readout nonlinearity; 3.) latent images; and 4.) the cross-like image artifact in the 5 - 8 m spectral range.
VIII: “The MIRI Focal Plane System” (Ressler et al., 2014) shows how the detector array readout circuits work, how they are controlled, and how their signals are digitized and formatted. It discusses the options for subarrays. Finally, it includes a listing of the primary anomalies in the photometric performance of the detectors that need to be corrected in the data pipline.
IX: “Predicted Sensitivity” (Glasse et al., 2014) combines the test results on the flight instrument into our best projection of the signal to noise it will achieve on orbit.
X: “Operations and Data Reduction” (Gordon et al., 2014) shows how MIRI observations will be planned using Observation Templates, one template for each of the primary instrument modes (imaging, coronagraphy, low resolution spectroscopy, medium resolution spectroscopy). It then outlines the approach being developed for data reduction and closes with some samples of potential MIRI observations.
5 Acknowledgements
The work presented is the effort of the entire MIRI team and the enthusiasm within the MIRI partnership is a significant factor in its success. MIRI draws on the scientific and technical expertise of the following organisations: Ames Research Center, USA; Airbus Defence and Space, UK; CEA-Irfu, Saclay, France; Centre Spatial de Liége, Belgium; Consejo Superior de Investigaciones Científicas, Spain; Carl Zeiss Optronics, Germany; Chalmers University of Technology, Sweden; Danish Space Research Institute, Denmark; Dublin Institute for Advanced Studies, Ireland; European Space Agency, Netherlands; ETCA, Belgium; ETH Zurich, Switzerland; Goddard Space Flight Center, USA; Institute d’Astrophysique Spatiale, France; Instituto Nacional de Técnica Aeroespacial, Spain; Institute for Astronomy, Edinburgh, UK; Jet Propulsion Laboratory, USA; Laboratoire d’Astrophysique de Marseille (LAM), France; Leiden University, Netherlands; Lockheed Advanced Technology Center (USA); NOVA Opt-IR group at Dwingeloo, Netherlands; Northrop Grumman, USA; Max-Planck Institut fűr Astronomie (MPIA), Heidelberg, Germany; Laboratoire d’Etudes Spatiales et d’Instrumentation en Astrophysique (LESIA), France; Paul Scherrer Institut, Switzerland; Raytheon Vision Systems, USA; RUAG Aerospace, Switzerland; Rutherford Appleton Laboratory (RAL Space), UK; Space Telescope Science Institute, USA; Toegepast-Natuurwetenschappelijk Onderzoek (TNO-TPD), Netherlands; UK Astronomy Technology Centre, UK; University College London, UK; University of Amsterdam, Netherlands; University of Arizona, USA; University of Bern, Switzerland; University of Cardiff, UK; University of Cologne, Germany; University of Ghent; University of Groningen, Netherlands; University of Leicester, UK; University of Leuven, Belgium; University of Stockholm, Sweden; Utah State University, USA. A portion of this work was carried out at the Jet Propulsion Laboratory, California Institute of Technology, under a contract with the National Aeronautics and Space Administration.
We would like to thank the following National and International Funding Agencies for their support of the MIRI development: NASA; ESA; Belgian Science Policy Office; Centre Nationale D’Etudes Spatiales (CNES); Danish National Space Centre; Deutsches Zentrum fur Luft-und Raumfahrt (DLR); Enterprise Ireland; Ministerio De Economiá y Competividad; Netherlands Research School for Astronomy (NOVA); Netherlands Organisation for Scientific Research (NWO); Science and Technology Facilities Council; Swiss Space Office; Swedish National Space Board; UK Space Agency.
We take this opportunity to thank the ESA JWST Project team and the NASA Goddard ISIM team for their capable technical support in the development of MIRI, its delivery and successful integration.
We would like to thank Peter Jakobsen for his leadership of the European interests in JWST as the partnership in the JWST project was established, and in particular for his strong support of MIRI over many years. We also thank Fred Lahuis and Klaus Pontippidan for help with Figures 5 and 6, respectively. We also thank Lisa May Walker for a critical reading of a draft of the paper.
References
- Anders & Fritze v. Alvensleben (2003) Anders, P., & Fritze v. Alvensleben, U. 2003, A&A, 401, 1063
- Bailey et al. (2014) Bailey, Vanessa et al. 2014, ApJL, 780, 4
- Baraffe et al. (2003) Baraffe, I., Chabrier, G., Barman, T. S., Allard, F., Hauschildt, P. H. 2003, A&A, 402, 701
- Behroozi & Silk (2014) Behroozi, P. S., & Silk, J. 2014, astroph 1404.5299v1
- Beichman et al. (2010) Beichman, C. A. et al. 2010,PASP, 122, 162
- Boccaletti et al. (2014) Boccaletti, A. et al. 2014, PASP, this volume: Paper V
- Boogert et al. (2008) Boogert, A. C. A., et al. 2008, ApJ, 678, 985
- Bouchet et al. (2014) Bouchet, P. et al. 2014, PASP, this volume: Paper III
- Bromm & Yoshida (2011) Bromm, V., & Yoshida, N. 2011, ARAA, 49, 373
- Caldwell et al. (2004) Caldwell, M. E. et al. 2004, SPIE, 5497, 51
- Calzetti et al. (2010) Calzetti, D. et al. 2010, ApJ, 714, 1256
- Caputi (2011) Caputi, K. 2011, in ”Frontier Science Opportunities with the JWST”, STScI
- Carr & Najita (2008) Carr, J. S., & Najita, J. 2008, Science, 319, 1504
- Cernicharo et al. (2000) Cernicharo, J. et al., 2000, Science, 534, 199
- Choi & Nagamine (2010) Choi, J.-H. & Nagamine, K. 2011, MNRAS, 407, 1464
- Dalton et al. (2006) Dalton, G. B. et al. 2006, SPIE, 6269, 30
- de Barros et al. (2014) de Barros, S., Schaerer, D., & Stark, D. P. 2014, A&A, 563, 81
- Deming et al. (2009) Deming, D. et al. 2009, PASP, 121, 952
- Dressler et al. (1996) Dressler, A. R. et al. 1996, ”HST and Beyond,” Association of Universities for Research in Astronomy: Washington, D. C.
- Dunham et al. (2014) Dunham, M. M. et al. 2014, ”The evolution of protostars: Insights from ten years of infrared surveys with Spitzer and Herschel”, in Protostars and Planets VI, University of Arizona Press, Tucson, AZ, USA
- Elbaz et al. (2011) Elbaz, D. et al. 2011, A&A, 533, 119
- Fortney et al. (2013) Fortney, J. J., Mordasini, C., Nettelmann, N., Kempton, E. M.-R., Greene, T. P., & Zahnle, K. 2013, ApJ, 775, 80
- Gardner et al. (2006) Gardner, J. P. et al. 2006, Sp. Sci. Rev., 123, 485
- Glasse et al. (2014) Glasse, A. C. et al. 2014, PASP, this volume: Paper IX
- Gordon et al. (2014) Gordon, K. D. 2014, PASP, this volume: Paper X
- Groves et al. (2008) Groves, Brent, et al. 2008, ApJS, 176, 438
- Holwerda et al. (2014) Holwerda, B. W., Bouwens, R., Oesch, P., Smit, Renske, Illingworth, G., & Labbé, I. 2014, Astroph/1406.1180
- Jiang et al. (2013) Jiang, L., Bian, F., Fan, X. et al. 2013, ApJL, 771, 6
- Kalas et al. (2008) Kalas, P. et al. 2008, Science, 322, 1345
- Kataza et al. (2000) Kataza, H. et al. 2000, SPIE, 4008, 1144
- Kendrew et al. (2014) Kendrew, S. et al. 2014, PASP, this volume: Paper IV
- Koekemoer et al. (2011) Koekemoer, A. M. et al. 2011, ApJS, 197, 36
- Labbé et al. (2013) Labbé, I. et al. 2013, ApJL, 777, 19
- Lagage et al. (2000) Lagage, P.-O., Durand, G. A., Lyraud, C., Rio, Y., Pel, J.-W., & de Haas, J. C. 2000, SPIE, 4008, 1120
- Lagrange et al. (2010) Lagrange, A.-M. et al. 2010, Science, 329, 57
- Low et al. (2007) Low, F. J., Rieke, G. H., & Gehrz, R. D. 2007, ARAA, 45, 43
- Marois et al. (2008) Marois, C. et al. 2008, Science, 322, 1348
- Miller-Ricci et al. (2009) Miller-Ricci, E., Seager, S., & Sasselov, D. 2009, ApJ, 690, 1056
- Muratov et al. (2013) Muratov, A. L., Gnedin, O. Y., Gnedin, N. Y., & Zemp, M. 2013, ApJ, 773, 19
- Oesch et al. (2014) Oesch, P. A. et al. 2014, Astroph 1309.2280v2
- Paardekooper et al. (2013) Paardekooper, S.-J., Khockfar, S., & Dalla Vecchia, C. 2013, MNRAS, 429L, 94
- Pawlik et al. (2011) Pawlik, A. H., Milosavljevic, M., & Bromm, V. 2011, ApJ, 731, 54
- Pawlik et al. (2013) Pawlik, A. H., Milosavljevic, M., & Bromm, V. 2013, ApJ, 767, 59
- Pontoppidan et al. (2010) Pontoppidan, K. M., Salyk, C., Blake, G. A., Meijerink, R., Carr, J. S., & Najita, J. 2010, ApJ, 720, 887
- Reddy et al. (2010) Reddy, N. A., Erb, D. K., Pettini, M., Steidel, C. C. & Shapley, A. E. 2010, ApJ, 712, 1070
- Ressler et al. (2014) Ressler, M. E. et al. 2014, PASP, this volume; Paper VIII
- Richard et al. (2009) Richard, J., Kneib, J. - P., Limousin, M., Edge, A., & Jullo, E. 2009, MNRAS, 402, L44
- Rieke et al. (2014) Rieke, G. H. et al. 2014, PASP, this volume: Paper VII
- Rujopakarn et al. (2013) Rujopakarn, W., Rieke, G. H., Weiner, B. J., Perez-Gonzalez, P. G., Rex, M., Walth, G. L., & Kartaltepe, J. S. 2013, ApJ, 767, 73
- Safranek-Shrader et al. (2012) Safranek-Shrader, C., Agarwal, M., Federrath, C., Dubey, A., Milosavlyevic, M., & Bromm, V. 2012, MNRAS, 426, 1159
- Stevenson et al. (2010) Stevenson, K. B., et al. 2010, Nature, 464, 1161
- Trenti et al. (2009) Trenti, M, Stiavelli, M., & Shull, J M. 2009, ApJ, 700, 1672
- van Dishoeck (2004) van Dishoeck, E. G. 2004, ARAA, 42, 119
- Wells et al. (2014) Wells, M. et al. 2014, PASP, this volume:Paper VI
- Whitney (2014) Whitney, B. 2014, http://caravan.astro.wisc.edu/protostars/
- Wright et al. (2014) Wright, G. S. et al. 2014, PASP, this volume: Paper II
- Zackrisson et al. (2011) Zackrisson, E., Rydberg, C. - E., Schaerer, D., Ostlin, G., & Tuli, M. 2011, ApJ, 740, 13
- Zackrisson et al. (2012) Zackrisson, E., et al. 2012, MNRAS, 427, 2212
| name | FOV | Wavelength | Spectral Properties | Reference |
|---|---|---|---|---|
| Range (m) | (this volume) | |||
| Diffraction-limited Imaging | 5.6 - 25.5 | 9 bands | Paper III | |
| Low Res. Spectroscopy | 051 47 slit | 5 - 12 | Paper IV | |
| Slitless Spectroscopy | 79 wide | 5 - 12 | Papers IV & VIII | |
| Phase Mask Coronagraphy | 24′′ 24′′ | 10.65 - 15.5 | 3 bands | Paper V |
| Lyot Coronagraphy | 30′′ 30′′ | 23 | one band | Paper V |
| Medium Res. Spectroscopy | 344 364 IFUa | 4.9 - 28.8 | 1500 - 3500 | Paper VI |
| name | FOVa | / | 10- in | /D | |
|---|---|---|---|---|---|
| (arcsec) | (m) | 10,000sd | (arcsec) | ||
| F560W | 74 113 | 5.6 | 5 | 0.17 Jy | 0.19 |
| F770W | 74 113 | 7.7 | 3.5 | 0.27 Jy | 0.26 |
| F1000W | 74 113 | 10 | 5 | 0.60 Jy | 0.34 |
| F1130W | 74 113 | 11.3 | 16 | 1.48 Jy | 0.39 |
| F1280W | 74 113 | 12.8 | 5 | 0.94 - 1.05 Jy | 0.44 |
| F1500W | 74 113 | 15 | 5 | 1.5 - 2.0 Jy | 0.52 |
| F1800W | 74 113 | 18 | 6 | 3.7 - 5.3 Jy | 0.62 |
| F2100W | 74 113 | 21 | 4 | 7.5 - 10.5 Jy | 0.72 |
| F2550W | 74 113 | 25.5 | 6 | 27 - 36 Jy | 0.88 |
| F1065Cb | 24 24 | 10.65 | 20 | 0.37 | |
| F1140Cb | 24 24 | 11.40 | 20 | 0.39 | |
| F1550Cb | 24 24 | 15.5 | 20 | 0.53 | |
| F2300Cc | 30 30 | 23 | 5 | 0.79 |
| name | FOV | sub-band | range | |
|---|---|---|---|---|
| slice width, pixel size | (m) | |||
| (arcsec) | ||||
| LRS | 0.51 4.7 | 5 - 14 | 100a | |
| —–, 0.11 | ||||
| MRS | A | 4.87 - 5.82 | ||
| Channel 1 | 3.0 3.9 | B | 5.62 - 6.73 | 2450 - 3710 |
| 0.176, 0.196 | C | 6.49 - 7.76 | ||
| MRS | A | 7.45 - 8.90 | ||
| Channel 2 | 3.5 4.4 | B | 8.61 - 10.28 | 2480 - 3690 |
| 0.277, 0.196 | C | 9.94 - 11.87 | ||
| MRS | A | 11.47 - 13.67 | ||
| Channel 3 | 5.2 6.2 | B | 13.25 - 15.80 | 2510 - 3730 |
| 0.387, 0.245 | C | 15.30 - 18.24 | ||
| MRS | A | 17.54 - 21.10 | ||
| Channel 4 | 6.7 7.7 | B | 20.44 - 24.72 | 2070 - 2490 |
| 0.645, 0.273 | C | 23.84 - 28.82 |