Supernova 1987A: a Template to Link Supernovae to their Remnants
Abstract
The emission of supernova remnants reflects the properties of both the progenitor supernovae and the surrounding environment. The complex morphology of the remnants, however, hampers the disentanglement of the two contributions. Here we aim at identifying the imprint of SN 1987A on the X-ray emission of its remnant and at constraining the structure of the environment surrounding the supernova. We performed high-resolution hydrodynamic simulations describing SN 1987A soon after the core-collapse and the following three-dimensional expansion of its remnant between days 1 and 15000 after the supernova. We demonstrated that the physical model reproducing the main observables of SN 1987A during the first 250 days of evolution reproduces also the X-ray emission of the subsequent expanding remnant, thus bridging the gap between supernovae and supernova remnants. By comparing model results with observations, we constrained the explosion energy in the range erg and the envelope mass in the range . We found that the shape of X-ray lightcurves and spectra at early epochs ( years) reflects the structure of outer ejecta: our model reproduces the observations if the outermost ejecta have a post-explosion radial profile of density approximated by a power law with index . At later epochs, the shapes of X-ray lightcurves and spectra reflect the density structure of the nebula around SN 1987A. This enabled us to ascertain the origin of the multi-thermal X-ray emission, to disentangle the imprint of the supernova on the remnant emission from the effects of the remnant interaction with the environment, and to constrain the pre-supernova structure of the nebula.
Subject headings:
hydrodynamics — instabilities — shock waves — ISM: supernova remnants — X-rays: ISM — supernovae: individual (SN 1987A)1. Introduction
Supernova remnants (SNRs), the leftovers of supernova (SN) explosions, are diffuse extended sources with a quite complex morphology. General consensus is that such morphology reflects, on one hand, the physical and chemical properties of the progenitor SN and, on the other hand, the early interaction of the SN blast wave with the inhomogeneous circumstellar medium (CSM). Thus investigating the intimate link that exists between the morphological properties of a SNR and the complex phases in the SN explosion may help: 1) to trace back the structure and chemical composition of SN ejecta, and the dynamics and energetics of the SN explosion; 2) to probe the structure and geometry of the CSM, thereby mapping the final stages of the stars evolution. However, the very different time and space scales of SNe and SNRs make difficult to study in detail their connection (e.g. Badenes et al. 2008; Ellinger et al. 2012; Yamaguchi et al. 2014; Patnaude et al. 2015).
Because of its youth and proximity, SN 1987A in the Large Magellanic Cloud offers a unique opportunity to bridge the gap between the progenitor SN and its remnant. SN 1987A was an hydrogen-rich core-collapse (CC) SN that was observed in outburst on February 23, 1987 (West et al. 1987). It occurred approximately 51.4 kpc from Earth (Panagia 1999). About 80 days after the explosion, it reached a peak apparent visual magnitude of (naked eye visible; e.g. Catchpole et al. 1988; Hamuy et al. 1988). Its evolution has been accurately monitored in different wavelength bands since the outburst, from infrared (e.g. with Spitzer, Dwek et al. 2010), to optical (e.g. with Hubble Space Telescope, Lawrence et al. 2000; Larsson et al. 2011), to X-ray bands (e.g. with Rosat, Haberl et al. 2006, Chandra, Helder et al. 2013, and XMM-Newton, Haberl et al. 2006). This has provided a wealth of high-quality data with unprecedented completeness, making of SN 1987A an ideal template to study the SN-SNR connection.
The study, however, is complicated by the interaction of the blast wave with the surrounding inhomogeneous medium. Optical images soon after the outburst revealed an enigmatic triple-ring nebula around the SN (Crotts et al. 1989). The nebula consists mainly of a dense central equatorial ring and two outer rings displaced by about 0.4 pc above and below the central ring and lying in planes almost parallel to the equatorial one. It has been suggested that the nebula might be the result either of the merging of two massive stars occurred some 20,000 years before the explosion (Morris & Podsiadlowski 2007) or of mass loss from a fast-rotating star (Chita et al. 2008).
The interaction of the SN with the nebula is best observed in the radio and X-ray bands. It started about 3 years after the explosion when both radio and X-ray fluxes began to increase with time (Hasinger et al. 1996; Gaensler et al. 1997). This was interpreted as due to outer ejecta lighting up the dense wind emitted during a previous red supergiant (RSG) phase and subsequently swept-up by the fast wind during a phase of blue supergiant (BSG) (Chevalier & Dwarkadas 1995). After about 16 years, suddenly the soft X-ray lightcurve has steepened still further, contrary to the hard X-ray and radio lightcurves (Park et al. 2005). This was interpreted as due to the blast wave sweeping up the dense central equatorial ring (McCray 2007). Since then the soft X-ray flux continued to grow, indicating that currently the shock is still traveling through the dense part of the equatorial ring (Helder et al. 2013).
X-ray observations more than others encode information about the physical properties of both the nebula and the stellar ejecta. Decoding these observations, therefore, might open the possibility to reconstruct the nebula and ejecta structures soon after the SN explosion. This requires accurate and detailed numerical models able to follow the ejecta evolution from the SN explosion to the SNR phase and to reproduce altogheter the emission properties of both the progenitor SN and its remnant.
Current models, however, were usually aimed at describing either the SN evolution (e.g. Pumo & Zampieri 2011; Handy et al. 2014) or the expansion of the remnant (e.g. Zhekov et al. 2009; Dewey et al. 2012; Potter et al. 2014). The former models describe the early SN evolution and ignore its subsequent interaction with the nebula; the latter assume an initial parametrized ejecta profile that is not proven to reproduce the main observables of the progenitor SN, leaving out an accurate description of the ejecta distribution of mass and energy soon after the SN explosion. These limits make difficult to disentangle the effects of the initial conditions (i.e. the SN event) from those of the boundary conditions (i.e. the interaction with the environment). A first attempt to connect some properties of CC-SN (e.g. the composition and a parameterization of the circumstellar environment) to some observable bulk properties of SNR has been discussed recently (Patnaude et al. 2015), even though by adopting a 1D approach.
The structure of the pre-SN nebula of SN 1987A is inherently three-dimensional (3D), as is visible in the images from the Hubble Space Telescope (HST) (e.g. Larsson et al. 2011). A proper description of the interaction of the ejecta with the nebula therefore requires 3D calculations. To date only a 3D model has been proposed (Potter et al. 2014) to explore the origin of the asymmetric radio morphology observed in SN 1987A. However this model focusses on the analysis of the radio emission and its initial condition is a parametrized function describing the ejecta distribution about two years after the explosion. As a consequence their model cannot describe the evolution of the SN and their adopted distribution of ejecta is not proven to be consistent with the observables of the SN.
Here we present a hydrodynamic model describing the evolution of SN 1987A from the breakout of the shock wave at the stellar surface until the expansion of its remnant through the nebula surrounding the SN. We ran several high-resolution simulations to reproduce altogether the main observables of the SN (i.e. bolometric lightcurve, evolution of line velocities, and continuum temperature at the photosphere) and the properties of X-ray emission of the remnant (lightcurves, spectra, and morphology). Our simulations cover the first 40 years of evolution to make predictions on the future evolution of the remnant in view of the spatially-resolved high-resolution spectroscopy capability of the forthcoming X-ray observatory Athena (Nandra et al. 2013). The paper is organized as follows. In Section 2 we describe the hydrodynamic model and the numerical setup, in Section 3 we describe the results and, finally, we draw our conclusions in Section 4.
2. Problem description and numerical setup
We first modeled the SN by performing one-dimensional (1D) simulations of the “early” post-explosion evolution of a CC-SN during the first 250 days (see Section 2.1). Then the output of these simulations was mapped into 3D and provided the initial condition for the ejecta structure of a 3D model describing the further evolution of the SN and the subsequent development of the SNR interacting with the CSM (see Section 2.2).
2.1. Modeling the post-explosion evolution of the supernova
The post-explosion evolution of the SN was modeled by using a 1D Lagrangian code, specifically tailored to simulate the main observables in CC-SNe (namely the bolometric lightcurve and the time evolution of the photospheric velocity and temperature; Pumo & Zampieri 2011) and widely used to model observed events (Spiro et al. 2014; Takáts et al. 2014; Dall’Ora et al. 2014) including the SN 1987A-like ones (Pastorello et al. 2012).
The code solves the equations of relativistic radiation hydrodynamics in spherical symmetry for a self-gravitating matter fluid which interacts with radiation. Its distinctive features are: 1) a fully general relativistic treatment; 2) an accurate treatment of radiative transfer at all regimes (from the one in which the ejecta are optically thick up to when they are optically thin); 3) the coupling of the radiation moment equations with the equations of relativistic hydrodynamics during all the post-explosive phases, adopting a fully implicit Lagrangian finite difference scheme; 4) the computation of heating effects due to decays of radioactive isotopes synthesized in the SN explosion; and 5) the computation of the gravitational effects of the central compact object on the evolution of the ejecta.
Thanks to these characteristics, the code is able to compute the evolution of the stellar ejecta and emitted luminosity from the breakout of the shock wave at the stellar surface up to the so-called nebular stage (i.e. when the envelope has recombined and the energy budget is dominated by the radioactive decays of the heavy elements synthesized in the explosion, see also Section 3.1). At the same time, the code is able to accurately determine the fallback of material on the central object and, as a consequence, the amount of 56Ni present in the ejected envelope at late times.
The simulations start from the breakout of the shock wave at the stellar surface, using initial conditions that mimic the physical properties of the ejected material after shock passage following the core-collapse (Pumo & Zampieri 2011). As a consequence, the models depend on some basic parameters that characterize the main radiative, thermal, and dynamical properties of such material. These parameters are: the progenitor radius , the total ejecta energy , the envelope mass at shock breakout , and the total amount of 56Ni initially present in the ejected envelope . In our simulations coincides with the total mass surrounding the central compact object at the start of simulations. So, during the post-explosive evolution, is equal to the ejected mass plus the mass fallen back to the central compact object. In our models of SN 1987A, the latter mass is of the order of a few hundredths of a solar mass and, as a consequence, essentially corresponds to .
We performed several simulations of the SN evolution, exploring the parameter space defined by and . The exploration has been restricted to the ranges of values commonly discussed in the literature for SN 1987A (Arnett 1987; Woosley 1988; Utrobin & Chugai 2005; Pumo & Zampieri 2011; Handy et al. 2014): we considered models with ranging between 8 and 19 (including the bulk of ejecta and the high-velocity shell), and ranging between 1 and erg. Also, in our model, the outermost high-velocity shell ( km s-1; Lawrence et al. 2000) can be described by a power law with index (Shigeyama & Nomoto 1990; Blinnikov et al. 2000). Here we explored models with ranging between and , according to the values suggested in the literature (e.g. Woosley 1988). We fixed all the other parameters of the model, namely the initial radius cm (which is a reliable value for the progenitor of SN 1987A; Arnett 1996; Young 2004; Pumo & Zampieri 2011) and the initial amount of 56Ni (corresponding to the amount of Ni synthesized during the explosion of SN 1987A; Arnett et al. 1989).
Note that our 1D SN model cannot simulate possible asymmetries developed during the explosion as suggested by a significant body of observational and simulation evidence. It goes without saying that the most desirable way to model a CC-SN would include a multi-dimensional hydrodynamical calculation, following the core-collapse, the bounce at nuclear densities, the leakage of neutrinos from the proto-neutron star, the neutrino heating, and the delayed explosion with the shock propagating through the envelope to be ejected. However, current multi-dimensional models can follow the evolution of the exploding star only for a very short time111However note that a new approach to follow the post-explosion evolution of the SN in multi-dimensions for a longer time has been proposed recently by Joggerst et al. (2009). (of the order of few minutes), preventing any possibility to use their output for post-explosion calculations that follow in detail the evolution of the CC-SN ejecta. Conversely, our 1D model allows us to follow the post-explosion evolution of the SN for days, to describe in detail the fallback by using a full-relativistic approach and, therefore, to estimate accurately the total mass ejected in the SN explosion. Also our lagrangian code is not flux-limited (as the multi-dimensional codes are), allowing us to simulate accurately the evolution of the ejected material during both the initial phase of the shock breakout and the following nebular phase in which the ejected SN envelope has recombined.
2.2. Modeling the supernova remnant evolution
Optical images clearly show that the structure of the nebula as well as the morphology and evolution of the ejecta are inherently 3D (Kjær et al. 2010; Larsson et al. 2011, 2013). Therefore, once the early phase of the SN explosion has been modeled in 1D (see Section 2.1), the output of the SN simulation was mapped into 3D. Then the subsequent evolution and transition from the SN phase to the SNR phase were modeled by numerically solving the time-dependent fluid equations of mass, momentum, and energy conservation; the equations in a 3D Cartesian coordinate system take into account the radiative losses from an optically thin plasma:
| (1) |
where is the total gas energy (internal energy, , and kinetic energy), is the time, is the mass density, is the mean atomic mass (assuming cosmic abundances), is the mass of the hydrogen atom, is the hydrogen number density, is the electron number density, u is the gas velocity, is the temperature, and represents the radiative losses per unit emission measure. We used the ideal gas law, , where is the adiabatic index.
The calculations were performed using the flash code (Fryxell et al. 2000). The hydrodynamic equations were solved using the flash implementation of the Piecewise Parabolic Method (PPM) algorithm (Colella & Woodward 1984). For the present application, the code has been extended by additional computational modules to handle the radiative losses (through a table lookup/interpolation method) and to calculate the deviations from electron-proton temperature-equilibration and the deviations from equilibrium of ionization of the most abundant ions. The output of the latter modules was used in the synthesis of X-ray emission (see Section 2.3).
The 3D simulations start once the majority of the energy released in the explosion was kinetic ( hours after the explosion). Note that, at variance with our 1D SN model, the 3D simulations do not include a heating term due to decays of radioactive isotopes synthesized in the SN explosion, such as 56Co or 44Ti. On the other hand, in Appendix A, we show that our simplification does not affect significantly the radial profiles of density and velocity of the ejecta at later times. This evidence supports our assumption to neglect the effect of radioactive heating during the interaction of the remnant with the H II region and with the dense equatorial ring.
We followed the interaction of the blast wave and ejecta with the circumstellar nebula during the first 40 years of evolution (namely until the presumed launch date of the Athena X-ray observatory; Nandra et al. 2013). The initial remnant radius was AU ( pc). As suggested by previous studies (Orlando et al. 2012), we assumed that the initial density structure of the ejecta was clumpy. To this end, after the 1D radial density distribution of ejecta was mapped into 3D, we modeled the ejecta clumps as per-cell random density perturbations derived from a power-law probability distribution (Orlando et al. 2012). The latter distribution, with index , is characterized by a parameter representing the maximum density perturbation allowed in the simulation. For the purposes of this paper, we assumed that the ejecta clumps have initial size cm (0.4 AU, corresponding to 2% of the initial remnant radius) and a maximum density perturbation . The size and density contrast of the modeled ejecta clumps are in agreement with those suggested by spectropolarimetric studies of SNe (Wang et al. 2003, 2004; Hole et al. 2010).
| CSM component | Parameters | Units | Range of values explored | Best-fit values |
|---|---|---|---|---|
| BSG wind: | ( year-1) | |||
| (km s-1) | 500 | 500 | ||
| (pc) | 0.05 | 0.05 | ||
| H II region: | ( cm-3) | 0.9 | ||
| (pc) | 0.08 | |||
| Equatorial ring: | ( cm-3) | 1 | ||
| (pc) | 0.18 | 0.18 | ||
| ( cm) | ||||
| ( cm) | ||||
| Clumps: | ( cm-3) | |||
| (pc) | ||||
| ( cm) | ||||
| 50 |
Initially the blast wave from the SN explosion propagates through the wind of the progenitor BSG. We adopted wind values discussed in the literature (Morris & Podsiadlowski 2007); in particular, we assumed a spherically symmetric wind with a mass-loss rate of year-1 and wind velocity km s-1; the wind gas density is proportional to (where is the radial distance from SN 1987A) and the termination shock of the wind is located approximately at pc. Table 1 summarizes the parameters adopted.
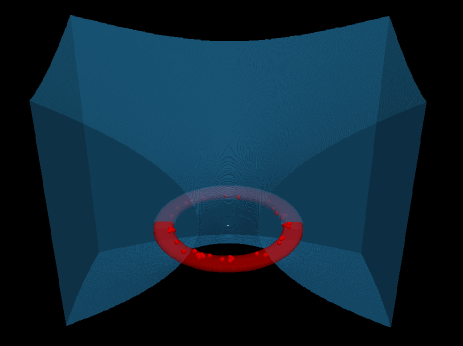
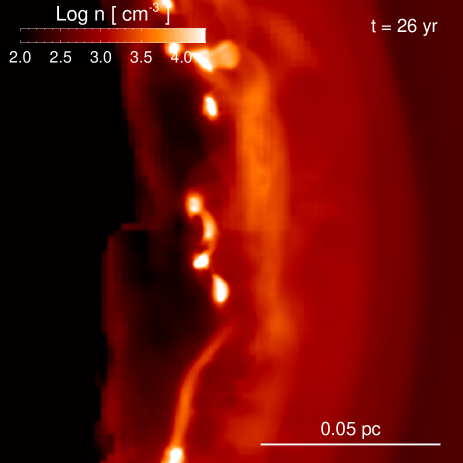
The circumstellar nebula probably originates from the interaction of a slow wind from an early RSG phase with a faster wind from a subsequent BSG phase (Kwok et al. 1978). Thus the nebula was modeled assuming that it is composed by a dense inhomogeneous equatorial ring surrounded by an ionized H II region (Chevalier & Dwarkadas 1995; Sugerman et al. 2005). Figure 1 shows an example of initial configuration of the nebula. The ring (marked red in the figure) consists of a uniform smooth component and high-density spherical clumps mostly located in the inner portion of the ring. The smooth component has an elliptical cross section with the major axis lying on the equatorial plane. The clumps mimic the protrusions emanating from the equatorial ring and probably formed by hydrodynamic instabilities caused by the interaction of a BSG and a RSG wind (Sugerman et al. 2005). The clumps have all the same diameter but their plasma density and radial distance from SN 1987A are randomly distributed around the values and respectively. The 3D shape and geometry of the H II region were assumed to be analogous to those suggested from the analysis of HST data of the ring nebula around the BSG SBW1, a candidate twin of the SN 1987A progenitor (Smith et al. 2013).
We explored the parameter space defined by: a) the plasma density and inner edge of the H II region; b) the density , radial distance from SN 1987A , radial extension , and height of the uniform component of the ring; c) the average density , average radial distance from SN 1987A , diameter , and number of high-density spherical clumps of the ring. In order to limit as much as possible our exploration (that is very computer demanding in the case of a 3D model), we adopted as fiducial values those reported in the literature and found by comparing the results of a 1D hydrodynamic model of SN 1987A with observations (Dewey et al. 2012). Then we explored the parameter space around these values, adopting an iterative process of trial and error to converge on model parameters that reproduce the X-ray lightcurve and spectra of SN 1987A. Table 1 summarizes the ranges of values explored and the parameters of the model best-reproducing the data.
We traced the evolution of the different plasma components (namely the ejecta, the H II region, and the ring material) by considering passive tracers associated with each of them. Each material is initialized with , while elsewhere, where the index “i” refers to the ejecta (ej), the H II region (HII), and the ring material (rg). During the remnant evolution, the different materials mix together, leading to regions with . At any time the density of a specific material in a fluid cell is given by .
We assumed the SN explosion at the origin of the 3D Cartesian coordinate system . The system is oriented in such a way that the dense equatorial ring lies on the plane. The computational domain extends 1 pc in the , , and directions. A major challenge in modeling the explosion and subsequent evolution of SN 1987A was the very small scale of the system in the immediate aftermath of the SN explosion (the initial remnant radius is pc) with the size of the rapidly expanding blast wave. To capture this range of scales, we exploited the adaptive mesh refinement capabilities of the flash code, employing 18 nested levels of refinement, with resolution increasing twice at each refinement level. The refinement/derefinement criterion (Löhner 1987) implemented in flash follows the changes in mass density, temperature, tracer of ejecta, and tracer of the ring.
The calculations were performed using also an automatic mesh derefinement scheme in the whole spatial domain that kept the computational cost approximately constant as the blast expanded (Orlando et al. 2012): the maximum number of refinement levels used in the calculation gradually decreased from 18 (initially) to 9 (at the final time) following the expansion of the blast and ensuring a number of grid zones per radius of the remnant during the whole evolution. At the beginning (at the end) of the simulation, this grid configuration yielded an effective resolution of pc ( pc) at the finest level, corresponding to zones per initial radius of the remnant ( zones per final radius of the remnant). The effective mesh size varied from initially to at the final time. Note that the maximum spatial resolution achieved by Potter et al. (2014) in their 3D model was pc (corresponding to an effective mesh size of ) during the whole evolution.
The high-spatial resolution achieved in our simulations required about seven millions of CPU hours on the MareNostrum III cluster hosted at the Barcelona Supercomputing Center (Barcelona, Spain) and about four millions of CPU hours on the FERMI cluster hosted at CINECA (Bologna, Italy). Most of these resources were made available by a large computational program awarded in the framework of the PRACE222http://www.prace-ri.eu (Partnership for Advanced Computing in Europe) initiative to enable high-impact scientific research with a pan-European supercomputing infrastructure, the top level of the European high performance computing systems.
2.3. Synthesis of X-ray emission
From the model results, we synthesized the X-ray emission originating from the interaction of the blast wave with the surrounding nebula, following an approach analogous to that of previous studies (Orlando et al. 2006, 2009). The results of numerical simulations are the evolution of temperature, density, and velocity of the plasma in the whole spatial domain. We rotated the system about the three axis to fit the inclination of the ring as found from the analysis of optical data (Sugerman et al. 2005), namely , , and .
In the case of fast collisionless shocks, as those observed in SNRs, the synthesis of X-ray emission has to take into account the lack of temperature-equilibration between electrons and ions. In fact, the jump conditions at shock speeds exceeding 500 km s-1 drive thermal and dynamic changes of the plasma on very short timescales. Most of the shock energy is transferred to ions (Ghavamian et al. 2007), so that the ratio of the electron to ion temperature in the post-shock region is generally less than 1: the larger the shock velocity, the smaller . We computed this effect in our model by considering that the equilibration in the post-shock plasma is reached through Coulomb collisions which are expected to proceed relatively slowly (Ghavamian et al. 2007), leading to . To take into account this effect, we added an additional passive tracer to the model equations which stores the time when the plasma in the -th domain cell was shocked. Then the electron temperature in each cell was calculated from the time and from the ion temperature and plasma density derived by integrating Eqs. 1. More specifically, we assumed that the electrons are heated almost istantaneously at the shock front up to keV (regardless of the shock Mach number) by lower hybrid waves (Ghavamian et al. 2007), as suggested for shock velocities of the order of km s-1 like those in our simulations. Then we calculated the evolution of ion and electron temperatures in each cell of the post-shock medium by including the effects of the Coulomb collisions. This evolution was calculated in the time ( is the current time) since when the plasma in the cell was shocked.
Another important effect to take into account in the synthesis of X-ray emission from fast shocks is the time lag of the plasma to change its ionization from a cool to a hot state. If the timescale of the temperature increase at the shock front is much shorter than the ionization and recombination timescales, the plasma ions can be at a lower ionization state than the equilibrium state corresponding to the local electron temperature (Hamilton et al. 1983). Such deviations from equilibrium of ionization may have dramatic effects on the interpretation of observations. They are taken into account in our model by following an approach discussed in the literature (Dwarkadas et al. 2010) which is particularly effective in the case of 3D simulations in order to have high efficiency together with a reasonable accuracy in the synthesis of X-ray emission. From the values of emission measure, electron temperature, and maximum ionization age in the -th domain cell, the corresponding X-ray spectrum is synthesized by using the NEI emission model VPSHOCK available in the XSPEC package along with the ”NEI version 2.0” atomic data from ATOMDB (Smith et al. 2001). The emission measure in the -th domain cell is em (where is the particle density in the cell, is the cell volume); the electron temperature in the cell is computed by taking into account the deviations from temperature-equilibration as described above; the maximum ionization age in the cell is (where is the time since when the plasma in the cell was shocked; see above).
| Parameter | Valuea | Reference |
|---|---|---|
| kpc | Panagia (1999) | |
| cm-2 | Park et al. (2006) | |
| He | 2.57 | Zhekov et al. (2009) |
| C | 0.03 | Zhekov et al. (2009) |
| N | 0.56 | Zhekov et al. (2009) |
| O | 0.081 | Zhekov et al. (2009) |
| Ne | 0.29 | Zhekov et al. (2009) |
| Mg | 0.28 | Zhekov et al. (2009) |
| Si | 0.33 | Zhekov et al. (2009) |
| S | 0.30 | Zhekov et al. (2009) |
| Ar | 0.537 | Zhekov et al. (2009) |
| Ca | 0.03 | Zhekov et al. (2009) |
| Fe | 0.19 | Zhekov et al. (2009) |
| Ni | 0.07 | Zhekov et al. (2009) |
We assumed the source at a distance kpc (Panagia 1999). We adopted the metal abundances derived from the analysis of deep Chandra/LETG and HETG observations of SN 1987A (Zhekov et al. 2009) and summarized in Table 2. The X-ray spectrum from each cell was filtered through the photoelectric absorption by the ISM, assuming a column density cm-2 (Park et al. 2006). We integrated the absorbed X-ray spectra from the cells in the whole spatial domain. The spectra are then folded through the instrumental response of the X-ray instruments of interest, obtaining the relevant focal-plane spectra. In such a way, we derived X-ray spectra as they would be collected with XMM-Newton/EPIC and, in the near future, with Athena/WFI, and X-ray images as they would be collected with Chandra/ACIS. The synthesized spectra and images were put in a format identical to that of real X-ray observations and analyzed with the standard data analysis system used for the specific instruments of interest.
3. Results
3.1. Post-explosion evolution of the supernova
The post-explosion evolution of the simulated SN 1987A follows the trend described in details by Pumo & Zampieri (2011). Here we summarize the main phases. The evolution is guided by the thermodynamics of the expanding ejecta and passes through three different phases. Initially the envelope is completely ionized and optically thick, and the emission is due to the release of internal energy on a diffusion timescale (diffusive phase). Then the ejecta recombine and the emission is dominated by the sudden release of energy caused by the receding motion of the wavefront through the envelope (recombination phase). Finally, the envelope is recombined and optically thin to optical photons, and the emission comes from the thermalization of the energy deposited by gamma-ray photons (radioactive-decay phase or nebular phase). Usually the first two phases are globally referred as photospheric phase, during which it is possible to compare the observed photospheric temperature and velocity with the corresponding simulated quantities, contrarily to the nebular phase where the same notion of photosphere loses its meaning (Pumo & Zampieri 2011; Bersten et al. 2011). We adopted the so-called inflection time (measured from the explosion epoch) as a measurement of the duration of the photospheric phase (Pumo & Zampieri 2013); for SN 1987A days.
| Model | |||||
|---|---|---|---|---|---|
| [] | [ erg] | [ cm] | [] | ||
| SN-M17-E1.2-N8 | 17 | 1.2 | -8 | 3 | 0.07 |
| SN-M15-E1.2-N8 | 15 | 1.2 | -8 | 3 | 0.07 |
| SN-M17-E1.4-N8 | 17 | 1.4 | -8 | 3 | 0.07 |
| SN-M17-E1.2-N9 | 17 | 1.2 | -9 | 3 | 0.07 |
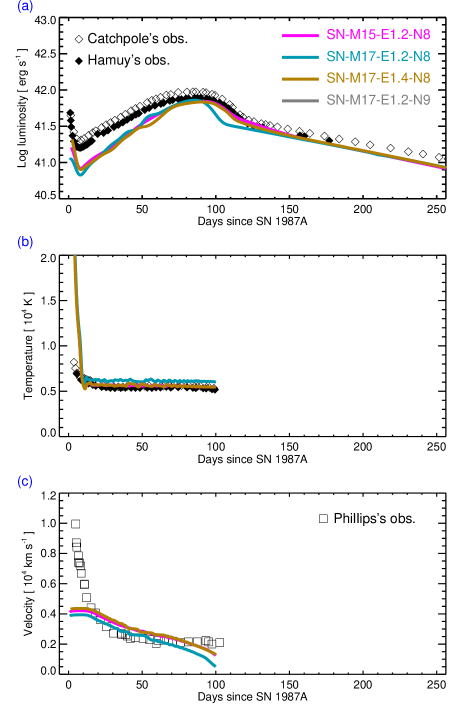
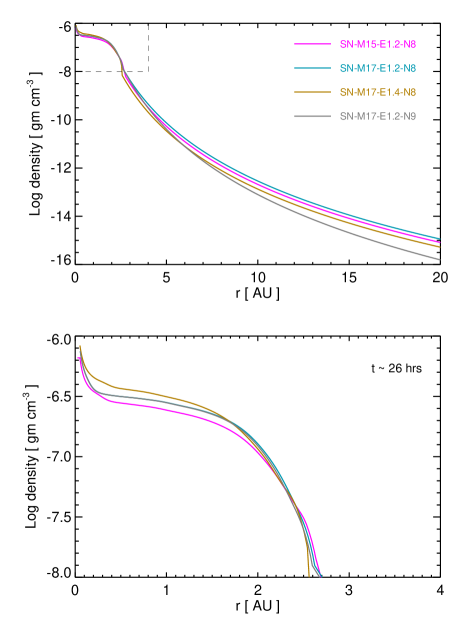
From the models, we derived the main observables (namely the bolometric lightcurve and the evolution of the photospheric temperature and velocity) during the first 250 days after explosion. Then we compared the model results with observations of SN 1987A by performing a simultaneous fit of these observables, thus constraining the ejected mass and the explosion energy of the SN. We found the comparison with the observations satisfactory for models with a total energy ranging between 1.2 and erg and an envelope mass between 15 and 17 (see Fig. 2). Figure 3 shows the radial distribution of mass density 26 hours after the breakout of the shock wave at the stellar surface for the models best reproducing the observations (see Table 3 for details). Note that runs SN-M17-E1.2-N8 and SN-M17-E1.2-N9 differ only for the slope of the power-law describing the high-velocity shell of the SN (see Section 3.1): the density and kinetic energy in the outer envelope are lower for the steeper profile of density. The ejecta distribution in this outer shell does not change significantly the observables of the SN.
The difficulty of reproducing the observables at early time in Fig. 2 is mainly due to the initial conditions used in our simulations (see Section 2.1), while some less prominent discrepancies at late times ( days) might be explained by the absence of non-thermal ionization from gamma rays in our model (Pumo & Zampieri 2011).
The comparison of model results with observations enabled us to constrain the bulk of envelope mass and the enegy of the explosion . On the other hand, no firm conclusions on the distribution of energy and mass in the high-velocity shell of the SN were obtained from the analysis of SN observables.
3.2. Remnant expansion through the circumstellar nebula
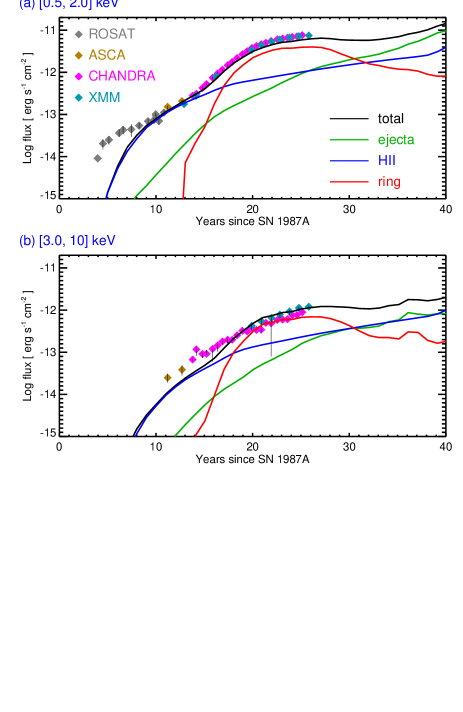
We followed the evolution from the SN phase to the SNR phase for 40 years, restricting our analysis to SN models reproducing the main observables of SN 1987A during the first 250 days of evolution (listed in Table 3). Then, we explored the space of parameters describing the CSM (mainly the equatorial ring and the H II region) and compared the X-ray lightcurves and spectra synthesized from the models with those observed in SN 1987A (see Fig 5).
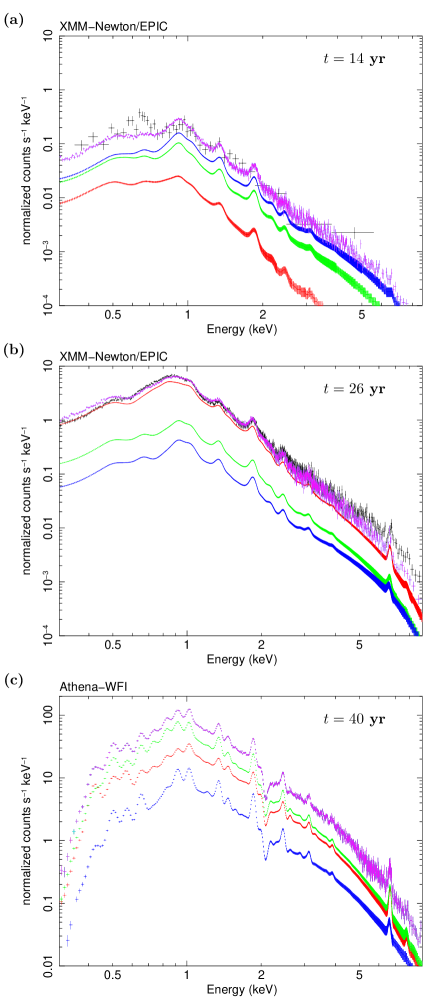
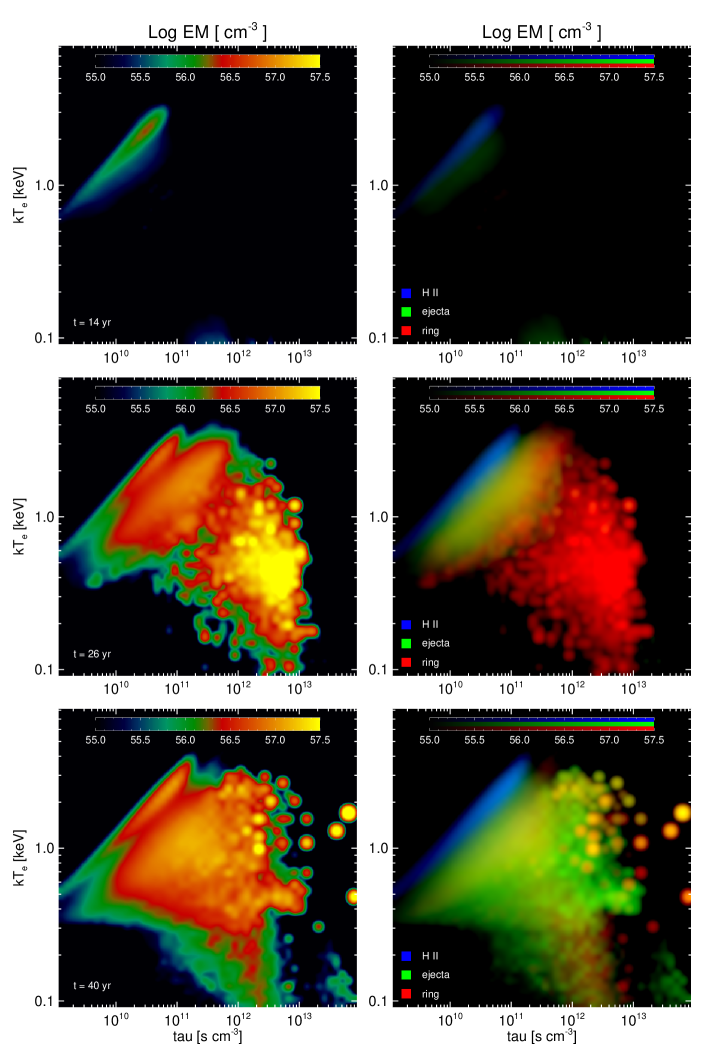
In all the cases investigated, the evolution follows the same general trend. Initially the blast wave from the SN propagates through the wind of the progenitor BSG. About 3 years after explosion, the ejecta reach the H II region (see on-line movie) and the transition from SN to SNR enters into its first phase of evolution (H II-region-dominated phase). A forward and a reverse shocks are generated, the former propagating into the H II region and the latter driven back into the ejecta (see Fig. 4). The X-ray emission begins to increase rapidly with time and is dominated by emission from shocked plasma of the H II region and by a smaller contribution of shocked ejecta in the outer SN envelope. This is evident from the lightcurves (Fig. 5), the spectra (Fig. 6), and the emission morphology (Fig. 8 and on-line movie). The emitting plasma is largely out of equilibrium of ionization and its emission measure distribution as a function of electron temperature, , and ionization time scale, , is peaked at keV and s cm-3 with a sharp distribution that can be approximated with an isothermal plasma component (see upper panels of Fig. 7). This is in excellent agreement with the best-fit parameters derived from the spectral fitting with isothermal components of X-ray spectra of SN 1987A at this epoch (see Appendix B). This phase lasts until the blast wave hits the equatorial ring (year 15).
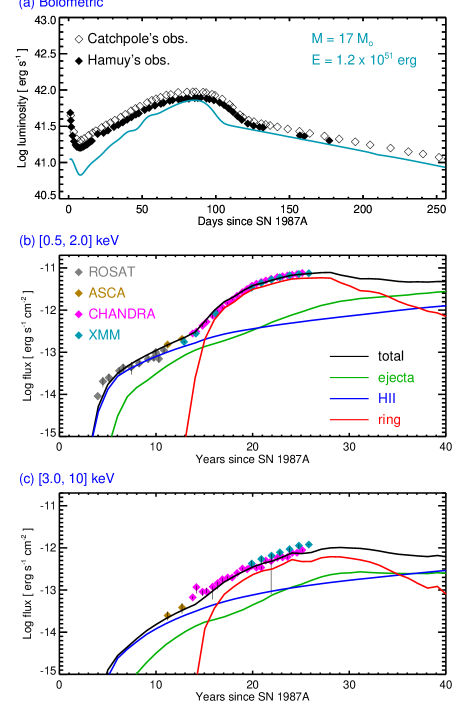
In the H II-region-dominated phase, we found that the sudden increase observed in the soft X-ray band ( keV) is best-fitted by models in which the outer layers of ejecta have a post-explosion radial profile of density approximated by a power law with index (see Fig. 5b). On the contrary, we found that models with index systematically underestimate the soft X-ray flux during the first 7 years even by changing the values of and within the range of values compatible with observations. This is evident in Fig. 9 where we report the result for the model with best approximating the observations: the discrepancy between model results and observations is evident for yr even though the same model fits well the bolometric lightcurve of the SN during the first 250 days of evolution (see Fig. 2) and the X-ray lightcurves for years (Fig. 9). Table 4 reports the parameters of this model to be compared with those of the model with shown in Table 1. The reason for this discrepancy is the content of energy and mass of the outer shell of ejecta which is the first material hitting the nebula and, thus, determining the early X-ray emission from the ejecta-nebula interaction. Models with have less mass and energy in the outer shell than models with and, as a result, the corresponding soft X-ray lightcurve rises more slowly and fails in fitting the observations.
| CSM component | Parameters | Units | Best-fit values |
| BSG wind: | ( year-1) | ||
| (km s-1) | 500 | ||
| (pc) | 0.05 | ||
| H II region: | ( cm-3) | 20 | |
| (pc) | 0.1 | ||
| Equatorial ring: | ( cm-3) | 1 | |
| (pc) | 0.18 | ||
| ( cm) | |||
| ( cm) | |||
| Clumps: | ( cm-3) | ||
| (pc) | |||
| ( cm) | |||
| 40 |
Note that the value of have little (if any) effect in determining the main observables of the SN (e.g. the bolometric lightcurve) during the first 250 days of evolution. SN models with the same envelope mass and total energy but with different values of lead to very similar results (see Fig. 2). This is due to the fact that the observables of the SN depend on the bulk of ejecta. Our findings, therefore, shows that the X-ray emission originating from the SNR in this phase can constrain the structure of outermost ejecta better than the emission from the SN. Since the density profile of ejecta is expected to depend on the structure of the progenitor star and on the shock acceleration of the gas during the explosion, studying the early interaction of the ejecta with the nebula may provide important clues to the latest stage of stellar evolution and may be used as a probe of the mechanisms involved in the SN engine.
During the H II-region-dominated phase, the model enabled us to constrain also the parameters characterizing the H II-region (namely its density and inner radius); the best-fit parameters are listed in Table 1.
Around year 13 the blast wave hits the first dense clump of the equatorial ring and around year 15 it reaches the inner edge of the ring (see Fig. 4 and on-line movie). The transition from SN to SNR enters into the second phase of evolution (ring-dominated phase) which lasts until year 32, when the forward shock propagates beyond the majority of the dense ring material. This phase is characterized by the interaction of the forward shock with the dense clumps of the ring. Each shocked clump evolves toward a core-plume structure with a crescent-like shape characterized by Kelvin-Helmholtz instabilities developing in the downstream region (see Fig. 10 and on-line movie). As the shock travels through the clump, Rayleigh-Taylor instabilities develop on the upstream side of the clump, leading to its progressive fragmentation. A complex pattern of filaments and fragments forms in the interclump region, with densities varying between cm-3 in the smooth component of the ring and cm-3 in proximity of the clumps. Note that the appropriate description of the shock-clump interaction required the high-spatial resolution adopted in our simulations. The modelled features cannot be reproduced at lower resolutions (e.g. Potter et al. 2014).
In this phase, the contribution from the shocked ring dominates the X-ray emission (see Figs. 5-8 and on-line movie). The shocked cores of the clumps lead predominantly to soft X-rays and determine the further steepening of the soft X-ray lightcurve (Fig. 5b). This emitting plasma component is essentially in collisional ionization equilibrium and its emission measure peaks to electron temperature keV and ionization time scale s cm-3 (see middle panels of Fig. 7). We can roughly identify this material with the plasma component with s cm-3 derived from the spectral fitting of X-ray spectra of SN 1987A collected with current X-ray observatories for yr (e.g. Helder et al. 2013; see also Appendix B). The smooth component of the ring and the fragments of the shocked clumps stripped by hydrodynamic instabilities dominante the emission in the hard band. This plasma component causes the broadening of the emission measure distribution around the peak due to shocked clumps and includes plasma with up to keV and down to s cm-3 (see middle panels of Fig. 7). Also a significant contribution to the emission with keV and s cm-3 comes from the shocked ejecta. Given the complexity of the emission measure distribution in this phase, it is not obvious to attribute a physical meaning to the isothermal components with s cm-3 derived from the spectral fitting of the X-ray spectra of SN 1987A and largely used in the literature (see Appendix B). Indeed the physical origin of the observed X-ray spectra is unveiled by our hydrodynamic model, as shown in Fig. 7. From the model best reproducing the X-ray lightcurves and spectra, we were able to constrain the parameters characterizing the equatorial ring (see Table 1 for details).
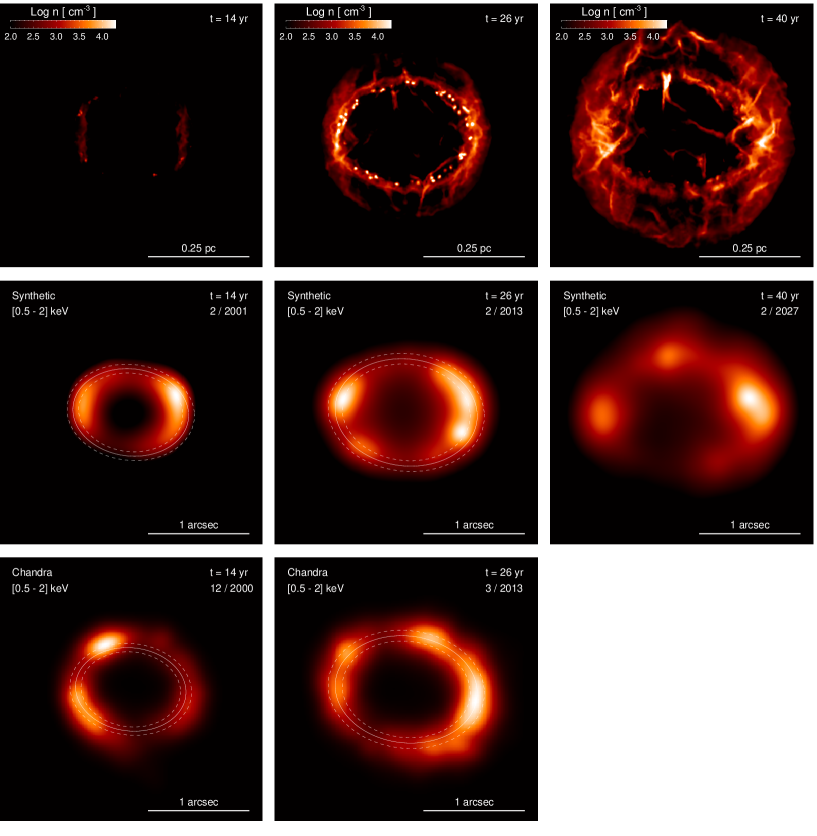
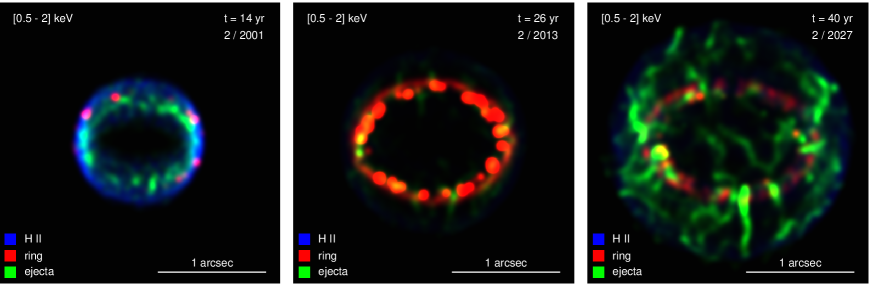
During the first two phases of evolution, the remnant morphology in the X-ray band synthesized from the model appears very similar to that observed. In particular, in the ring-dominated phase, the morphology is characterized by bright knots originating from the shocked clumps and resambles that of SN 1987A (see Figs. 4, 8, and on-line movie). In Fig. 4 we compare the synthetic and the observed morphology at two different epochs (years 14 and 26). The ellipsoids overplotted in the figure represent the projection of circles lying in the equatorial plane of SN 1987A and fitting the position of the maximum X-ray emission in the observations. Although the extension of the X-ray source synthesized from the model seems to be smaller than the observed one (suggesting a modelled blast wave slightly slower than observed), the synthetic maps fit those observed within an uncertainty of 10% (dashed lines). In particular, at year 14, the observations show a bright knot at north-west that may indicate that the observed blast wave is at a distance larger than that in our model. On the other hand, the knot is also well beyond the ellipsoid fitting the position of the forward shock in the equtorial plane, suggesting that, probably, the knot is the result of the interaction of the blast wave with some inhomogeneity at some height above the equatorial plane. This feature could be reproduced in our model considering, for instance, an overdense clump located well above the equatorial plane.
The remnant enters into the third phase (ejecta-dominated phase) around year 32, when the contribution of shocked ejecta to the soft X-ray emission becomes the dominant component (see Figs. 5-8). The reverse shock travels through innermost ejecta with higher densities. Now the emitting plasma is characterized by a broad emission measure distribution that peaks at keV and s cm-3 although it is also characterized by few spikes with s cm-3 due to the interaction of high-density clumps of ejecta with the ring (see lower panels of Fig. 7 and right panel in Fig. 8). The remnant morphology shows a revival of very bright knots but now due to shocked clumps of ejecta rather than clumps of the ring (see Fig. 4 and on-line movie). Our simulations show that, in this phase, the evolution of the X-ray emission depends again on the density distribution of the outermost ejecta as in the H II-region-dominated phase. Models with the same explosion energy and envelope mass but with a different slope of the density profile of ejecta lead to significantly different X-ray lightcurves after year 32 (compare Fig. 5 and Fig. 9). In particular we found that the steeper is the density profile, the higher is the contribution of shocked ejecta to X-ray emission after year 32. In the next future, therefore, SN 1987A will offer the possibility to study directly the structure and chemical composition of innermost ejecta and the imprint of the metal-rich layers inside the progenitor star.
3.3. The central compact remnant
Pioneering studies by Fransson & Chevalier (1987) suggested that the dense shells of expanding ejecta may obscure the X-ray emission of the compact object (if any) of SN 1987A for a few decades. Our model describes the distribution of the ejecta (shocked and unshocked) as well as the complex circumstellar environment. Thus the model allows us to get a thorough description of the local absorption in the remnant and to derive constraints on the X-ray emission of its yet undetected central source.
The effective surface temperature of an isolated neutron star with an age of yr is expected to be in the range MK (e. g., Shternin & Yakovlev 2008). This temperature should stay constant until the age of the star is lower than its thermal relaxation time, , which is in the range yr, depending on the properties of the stellar crust and of its core (e.g. Shternin & Yakovlev 2008). From the analysis of Chandra observations, Ng et al. (2009) derived an upper limit of counts per second for the central source (in the keV energy band) on the basis of its non-detection in the Chandra-HRC data. Without accounting for the local absorption, this upper limit corresponds to a surface temperature lower than MK, which is at odds with predictions from standard theories and may suggest extremely short values of due, for example, to superfluidity or quark matter.
Our model shows that, at the present epoch, the column density toward the center of the remnant333We inspected a region cm wide (corresponding to arcsec considering the distance of pc) to account for a possible proper motion of the central object around the geometrical center of the remnant, finding limited variations of the absorbing column. is cm-2, mainly associated with the unshocked ejecta. This local absorbing column density is almost a factor of 20 higher than the interstellar absorption toward the Large Magellanic Cloud and allows us to revise the constraints on the thermal emission from the central source suggested by Ng et al. (2009). By accounting for the local absorption, we then obtained an upper limit of MK for the surface temperature (i.e. a bolometric luminosity erg s-1), by considering a neutron star with radius km at a distance of kpc. This revised value is in good agreement with standard theories, which suggest bolometric luminosities erg s-1 (e.g. Yakovlev & Pethick 2004), without invoking the presence of very short values of .
The X-ray emission from young pulsars is typically dominated by a nonthermal component. Therefore, we also considered the case of nonthermal radiation, by assuming a characteristic power-law index . Taking into account the high local absorption from the unshocked ejecta, we found that the count-rate upper limit obtained with Chandra converts to a luminosity erg s-1 in the keV band, corresponding to a flux of mCrab at kpc (to be compared with erg s-1 obtained by Ng et al. 2009).
Finally we studied the variation of the local absorption with time, finding a relatively fast decrease. In particular, we verified that the expansion of the ejecta will reduce the column density by a factor of ( cm-2) at the end of our simulation (corresponding to 40 yr after the explosion), namely at the presumed launch date of the Athena X-ray observatory (Nandra et al. 2013).
It is worth noting that, according to our model, the bulk of the absorption originates in the ejecta. The high metallicity of the expanding ejecta strongly enhances their optical depth with respect to a medium with a solar chemical composition, the O rich ejecta heavily absorbing the X-ray radiation below 1 keV, and the Si, S, and Fe-rich ejecta contributing at higher energies (see Wilms et al. 2000 for details). We can then consider our estimates (obtained by assuming a solar composition) as conservative. A detailed description of the local absorption, however, would requires a detailed knowledge of the distribution of the chemical abundances in the ejecta, which is beyond the scope of this paper.
4. Summary and concluding remarks
We investigated how the morphology and the emission properties of the remnant of SN 1987A reflect: 1) the physical characteristics of the progenitor SN and 2) the early interaction of the SN blast wave with the surrounding inhomogeneous nebula. To this end, we have developed a model describing SN 1987A from the breakout of the shock wave at the stellar surface up to the 3D expansion of its remnant. A major challange was capturing the enormous range in spatial scales (spanning six orders of magnitude) that required a very high spatial resolution (down to AU). We performed an exploration of the parameters space, searching for a model reproducing at the same time both the observables of the SN (i.e. bolometric lightcurve, evolution of line velocities, and continuum temperature at the photosphere) and the X-ray emission of the remnant (lightcurves, spectra, and morphology). Our findings lead to several conclusions:
1. We identified three phases in the evolution (see Fig.4 and on-line movie). During the first phase (H II-region-dominated phase; from year 3 to 15) the fastest ejecta interact with the H II region and the X-ray emission is dominated by shocked plasma from this region and by a smaller contribution from the outermost ejecta (see Figs. 5, 6, and on-line movie). In the second phase (ring-dominated phase; from year 15 to 32) the ejecta interacts with the dense equatorial ring. The emission in the soft X-ray band is largely dominated by the shocked clumps (see Figs. 5, 6, and on-line movie). The emission in the hard X-ray band is mainly due to shocked plasma from the smooth component of the ring and to fragments of the shocked clumps stripped by hydrodynamic instabilities developing at the cloud boundaries. In the third phase (ejecta-dominated phase; from year 32), the forward shock propagates beyond the majority of the dense ring material and the reverse shock travels through the inner envelope of the SN. The X-ray emission is dominated by shocked ejecta (see Figs. 5 and 6) and the remnant morphology is characterized by very bright knots due to shocked clumps of ejecta (see on-line movie).
2. Our favored model reproduces altogether the main observables of SN 1987A (bolometric lightcurve and evolution of photospheric temperature and velocity) during the first 250 days after explosion and the observed X-ray lightcurves and spectra of its remnant (see Figs. 5 and 6) in the following 30 years. Therefore, we have demonstrated that the physical model reproducing the observables of the SN is able to reproduce also the observables of the subsequent expanding remnant, providing a firm link between two research fields (SN explosions and SNR evolution) which, traditionally, are based on models that are independent from each other. In other words, in the case of SN 1987A, we have demonstrated the consistency between the cause (the SN explosion) and the effect (the interaction of the remnant with the surrounding medium). This is a great advance with respect to a parameterised explosion model to bootstrap the SNR (as those commonly used in the literature) whose parameters are chosen to fit the observables of the remnant but that does not ensure to fit also the observables of the progenitor SN.
3. From our favored model, we identified the imprint of SN 1987A on the remnant emission. In particular, we constrained the SN explosion energy in the range erg and the envelope mass in the range . The model also constrained the physical properties of post-explosion ejecta. During the H II-region-dominated phase, the sudden increase of X-ray flux observed around year 4 (Fig. 5b) is reproduced if the outermost ejecta have a post-explosion radial profile of density approximated by a power law with index . On the contrary, models with index (as early suggested for SN 1987A; Woosley 1988) systematically underestimate the soft X-ray flux during the first 7 years since the explosion (see Fig. 9), independently of the density structure of the nebula within the range of values compatible with observations. Indeed the shape of the lightcurves in this phase reflects the structure of outer ejecta and reveals the imprint of the SN on the remnant emission.
4. Our favored model allowed us to constrain the structure of the pre-SN nebula. In the ring-dominated phase, the shape of lightcurves and spectra reflect the density structure of the nebula, allowing to disentangle the effects of the SN event (identified in the previous phase) from those of remnant interaction with the environment. This enabled us to ascertain the origin of the multi-thermal X-ray emission and to constrain the nebula structure (see Table 1 for all the details). From this model we estimated that the total mass of the ring is of which % is plasma with density cm-3 and % is plasma with cm-3. These values are in excellent agreement with those derived from optical spectroscopic data for the density structure of the ionized gas of the ring (Mattila et al. 2010).
Our model enabled us to make predictions about the ejecta evolution and the future changes in the remnant morphology in X-rays. In the next few years, the remnant will enter in the ejecta-dominated phase. The X-ray flux will reflect the radial profile of density in outer ejecta: the steeper the slope of this profile, the higher the emission from shocked ejecta. The emission will enable us to study in more details the ejecta asymmetries and the distribution of metal-rich layers. This will provide important clues on the dynamics of the explosion and might even improve our knowledge about the nucleosynthesis processes occurring in the latest stage of stellar evolution and during the SN explosion, making the remnant of SN 1987A a unique probe of CC-SNe.
Finally, we investigated how our model relate to the existence of the yet undetected central compact remnant. The complete picture of the line of sight column towards the center of SN 1987A provied by our model has shown that the emission of the compact remnant cannot be revealed yet due to a local absorbing column density which is a factor of 20 higher than the interstellar absorption toward the Large Magellanic Cloud. The constraint on the thermal emission from the central source inferred from our model is in good agreement with standard theories of neutron star cooling.
References
- Anders & Grevesse (1989) Anders, E., & Grevesse, N. 1989, Geochim. Cosmochim. Acta, 53, 197
- Arnett (1996) Arnett, D. 1996, Supernovae and Nucleosynthesis (Princeton Series in Astrophysics)
- Arnett (1987) Arnett, W. D. 1987, ApJ, 319, 136
- Arnett et al. (1989) Arnett, W. D., Bahcall, J. N., Kirshner, R. P., & Woosley, S. E. 1989, ARA&A, 27, 629
- Badenes et al. (2008) Badenes, C., Hughes, J. P., Cassam-Chenaï, G., & Bravo, E. 2008, ApJ, 680, 1149
- Bersten et al. (2011) Bersten, M. C., Benvenuto, O., & Hamuy, M. 2011, ApJ, 729, 61
- Blinnikov et al. (2000) Blinnikov, S., Lundqvist, P., Bartunov, O., Nomoto, K., & Iwamoto, K. 2000, ApJ, 532, 1132
- Burrows et al. (2000) Burrows, D. N. et al. 2000, ApJ, 543, L149
- Catchpole et al. (1987) Catchpole, R. M. et al. 1987, MNRAS, 229, 15P
- Catchpole et al. (1988) —. 1988, MNRAS, 231, 75P
- Chevalier & Dwarkadas (1995) Chevalier, R. A., & Dwarkadas, V. V. 1995, Astrophys. J., 452, L45
- Chita et al. (2008) Chita, S. M., Langer, N., van Marle, A. J., García-Segura, G., & Heger, A. 2008, A&A, 488, L37
- Colella & Woodward (1984) Colella, P., & Woodward, P. R. 1984, Journal of Computational Physics, 54, 174
- Crotts et al. (1989) Crotts, A. P. S., Kunkel, W. E., & McCarthy, P. J. 1989, ApJ, 347, L61
- Dall’Ora et al. (2014) Dall’Ora, M. et al. 2014, ApJ, 787, 139
- Dewey et al. (2012) Dewey, D., Dwarkadas, V. V., Haberl, F., Sturm, R., & Canizares, C. R. 2012, Astrophys. J., 752, 103
- Dwarkadas et al. (2010) Dwarkadas, V. V., Dewey, D., & Bauer, F. 2010, MNRAS, 407, 812
- Dwek et al. (2010) Dwek, E. et al. 2010, ApJ, 722, 425
- Ellinger et al. (2012) Ellinger, C. I., Young, P. A., Fryer, C. L., & Rockefeller, G. 2012, ApJ, 755, 160
- Fransson & Chevalier (1987) Fransson, C., & Chevalier, R. A. 1987, ApJ, 322, L15
- Fryxell et al. (2000) Fryxell, B. et al. 2000, Astrophys. J. Suppl. Ser., 131, 273
- Gaensler et al. (1997) Gaensler, B. M., Manchester, R. N., Staveley-Smith, L., Tzioumis, A. K., Reynolds, J. E., & Kesteven, M. J. 1997, ApJ, 479, 845
- Ghavamian et al. (2007) Ghavamian, P., Laming, J. M., & Rakowski, C. E. 2007, ApJ, 654, L69
- Haberl et al. (2006) Haberl, F., Geppert, U., Aschenbach, B., & Hasinger, G. 2006, A&A, 460, 811
- Hamilton et al. (1983) Hamilton, A. J. S., Sarazin, C. L., & Chevalier, R. A. 1983, ApJS, 51, 115
- Hamuy et al. (1988) Hamuy, M., Suntzeff, N. B., Gonzalez, R., & Martin, G. 1988, AJ, 95, 63
- Handy et al. (2014) Handy, T., Plewa, T., & Odrzywołek, A. 2014, ApJ, 783, 125
- Hasinger et al. (1996) Hasinger, G., Aschenbach, B., & Truemper, J. 1996, A&A, 312, L9
- Helder et al. (2013) Helder, E. A. et al. 2013, Astrophys. J., 764, 11
- Hole et al. (2010) Hole, K. T., Kasen, D., & Nordsieck, K. H. 2010, ApJ, 720, 1500
- Joggerst et al. (2009) Joggerst, C. C., Woosley, S. E., & Heger, A. 2009, ApJ, 693, 1780
- Kjær et al. (2010) Kjær, K., Leibundgut, B., Fransson, C., Jerkstrand, A., & Spyromilio, J. 2010, Astron. & Astrophys., 517, A51
- Kwok et al. (1978) Kwok, S., Purton, C. R., & Fitzgerald, P. M. 1978, ApJ, 219, L125
- Larsson et al. (2013) Larsson, J. et al. 2013, Astrophys. J., 768, 89
- Larsson et al. (2011) —. 2011, Nature, 474, 484
- Lawrence et al. (2000) Lawrence, S. S., Sugerman, B. E., Bouchet, P., Crotts, A. P. S., Uglesich, R., & Heathcote, S. 2000, ApJ, 537, L123
- Löhner (1987) Löhner, R. 1987, Comp. Meth. Appl. Mech. Eng., 61, 323
- Lucy (1974) Lucy, L. B. 1974, AJ, 79, 745
- Maggi et al. (2012) Maggi, P., Haberl, F., Sturm, R., & Dewey, D. 2012, Astron. & Astrophys., 548, L3
- Mattila et al. (2010) Mattila, S., Lundqvist, P., Gröningsson, P., Meikle, P., Stathakis, R., Fransson, C., & Cannon, R. 2010, Astrophys. J., 717, 1140
- McCray (2007) McCray, R. 2007, in American Institute of Physics Conference Series, Vol. 937, Supernova 1987A: 20 Years After: Supernovae and Gamma-Ray Bursters, ed. S. Immler, K. Weiler, & R. McCray, 3–14
- Morris & Podsiadlowski (2007) Morris, T., & Podsiadlowski, P. 2007, Science, 315, 1103
- Nandra et al. (2013) Nandra, K. et al. 2013, ArXiv e-prints
- Ng et al. (2009) Ng, C.-Y., Gaensler, B. M., Murray, S. S., Slane, P. O., Park, S., Staveley-Smith, L., Manchester, R. N., & Burrows, D. N. 2009, ApJ, 706, L100
- Orlando et al. (2006) Orlando, S. Bocchino, F., Peres, G., Reale, F., Plewa, T., & Rosner, R. 2006, A&A, 457, 545
- Orlando et al. (2012) Orlando, S., Bocchino, F., Miceli, M., Petruk, O., & Pumo, M. L. 2012, ApJ, 749, 156
- Orlando et al. (2009) Orlando, S., Drake, J. J., & Laming, J. M. 2009, A&A, 493, 1049
- Panagia (1999) Panagia, N. 1999, in IAU Symposium, Vol. 190, New Views of the Magellanic Clouds, ed. Y.-H. Chu, N. Suntzeff, J. Hesser, & D. Bohlender, 549
- Park et al. (2002) Park, S., Burrows, D. N., Garmire, G. P., Nousek, J. A., McCray, R., Michael, E., & Zhekov, S. 2002, ApJ, 567, 314
- Park et al. (2006) Park, S., Zhekov, S. A., Burrows, D. N., Garmire, G. P., Racusin, J. L., & McCray, R. 2006, ApJ, 646, 1001
- Park et al. (2005) Park, S., Zhekov, S. A., Burrows, D. N., & McCray, R. 2005, ApJ, 634, L73
- Pastorello et al. (2012) Pastorello, A. et al. 2012, A&A, 537, A141
- Patnaude et al. (2015) Patnaude, D. J., Lee, S.-H., Slane, P. O., Badenes, C., Heger, A., Ellison, D. C., & Nagataki, S. 2015, ApJ, 803, 101
- Phillips et al. (1988) Phillips, M. M., Heathcote, S. R., Hamuy, M., & Navarrete, M. 1988, AJ, 95, 1087
- Potter et al. (2014) Potter, T. M., Staveley-Smith, L., Reville, B., Ng, C.-Y., Bicknell, G. V., Sutherland, R. S., & Wagner, A. Y. 2014, ApJ, 794, 174
- Pumo & Zampieri (2011) Pumo, M. L., & Zampieri, L. 2011, Astrophys. J., 741, 41
- Pumo & Zampieri (2013) —. 2013, MNRAS, 434, 3445
- Richardson (1972) Richardson, W. H. 1972, Journal of the Optical Society of America (1917-1983), 62, 55
- Shigeyama & Nomoto (1990) Shigeyama, T., & Nomoto, K. 1990, ApJ, 360, 242
- Shternin & Yakovlev (2008) Shternin, P. S., & Yakovlev, D. G. 2008, Astronomy Letters, 34, 675
- Smith et al. (2013) Smith, N., Arnett, W. D., Bally, J., Ginsburg, A., & Filippenko, A. V. 2013, Mon. Not. R. Astron. Soc., 429, 1324
- Smith et al. (2001) Smith, R. K., Brickhouse, N. S., Liedahl, D. A., & Raymond, J. C. 2001, ApJ, 556, L91
- Spiro et al. (2014) Spiro, S. et al. 2014, MNRAS, 439, 2873
- Sugerman et al. (2005) Sugerman, B. E. K., Crotts, A. P. S., Kunkel, W. E., Heathcote, S. R., & Lawrence, S. S. 2005, Astrophys. J. Suppl. Ser., 159, 60
- Takáts et al. (2014) Takáts, K. et al. 2014, MNRAS, 438, 368
- Utrobin & Chugai (2005) Utrobin, V. P., & Chugai, N. N. 2005, A&A, 441, 271
- Wang et al. (2003) Wang, L. et al. 2003, ApJ, 591, 1110
- Wang et al. (2004) Wang, L., Baade, D., Höflich, P., Wheeler, J. C., Kawabata, K., & Nomoto, K. 2004, ApJ, 604, L53
- West et al. (1987) West, R. M., Lauberts, A., Schuster, H.-E., & Jorgensen, H. E. 1987, A&A, 177, L1
- Wilms et al. (2000) Wilms, J., Allen, A., & McCray, R. 2000, ApJ, 542, 914
- Woosley (1988) Woosley, S. E. 1988, ApJ, 330, 218
- Yakovlev & Pethick (2004) Yakovlev, D. G., & Pethick, C. J. 2004, ARA&A, 42, 169
- Yamaguchi et al. (2014) Yamaguchi, H. et al. 2014, ApJ, 785, L27
- Young (2004) Young, T. R. 2004, ApJ, 617, 1233
- Zhekov et al. (2009) Zhekov, S. A., McCray, R., Dewey, D., Canizares, C. R., Borkowski, K. J., Burrows, D. N., & Park, S. 2009, ApJ, 692, 1190
Appendix A Effect of radioactive heating during the remnant expansion
The 3D hydrodynamic simulations describing the evolution of the SNR and its interaction with the inhomogeneous CSM do not include a heating term due to decays of radioactive isotopes synthesized in the SN explosion (e.g. 56Co or 44Ti). To check the validity of our assumption, we used our 1D relativistic radiation hydrodynamic code (which includes the radioactive heating term; see Sect. 2.1), to extend run SN-M17-E1.2-N8, simulating the post-explosion evolution of the SN, and covering the first year of evolution. Then we compared the radial profiles of mass density and velocity of ejecta derived in this case at yr with the angle-averaged radial profiles of density and velocity derived at the same epoch with our 3D hydrodynamic model (not including the radioactive heating). Fig. 11 shows some differences in the density profiles that are mainly due to the effect of ejecta clumping considered only in the 3D simulation. On the other hand, the two velocity profiles are very similar suggesting that the effect of radioactive heating does not affect too much the dynamics of the ejecta. This result suggests that we can safely neglect the effect of radioactive heating during the interaction of the remnant with the surrounding nebula.

Appendix B The data analysis
We present new results of the analysis of different observations of the remnant of SN 1987A performed with the ASCA, XMM-Newton, and Chandra X-ray telescopes. We adopted Xselect V2.4, CIAO V4.6.1, and SAS V13 for the reduction of ASCA/SIS, XMM-Newton/EPIC, and Chandra/ACIS data, respectively. All the spectra were analyzed with XSPEC V12.8.2.
B.1. ASCA data
We analyzed the ASCA observations ID 55039000 (performed on November 1997), 56041000 (November 1998), and 57034000 (November 1999), to derive the X-ray unabsorbed fluxes in the keV and keV bands, shown in Fig. 5. We screened the data according to the standard screening criteria and we added the screened SIS0 and SIS1 spectra by using the ADDASCASPEC task. We verified that the spectra extracted from observations 55039000 and 56041000 were consistent with each other, considering the relatively low signal-to-noise ratio of the early observations of SN 1987A. We then fitted the SIS spectra extracted from observations 55039000 and 56041000 simultaneously. For each spectrum, we subtracted a background spectrum extracted from a nearby region immediately outside of the supernova remnant (SNR) shell and we verified that the best-fit values do not depend significantly on the choice of the background region. Spectra were modeled by an absorbed (TBABS model in XSPEC) optically thin plasma in non-equilibrium of ionization (VNEI model). In the fittings, the plasma chemical abundances were fixed to the values derived from the analysis of deep Chandra/LETG and HETG observations of SN 1987A (Zhekov et al. 2009), while the interstellar column density was fixed to (Park et al. 2006) cm-2. Our best-fit models provide a good description of the spectra ( with 47 d.o.f. for the 1997 and 1998 spectra, and with 29 d.o.f. for the 1999 spectrum) and the best-fit temperatures and ionization timescales are keV, s cm-3 for the 1997 and 1998 spectra and keV, s cm-3 for the 1999 spectrum.
B.2. XMM-Newton data
As for the XMM-Newton data, we analyzed observation ID 0083250101 (performed on April 2001) and the previously unpublished observation ID 0690510101 (performed on December 2012). We focussed on the EPIC data and we selected events with PATTERN for the MOS cameras, PATTERN4 for the pn camera, and FLAG=0 for both. We screened the original event files by using the sigma-clipping algorithm (ESPFILT tasks). The pn spectra extracted from the 20012012 observations are shown in the uppermiddle panels of Fig. 6. To derive the keV and keV fluxes of the 2012 observation, we fitted the pn and MOS spectra simultaneously (we selected a circular extraction region with radius ) in the keV energy band. We adopted a model including three components of optically thin plasma in non-equilibrium of ionization (NEI), widely used (Maggi et al. 2012) to describe the latest X-ray observations of SN 1987A. Again we fixed the interstellar column density (Park et al. 2006) to cm-2. The chemical abundances were fixed to the values derived in previous studies (Zhekov et al. 2009) for all the three components. The best-fit temperatures are keV, keV, and keV, while the corresponding ionization timescales are s cm-3, s cm-3, and s cm-3. The presence of a component with a s cm-3 (in our case, component 2) indicates that part of the X-ray emitting plasma has reached the collisional ionization equilibrium and is in agreement with previous findings (Helder et al. 2013). We point out that these models only provide heuristic (phenomenological) descriptions of the spectra, whose physical origin can be unveiled only by accurate hydrodynamic modeling (see Section 3.2).
B.3. Chandra data
Finally, we analyzed the Chandra/ACIS observation 1967 (performed on December 2000) and the previously unpublished observation 14697 (March 2013) to produce the X-ray images shown in Fig. 4 (lower panels). To study the morphology of SN 1987A from the observations, we carefully followed the procedure described in the literature (Burrows et al. 2000; Park et al. 2002). The ACIS data were deconvolved with a maximum likelihood algorithm (with 25 iterations; Richardson 1972; Lucy 1974), using an on-axis point-spread function produced by the MARX simulation package. The high photon statistics allowed us to use pixels for the deconvolution process. The deconvolved images were finally smoothed with a Gaussian with .