Excitation and dynamics in the extended bose-hubbard model
Abstract
The one-dimensional extended bosonic Hubbard model has been shown to exhibit a variety of phases ranging from Mott insulator and superfluid to exotic supersolids and Haldane insulators depending on the filling and the relative value of the contact () and near neighbor () interaction strengths. In this paper we use the density matrix renormalization group and the time evolving block decimation numerical methods to study in detail the dynamics and excitation spectra of this model in its various phases. In particular, we study in detail the behavior of the charge and neutral gaps which characterize the Mott, charge density and Haldane insulating phases. We also show that in addition to the gapless modes at , the supersolid phase exhibits gapless modes at a finite which depends on the filling.
I Introduction
The bosonic Hubbard model (BHM) has continued to attract interest since its introduction by Fisher et al. fisher89 . This interest stems from its use to understand many physical phenomena such as the effect of disorder on superfluids and the appearance of the compressible Bose glass phase fisher89 , quantum phase transitions between strongly correlated exotic phases etc. Interest in the BHM intensified with the experimental realization of Bose-Einstein condensates and the ability to load them in optical lattices greiner02 . Under experimentally realizable conditions, these systems are described by the BHM and its extensions jaksch99 with highly tunable parameters and in one, two and three dimensions which makes them ideal for studying quantum phase transitions and exotic phases in strongly correlated systems.
Increasingly, over the last several years, the physics of strongly correlated quantum systems has focused on the existence and properties of unconventional phases and phase transitions. In addition to well studied Mott insulating behavior caused by strong on-site repulsion at commensurate filling, extensive quantum Monte Carlo (QMC) simulations have shown that a strong enough near neighbor repulsion can lead to insulating incompressible density wave order (CDW) at integer and half odd integer fillings. Topological phases, such as the Haldane insulator which is a gapped phase characterized by a non-local (string) order parameter haldane83 ; dennijs89 can be also found in the extended BHM altman06 ; altman08 ; batrouni13 in one dimension. Finally, doping these phases can lead to phase separation or to supersolid (SS) phases batrouni14 ; batrouni95 ; batrouni00 ; goral02 ; wessel05 ; boninsegni05 ; sengupta05 ; otterlo05 ; batrouni06 ; yi07 ; suzuki07 ; dang08 ; pollet10 ; capogrosso10 .
Even though the phase diagram of the extended BHM is now well understood, the excitation spectra of the various ground states have been less studied jolicoeur93 ; kuhner00 , essentially because the numerical methods providing the ground state properties, such as exact diagonalization or QMC, become limited in the dynamical domain. More recently, for quasi-1D systems, the extension of the density matrix renormalization group method (DMRG) to the time domain or, equivalently, the time evolving density matrix method (TEBD) have proved to be extremely successful in probing the dynamical properties of the system, thereby providing reliable excitation spectrum alps ; tebd-vidal ; Schollwock_review . In this paper, we extend our work in batrouni13 ; batrouni14 to study the excitation spectrum of the one dimensional extended BHM in different phases, namely the Mott insulating phase (MI), the Haldane insulating phase (HI), the charge density wave phase (CDW) and the supersolid phase (SS).
The paper is organized as follows. In section II we present the model and the various methods to compute the ground state properties and excitation spectrum. In section III, we present the dependence of the dynamical structure factor on the near neighbor repulsion, , at fixed filling, , and fixed value of the contact repulsion, and hopping, . In section IV, we study the dynamical structure factor in the SS phase for different fillings and explain its main properties using a mapping of the extended BHM to the Heisenberg model for a spin 1/2 chain in a finite magnetic field. In addition, we describe the evolution of the spectrum across the SS-SF transition. In section V, we discuss the qualitative differences found in the dynamical structure factor in the phase which is obtained by underdoping the half-filled CDW and in the SS phase. A summary of results and conclusions is in section VI.
II Model and methods
II.1 The model Hamiltonian
The one dimensional extended BHM we shall study is described by the Hamiltonian,
| (1) | |||||
The sum over extends over the sites of the lattice, periodic boundary conditions were used in the QMC simulations sgf and open conditions in the DMRG and the TEBD simulations. The onsite repulsive interaction energy, , is put equal to unity and sets the energy scale. The time scale being given by , it is also put equal to unity. The operator () destroys (creates) a boson on site , is the number operator on site , is the hopping amplitude and is the near neighbor repulsive interaction parameter. Since we will typically study the system in the canonical ensemble, we did not include a chemical potential term in .
The charge gap is given by,
| (2) | |||||
| (3) |
where the chemical potential is given by and is the ground state energy of the system with particles and is obtained both with QMC and DMRG. The neutral gap, , is obtained using DMRG by targeting the lowest excitation with the same number of bosons. For the CDW and HI phases, the chemical potentials at both ends are set to (opposite) large enough values, when using DMRG, such that the ground state degeneracy and the low energy edge excitations are lifted kuhner00 ; altman06 ; rossini12 ; batrouni13 .
For a bosonic filling close to unity, the Bose-Hubbard model can be reasonably approximated by the AF spin-1 Heisenberg model:
| (4) |
where is the axial anisotropy and the ion anisotropy. One has the following mapping between the parameters altman08 : , and .
II.2 Time Evolving Block Decimation
As mentioned above, the excitation spectra are obtained using the TEBD, first in imaginary time to obtain the ground state, then in real time to compute the density-density correlation function. In each case, we have used a number preserving algorithm. We have checked that the ground state properties (energy, site density, double occupancy…) obtained with the TEBD exactly match the properties of the ground state obtained from the DMRG, using the ALPS library alps . The space and time correlation functions , where is the ground state average and where is the time evolution of the operator in the Heisenberg picture, have been obtained by writing,
| (5) |
where is the ground state energy. Therefore, computing the correlation function can be done as follows:
-
•
From the matrix product state (MPS) representation of the ground state, , one computes the MPS of the initial state .
-
•
The state is evolved using the real time TEBD, providing the MPS of , and thereby allowing the computation of the correlation function as .
In what follows, we focus on the density-density correlation, i.e. , more precisely, the initial state consists of creating a density excitation in the middle of the chain: with . We then compute for all sites and times up to , with a time step equal to (a smaller timestep was actually used for the propagation). Finally, the dynamical structure factor is computed from the Fourier transform of the density-density correlation with respect to and . In order to smooth out oscillations caused by the finite time window, we actually compute the Fourier transform of .
III Mott-Haldane-CDW transitions
The qualitative description of the different phases is based on the Heisenberg model EQ.(4). More precisely, the phases are characterized by the values of the string order parameters:
| (6) |
characterizing a loose antiferromagnetic order along the different axes . They are associated with an underlying non-local discrete symmetry of the Heisenberg model, Eq.(4) Affleck87 . In the large- phase (the MI state for bosons), the vanish. In the Haldane phase, the two discrete symmetries are broken, resulting in nonvanishing string order . Finally, in the Ising phase (the CDW for bosons), only the symmetry along the -axis is broken such that only the string order is non-vanishing. Note that in that phase, the string order and the antiferromagnetic order (the CDW order for bosons) are equivalent Oshikawa92 .
The lowest elementary excitations from the ground state (, ) are part of a triplet, one neutral (,), two charge ones () jolicoeur93 ; fath93 , where corresponds to change in the total number of bosons. In each sector, one defines a gap which corresponds to the minimum of the elementary excitations over all values: and .
The minima are located either at or . From linear response theory, the structure factor reads
| (7) |
where denotes the different excited states of for a given momentum , and the corresponding energy. For single excitations, one simply has . Doubly excited states for fixed are made of two single excitations: , corresponding to an energy .
By definition, the charge gap of the system is , i.e. the minimum energy for adding a particle plus the minimum energy for removing a particle (increasing or decreasing , in the Heisenberg model). The neutral gap corresponds to the minimum of either the elementary neutral excitations, i.e. , or of , i.e., a combination of two charge excitations. Since, the minimum of both the elementary charge excitation is attained at either or , the minimum of the two-particle excitation necessarily takes place at and has the value , and corresponds then to the lower bound of a two-particle continuum. In short, the neutral gap value is given by the minimum of and .

It is well-known that in the Haldane phase, the neutral gap changes from one type to the other jolicoeur93 ; fath93 ; altman06 and is emphasized in Fig. 1, where around , the neutral and the charge gaps start having different values. For lower values, one has , whereas for larger values, one has . This results from the fact that, in the Haldane phase, the elementary excitations are all gapped, with a minimum occuring at jolicoeur93 ; fath93 . For a fixed value of , corresponding to a fixed value of the ion anisotropy, , in the corresponding spin Hamiltonian, increases with increasing (i.e. ), whereas decreases. This can be understood by starting at the Heisenberg point, (, ), where, due to invariance of the spin Hamiltonian, all single particle excitation energies are the same, so that . Increasing the ion anisotropy, , i.e. going toward the Mott Phase (or decreasing ) gives rise to a smaller in-plane gap (i.e. the elementary charge gap) .
This evolution of the neutral and charge gaps can be seen in the behavior of the structure factor . We emphasize that even though the structure factor is a neutral excitation, i.e. conserves the total number of bosons, it also couples to the two-particle continuum composed of elementary charge excitations . As explained above, in the limit , the minimum energy corresponds to the charge gap , such that even if we expect to vanish at , the value for can be obtained by extrapolating the behavior of around .
In the Mott phase, top Fig. 2, one can clearly see that the gap at is much larger than the gap at . Note that the gap differs from , since, in the MI phase, is minimum at and maximum at . The neutral and the charge gap have the same value , which can be obtained from by extrapolating the gap value to . At the Mott-Haldane transition, bottom Fig. 2, exhibits (almost) gapless excitation around , whereas the excitation is cleary gapped at . Since the transition corresponds to breaking both hidden symmetries, both the neutral and the charge gaps vanish, corresponding to vanishing elementary charge excitations gap , but a finite elementary neutral excitation gap .
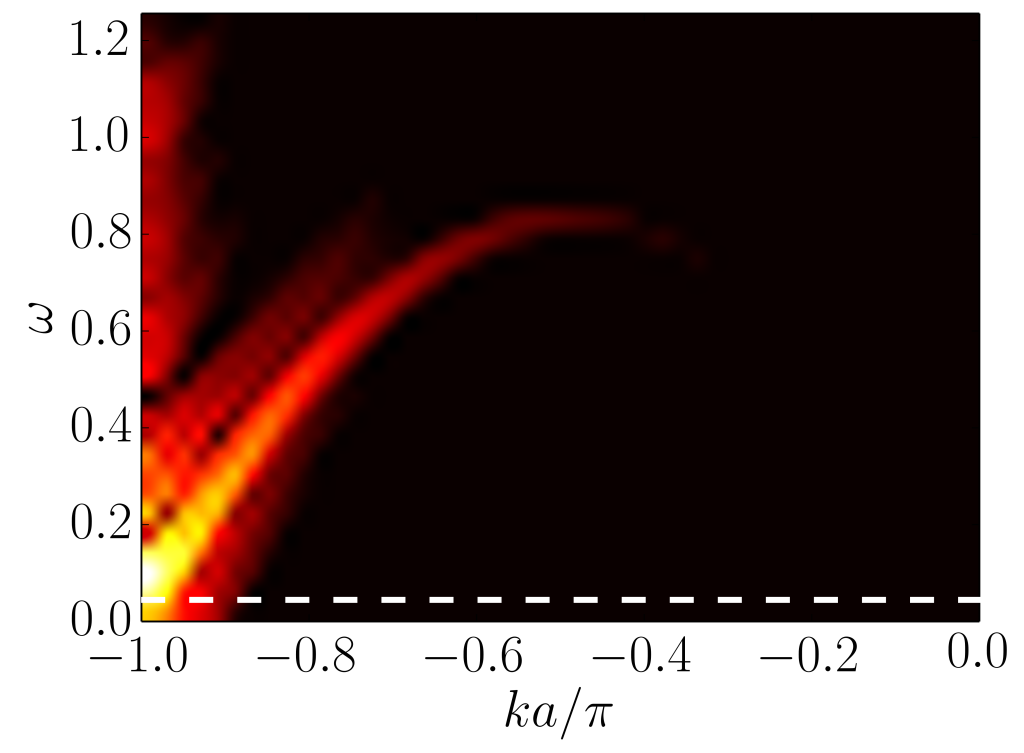
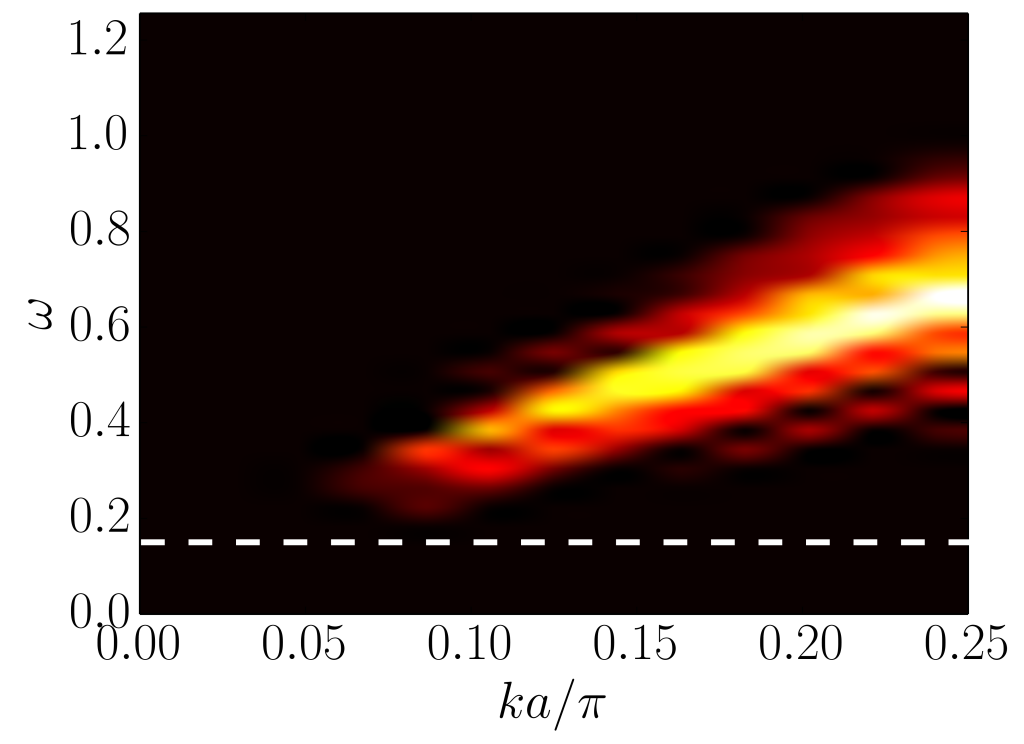
Inside the Haldane phase, but for a value , top Fig. 3, we see that the gap at , i.e. , has decreased whereas the gap at , i.e. , is non vanishing. At the value , middle Fig. 3, the gap at , , has almost the same value as the gap at , . When , bottom Fig. 3, we see that one is now in the opposite situation: is clearly smaller than .
At the transition between the Haldane phase and the charge density wave phase, top Fig. 4, vanishes while the charge gap at , remains finite. This corresponds to the fact that across the transition, the hidden symmetry along the -axis remains broken, whereas the hidden symmetry along in the plane is restored. Since the string order is broken by charge excitations but left invariant under neutral excitations, i.e. commutes with the operators, only the charge gap is protected by the finite value of the order and remains finite at the transition. On the other hand, since the string order , which is broken by neutral excitations (i.e. applying ), vanishes at the transition, the neutral gap has to close at the transition.
Finally, in the CDW phase, bottom Fig. 4 both the neutral and the charge gap increase, but still having .
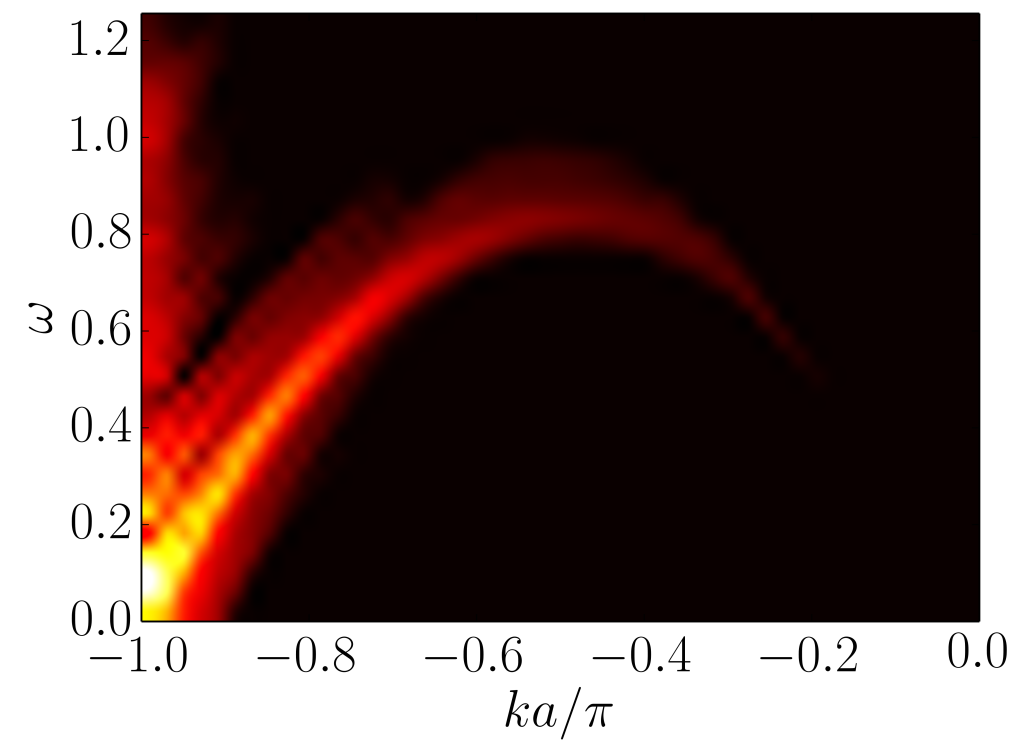
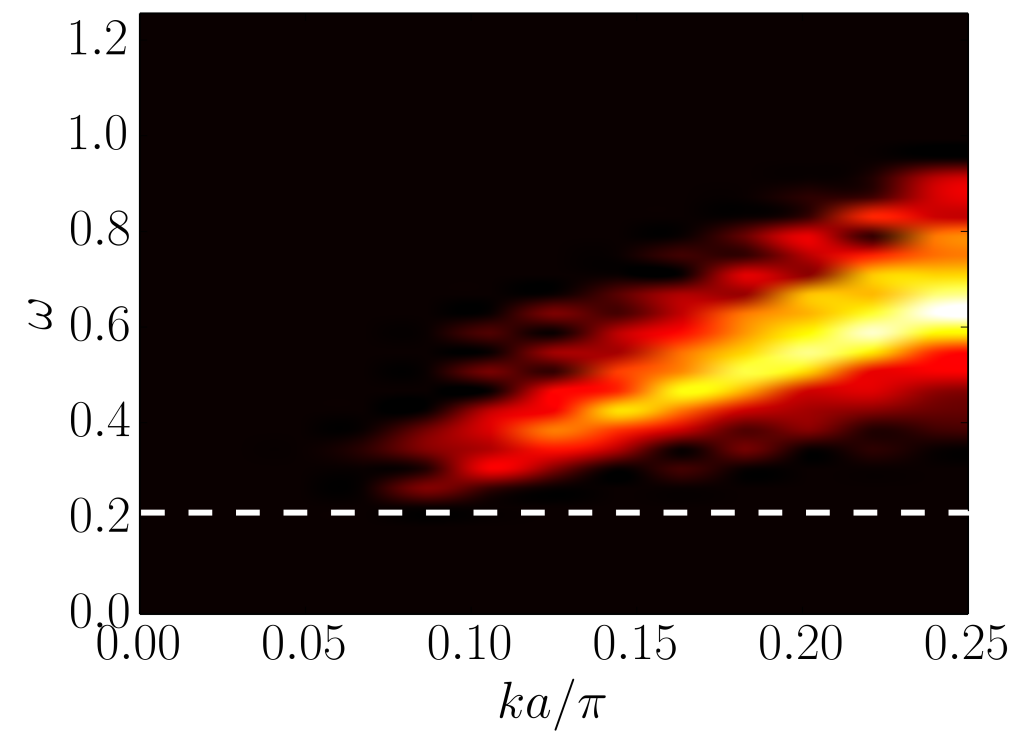
Finally, in Fig. 5, we show the excitation spectrum when adding a boson to the system, i.e. corresponding to the operators and in Eq. (5). In both plots, the large vertical offset corresponds to the chemical potential for adding a boson, . By definition, the value of the charge gap is , where is the chemical potential for removing a boson. Therefore the minimum of the excitation spectrum can be written , where is the average chemical potential. The parameters for the top plot are the same as in Fig. 2 (top panels), i.e. the Mott Phase. One clearly sees that the minimum of the charge excitation is obtained at , the value at being much larger. The bottom plot corresponds to bottom panels Fig. 3, i.e. the Haldane phase where the neutral and charge gaps are different. The minimum of the excitation occurs at , whereas around , one has a two-particle continuum, made of one neutral excitation and one charge excitation, the minimum value, at , being , i.e. .


IV Supersolid phase
The hallmark of the supersolid phase is the presence of both a long range diagonal (density) order and superfluidity. A typical density profile, obtained using DMRG for , and , is shown in Fig. 6. The oscillations of the density between and , around the average value signal long range density order but which, nonetheless, is not in the CDW phase since the average density, , is not commensurate.

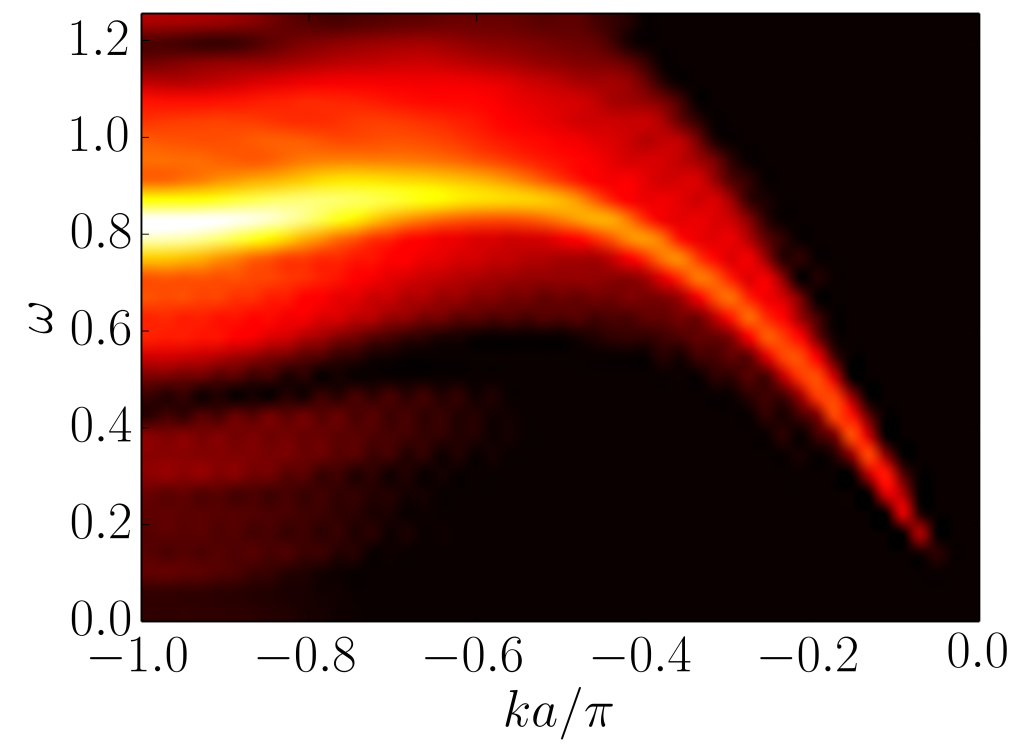
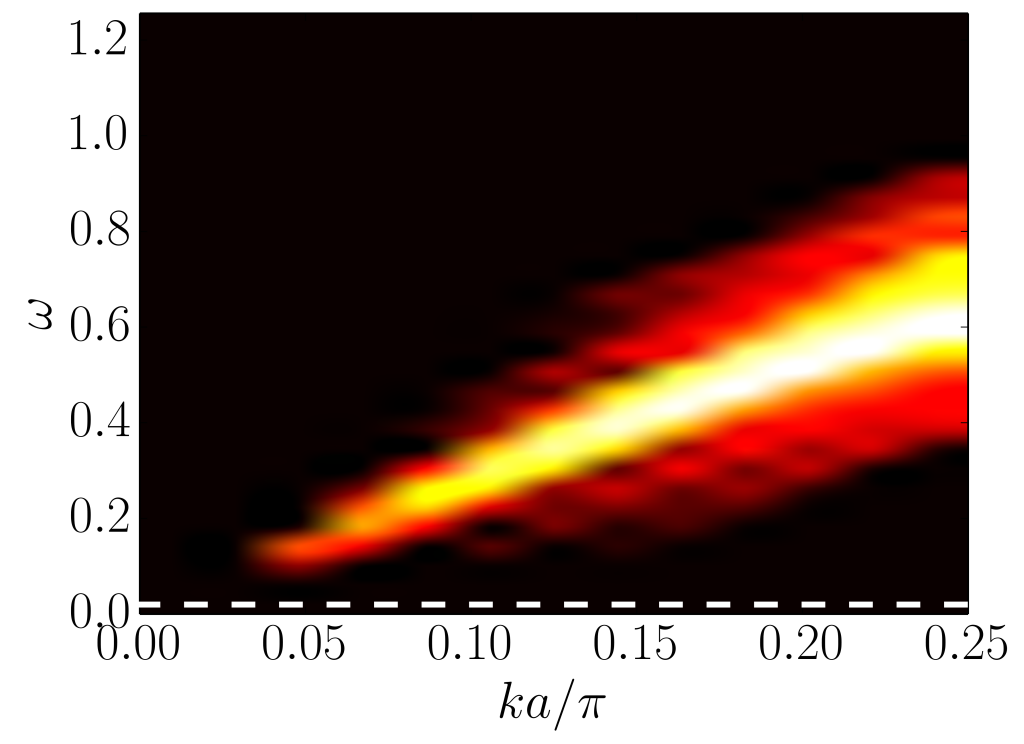
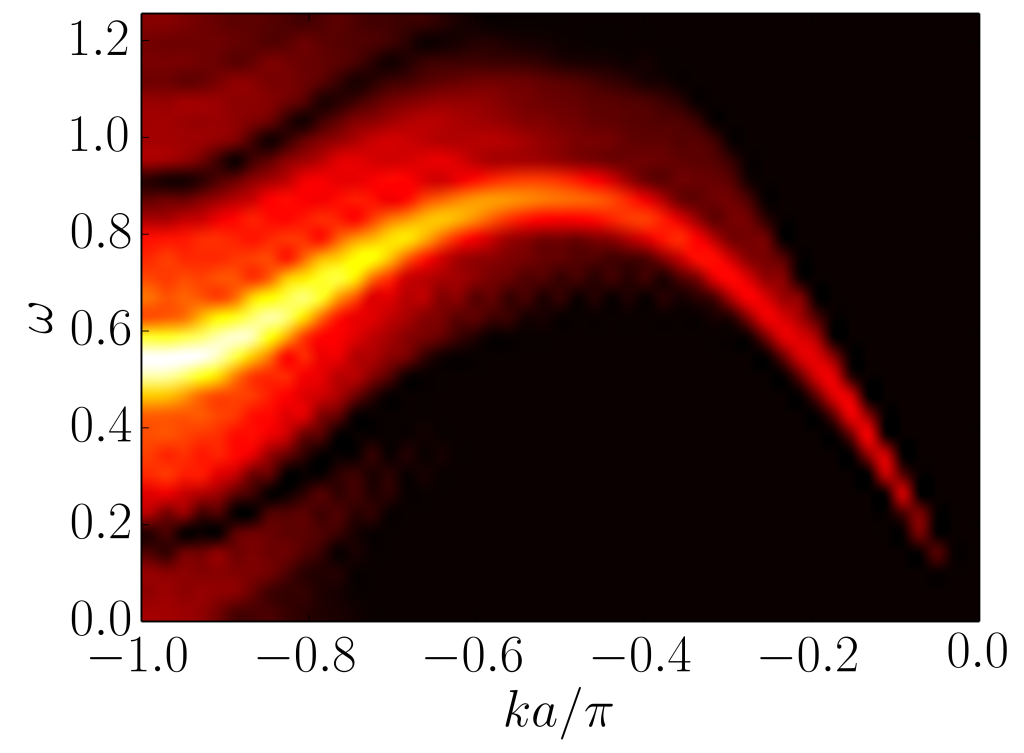
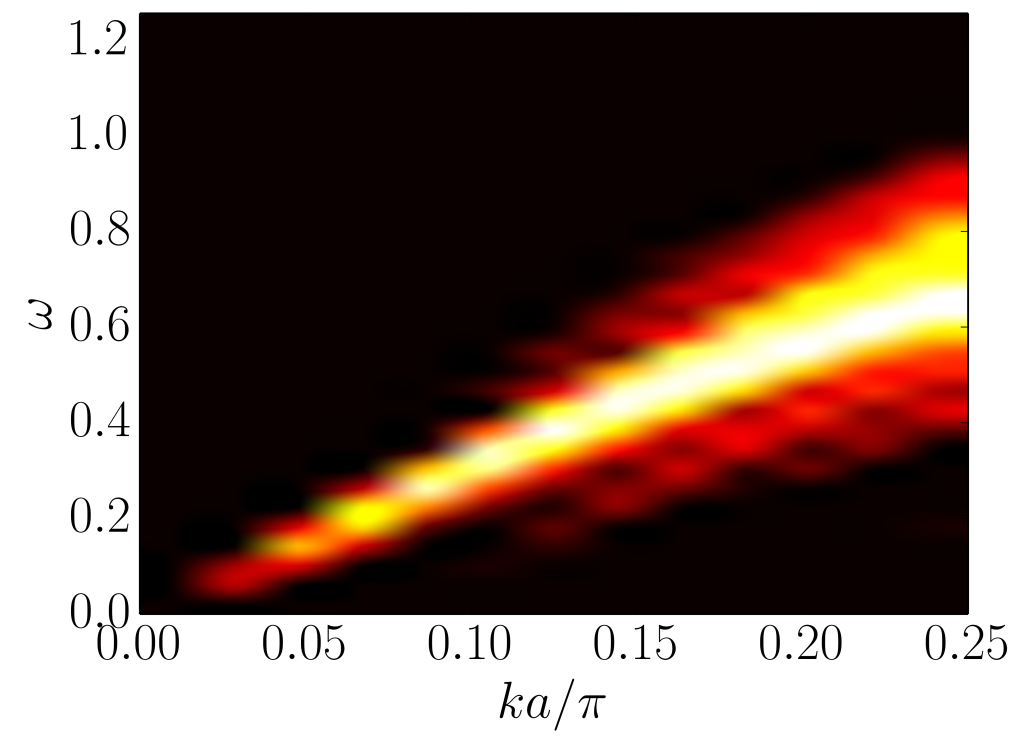
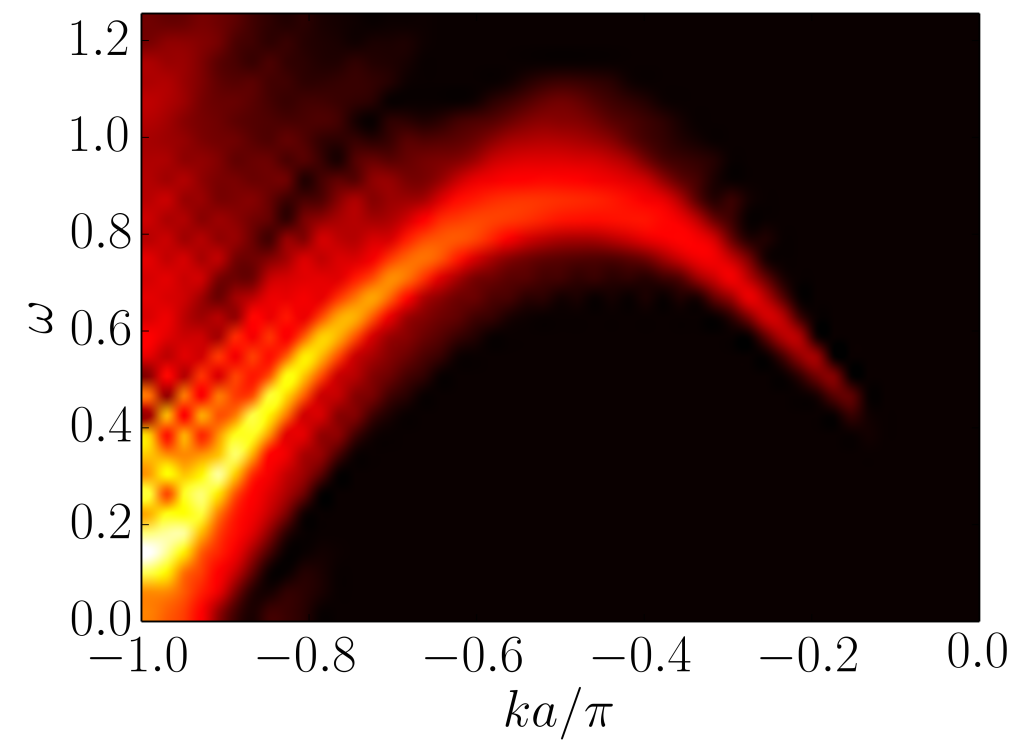
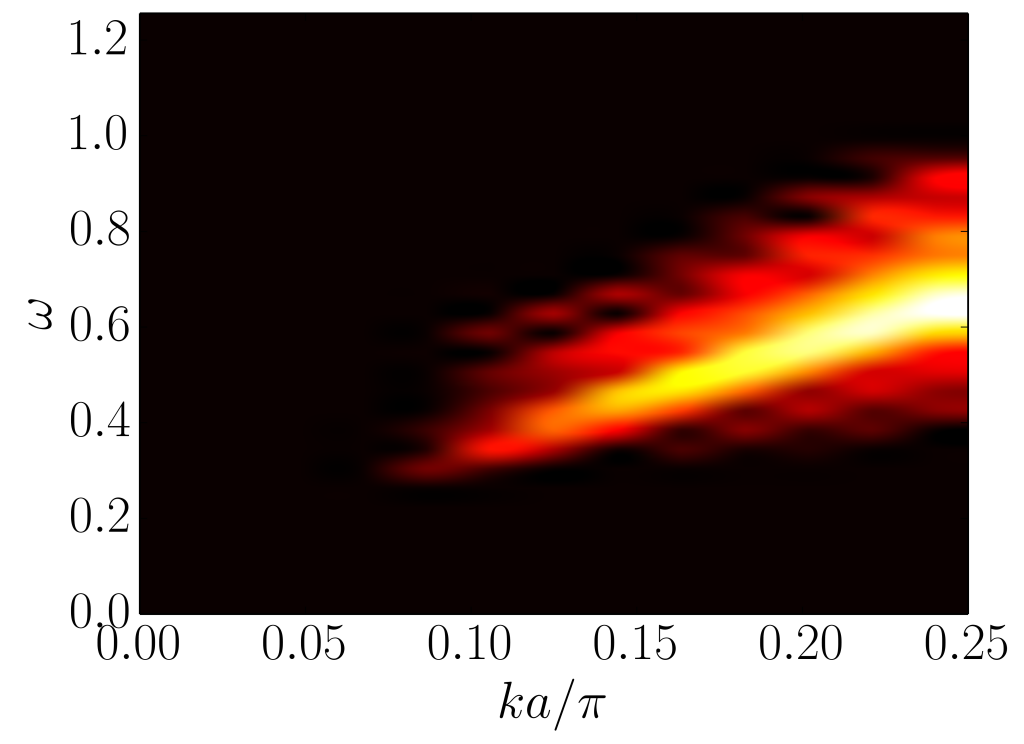
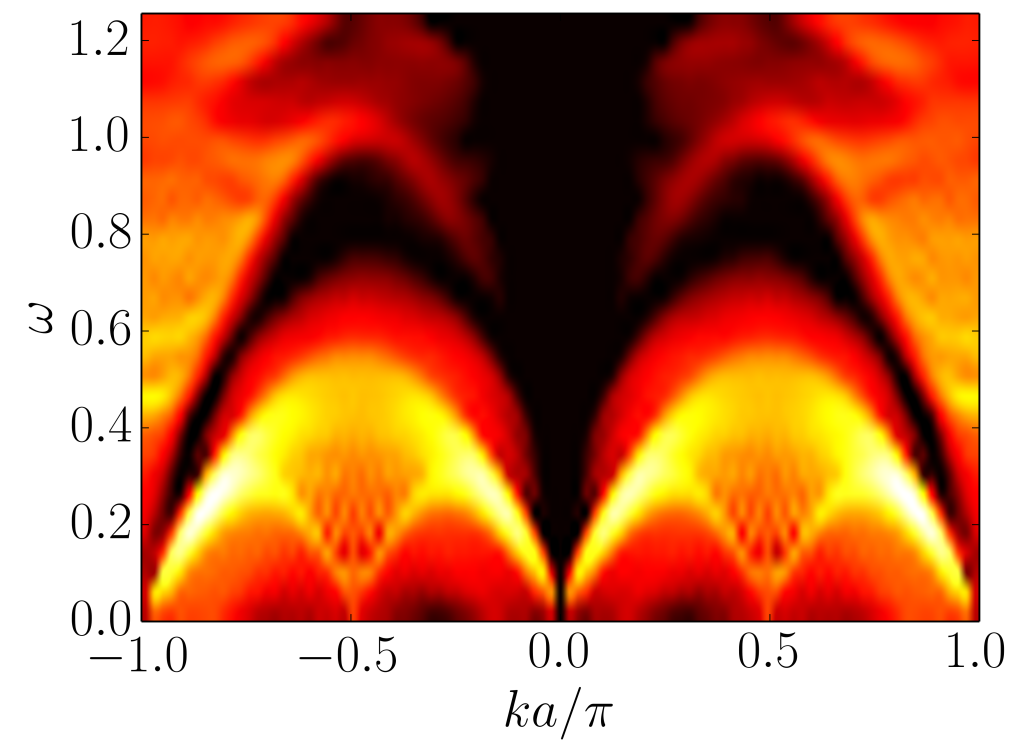
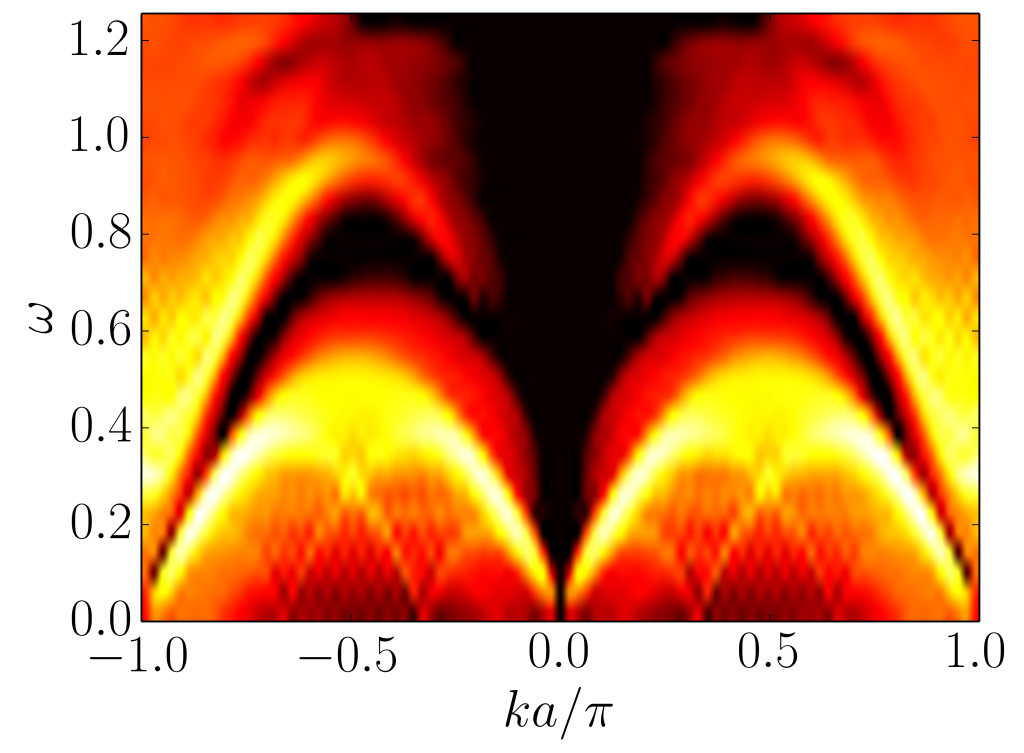
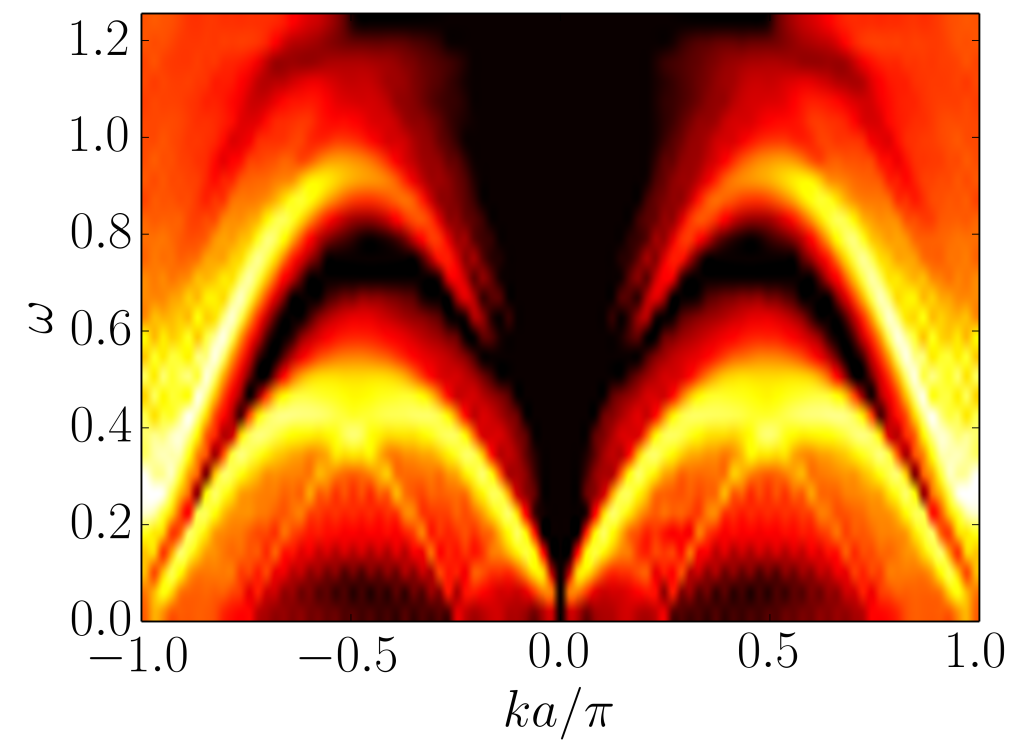
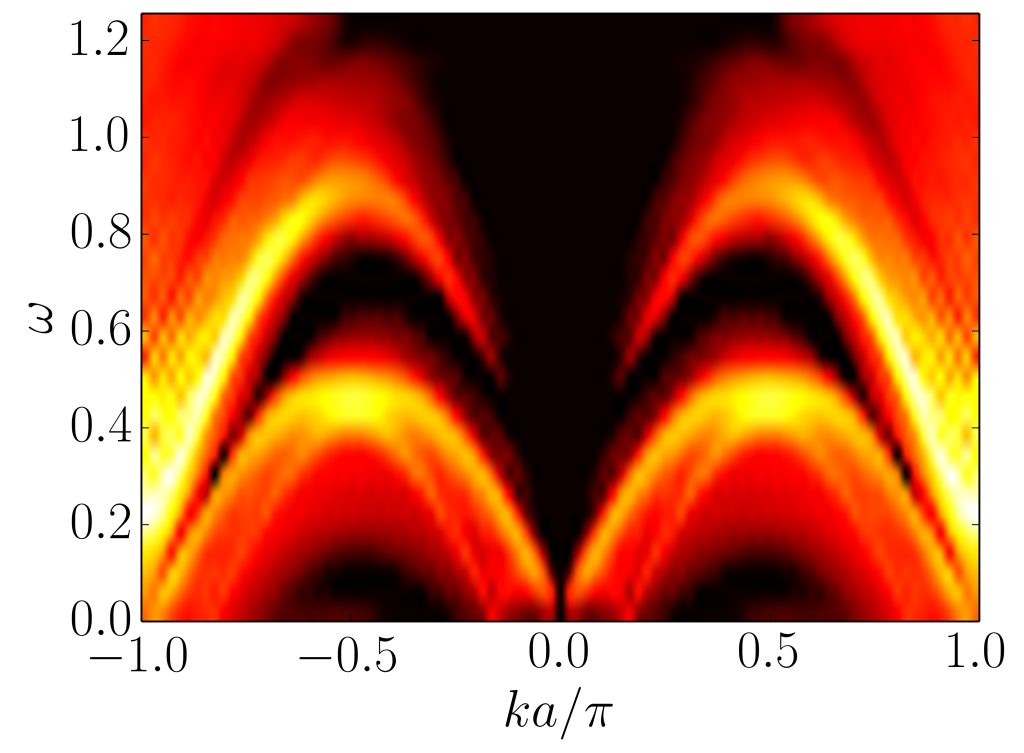
Figures 7, 8, 9 and 10 show the the dispersion for several values of the doping: , , and respectively. All data were obtained for sites, , , and the system is in the supersolid phase.
As expected in the supersolid phase, the system exhibits gapless excitations at and , but one clearly sees additional gapless excitations at a momentum that depends on the density. It turns out that the value of is in excellent agreement with the value (see below), where , i.e. (, , ) for (, , ).
IV.1 Effective Spin- Heisenberg model of the supersolid
We consider the situation where the supersolid phase has a density , see Fig. 6. This occurs when one dopes the system in the CDW phase, i.e. for . The density pattern, in the limit , obtained from both the DMRG and the QMC computations show that the ground state has a (nearly) vanishing density on alternate sites and that the other states are (almost) built on either the or Fock states. We, therefore, expect the low energy excitation to be given by an effective spin-1/2 Heisenberg model, where we map () to (), and remove the state with vanishing density. The new chain has therefore an effective lattice spacing equal to . The effective interaction arises from the virtual hopping of the bosons to the empty sites. Taking into account the different intermediate states, one obtains the following effective spin-half Heisenberg hamiltonian:
| (8) |
where
| (9) | ||||
where . is positive for a large range of values, so that the preceding Hamiltonian corresponds essentially the AF spin-half Heisenberg model in a magnetic field (the negative sign of can be removed through the mapping ).
Defining the ratio , one obtains:
| (10) | ||||
For , the system is in the () phase when , () 1dmagnetism ; Giamarchibook . From the preceding expressions, the ratio starts from the value at and then decreases. The isotropic point is crossed around , such that for , i.e. , the system is the phase. The ground state has therefore a vanishing magnetization, corresponding to an average density . For , this corresponds to , i.e. to the boundary between the and CDW. Then, for any finite , the average magnetization is positive (negative) corresponding to an average density larger (less) than . In addition, the effective spin correlations exhibit spatial oscillations whose period depends on the magnetization, which, in turn, leads to gapless excitations at finite momentum. More precisely, starting from the correlation functions of the spin-1/2 chain obtained using the bosonisation approach Giamarchibook and taking into account that is negative and that the lattice spacing is , one can show that both the in-plane () and the out-of-plane () correlations yield oscillations corresponding to a wavevector , where is the magnetization. The latter is related to the average density of the Bose-Hubbard model: , such that , where . Therefore, the gapless excitations correspond to , in perfect agreement with Figs. 7, 8, 9 and 10.
IV.2 SS-SF transition
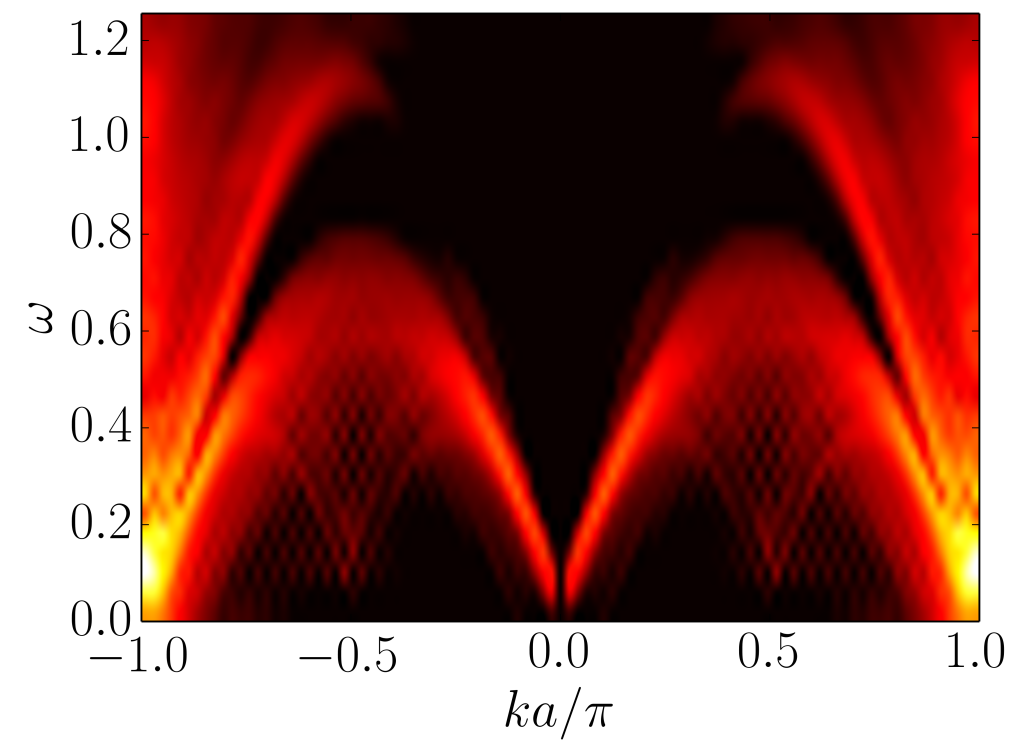
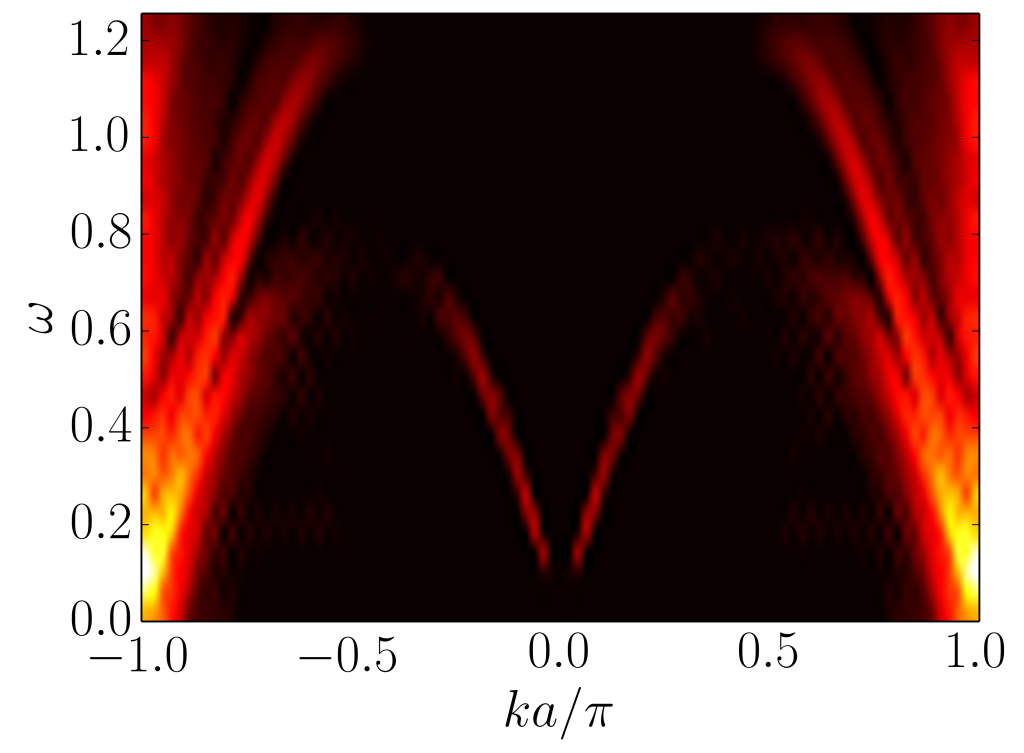
We have also studied the evolution of the structure factor across the supersolid-superfluid transition, at fixed density and interaction strengths, increasing the hopping amplitude from (SS) to (SF).
IV.2.1 TEBD results
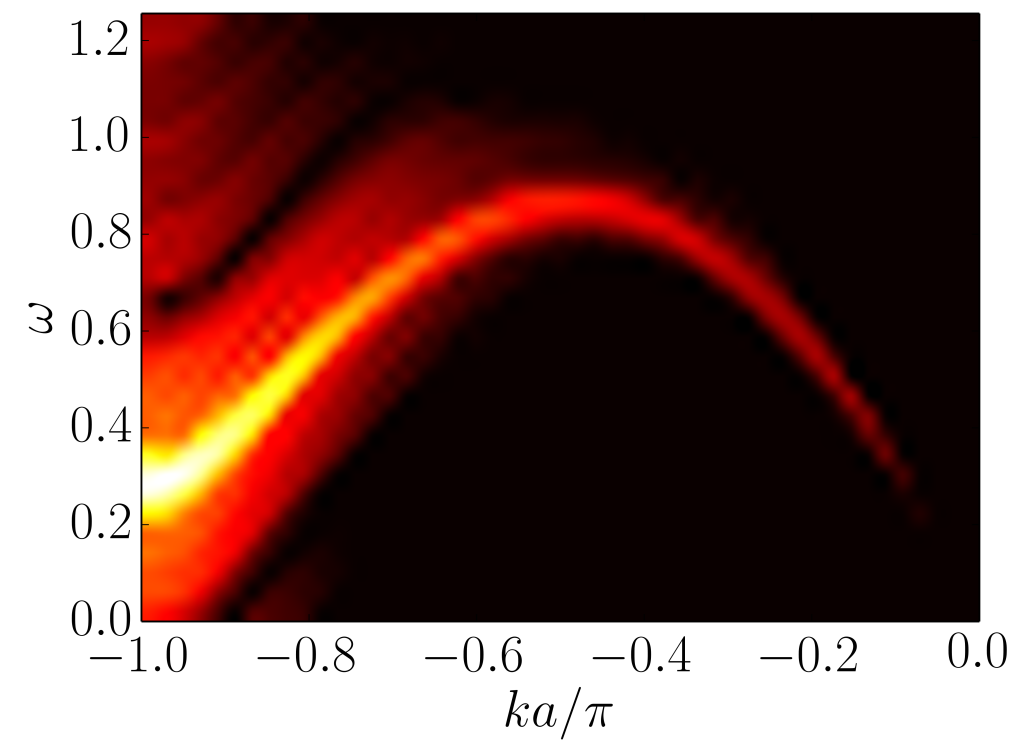
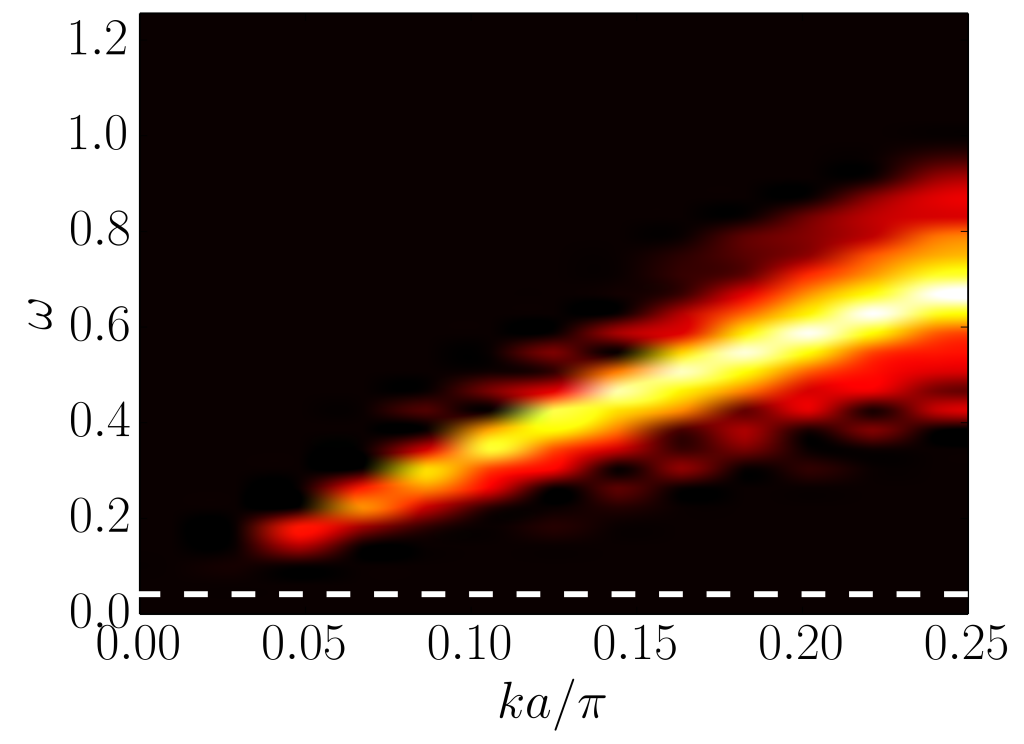
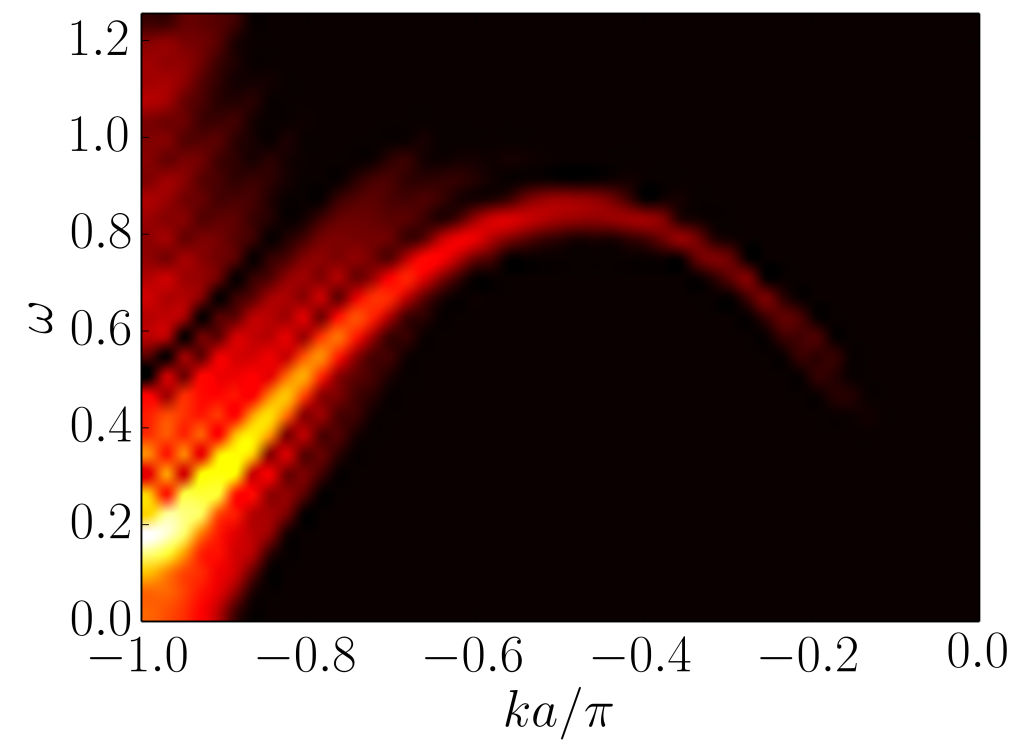
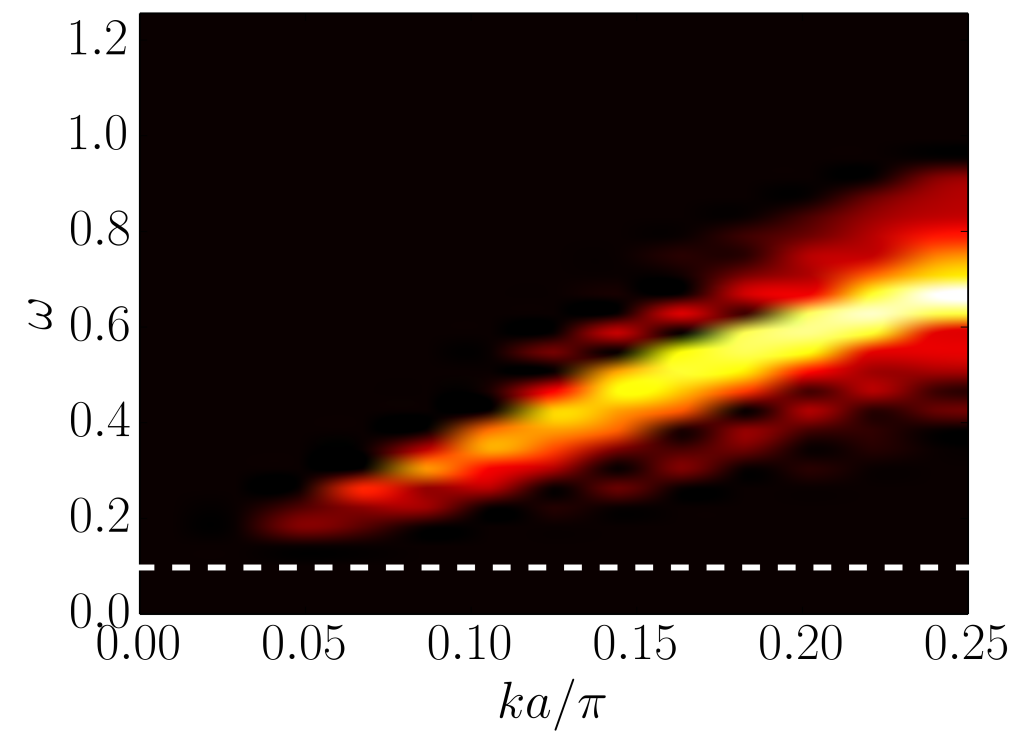
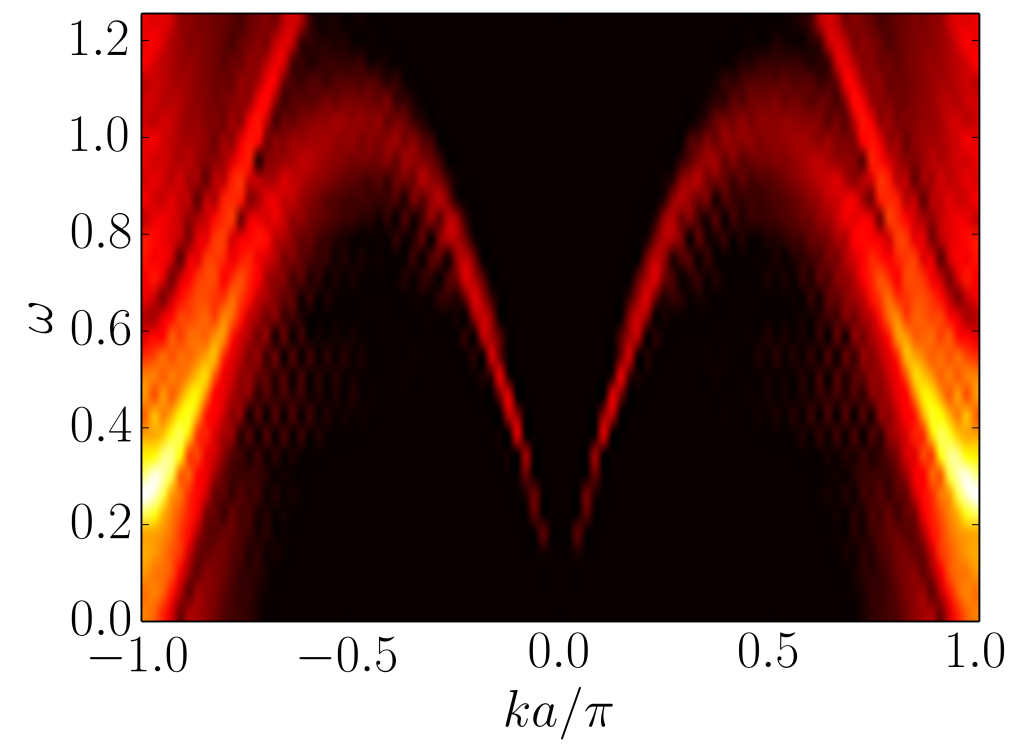
From the density plots, see Fig. 11 (top), Fig. 12 (top) and Fig. 13 (top), we see that the SS-SF transition is driven by the disappearance of the spatial modulation. This behavior is also predicted by the standard mean-field theory where the ground state of the system is assumed to be a tensor product of onsite wavefunctions (see below).
The disappearance of the spatial modulation results in an opening of the gap at , see Fig. 13 (bottom), which is well described by the mean-field theory, since it only amounts to a change of the spatial periodicity, i.e. from to , of the effective Hamiltonian Iskin .
On the other hand this simple mean-field cannot capture the long range quantum correlations that lead to the gapless modes at and the mapping to the spin-1/2 is no longer valid close to the transition since one cannot neglect previously empty sites. From that point of view, the exact fate of these gapless mode is still lacking a physical explanation.



IV.2.2 Mean-field results
As explained above, a well known mean-field method to solve the Bose-Hubbard model is the Gutzwiller ansatz, where the ground state wavefunction is assumed to be a tensor product of onsite wavefunctions:
| (11) |
represents the Fock state of atoms occupying the site , is a cut off in the maximum number of atoms per site, and is the probability amplitude of having the site occupied by atoms.
Minimizing the mean-field energy over the allows us to determine the mean-field ground state properties as functions of the different parameters . For instance, the superfluid phase corresponds to a non vanishing value of the order parameter , whereas the Mott phase corresponds to a vanishing order parameter and the are pure Fock states. In the CDW phase, the order parameter vanishes; the density, and the staggered density, , have the same value. The supersolid phase corresponds to non-vanishing values for both and ; the density still exhibits oscillations at . The superfluid phase corresponds to a homogeneous density and only the order parameter has a non-vanishing value.
We present mean-field results for , and . Note that since the chemical potential is fixed, the density changes as is changed. Figure 14 shows the different quantities as functions of . For , the system is in the CDW insulating phase: The order parameter vanishes and the density and staggered density have the same value; the CDW corresponds to a density pattern . For the system is in the supersolid phase: Both and are non-vanishing. The density still presents oscillations at . For , the system is in the usual superfluid phase.
The mean field approach also allows us to compute the excitation spectrum. Since in both the CDW and SS phases the periodicity of the ground state is , the spectrum is defined in the reduced Brillouin zone and has two branches. In the CDW phase, the elementary excitations are gapped, as expected. In the SS phase, the lower branch becomes gapless with a linear behavior around . At the SS-SF transition, the periodicity of the ground state goes back to , so that the two elementary excitation branches merge at .

V underdoped half-filling CDW
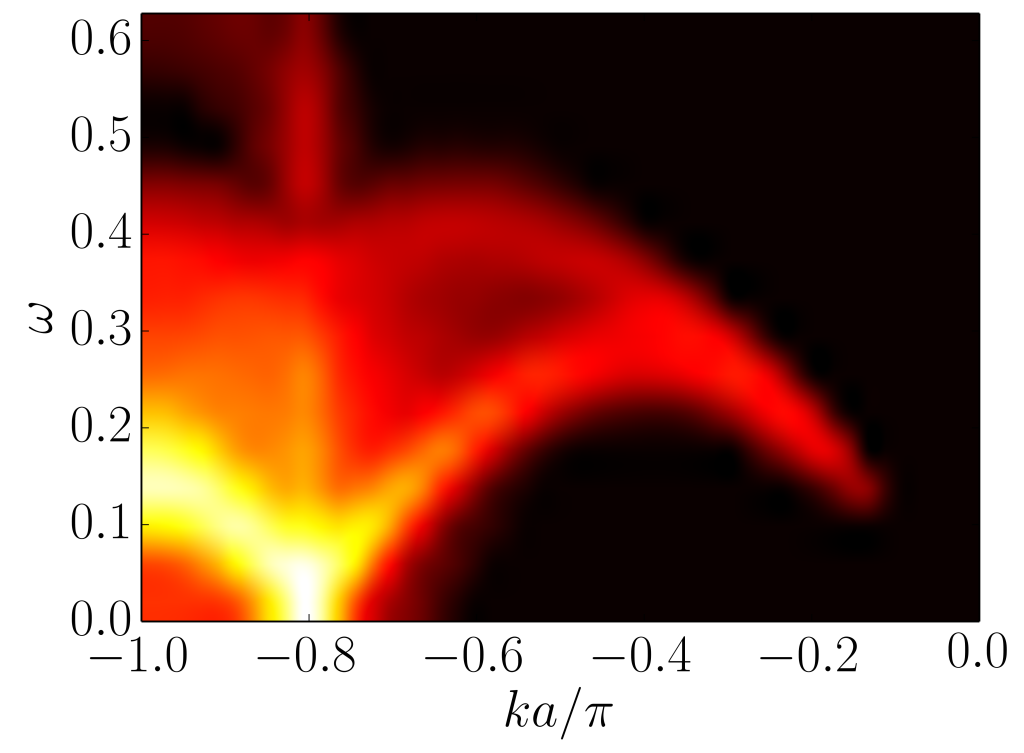
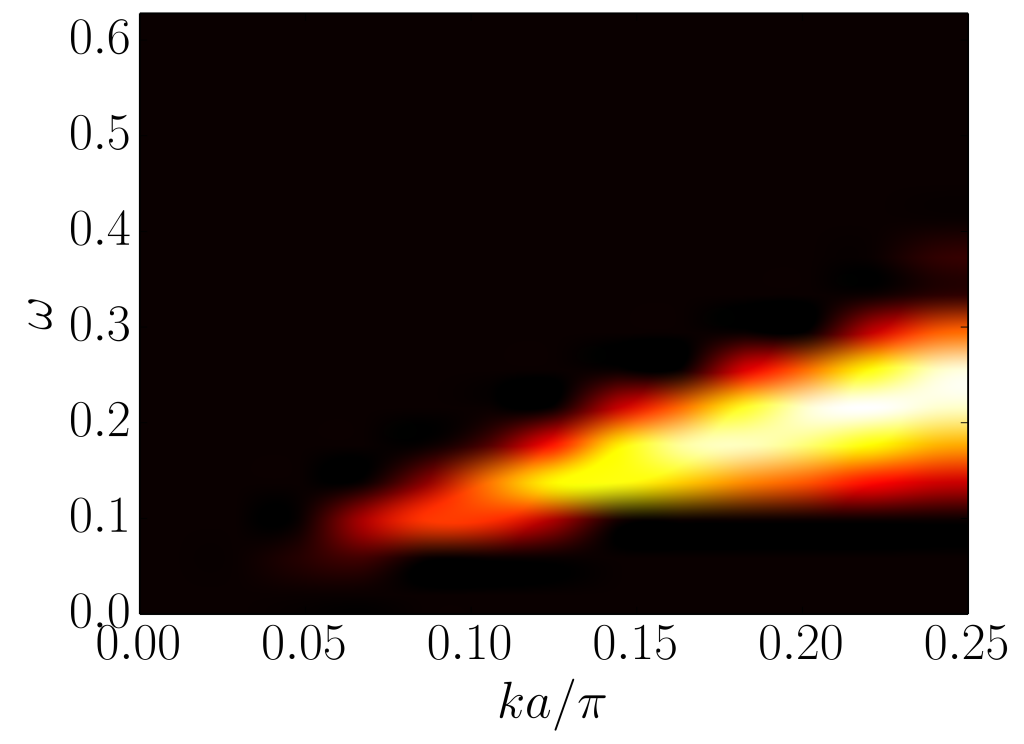
In this section, we compare the structure factor obtained in the SS phase with the one for the phase between the half-filled CDW and the superfluid phase, see Fig. 15. A typical density profile is shown in Fig. 16; the parameters are , and , corresponding to an average density . One clearly sees that the density pattern is different from the one in the supersolid phase: the long wavelength modulation of the CDW is a signature of a vanishing DLRO, in contrast to the SS phase. On the other hand, one has an overall power law decay of the ODLRO , but with a coefficient emphasizing that the SF can be localized with a single impurity kuhner00 . The difference with the SS phase also appears in the structure factor, Fig. 17: One has only two gapless modes, one at and one at , but the excitations at are gapped. Therefore, the periodicity of the lower part of the spectrum is just and not as in the SS phase.
Since, at very low values of , the density pattern for the half-filled CDW phase is , there is a natural mapping onto a spin-half AF Heisenberg model with a vanishing total magnetization: and . The underdoped CDW phase corresponds then to a non vanishing total magnetization . However, contrary to the SS phase, there is no simple way to get the effective and coefficients: the initial state and a state after one hopping are actually degenerate in the limit , thereby preventing a proper expansion of the Bose-Hubbard Hamiltonian. Nevertheless, one can still argue that the gapless mode at corresponds to the incommensurate gapless mode appearing in the spin-spin correlation function for the spin-half AF Heisenberg model in a finite magnetic field. In particular the value is compatible with the bosonisation prediction Giamarchibook .


VI Conclusions
In summary, we have studied the excitation spectra of the extended Bose-Hubbard model. Along, the MI-HI-CDW transition, the dynamical structure factor exhibits behavior similar to the spin-spin correlation for the Heisenberg model. For instance, it shows a difference between the neutral and charge gaps in the HI phase.
In the SS phase, we have shown that the system has additional gapless modes at a value that depends on the average density of the system. They can be mapped to the incommensurate gapless modes of an AF spin-1/2 chain at finite magnetization. They are a signature of the DLRO present in the SS phase. These modes fade away when moving towards the SF phase, and, in addition, a gapped mode appears at , marking the disappearance of the DLRO.
Finally, we have shown that underdoping the CDW at half-filling, the excitation spectrum differs from the one in the SS phase, emphasizing that even though the system exhibits superfluidity and oscillations in the density, there is no DLRO.
Acknowledgements.
The Centre for Quantum Technologies is a Research Centre of Excellence funded by the Ministry of Education and National Research Foundation of Singapore.References
- (1) M.P.A. Fisher, P. B. Weichman, G. Grinstein and D. S. Fisher, Phys. Rev. B40, 546 (1989).
- (2) M. Greiner, O. Mandel, T. Esslinger, T. W. Hänsch and I. Bloch, Nature 415, 39 (2002).
- (3) D. Jaksch, H.-J. Briegel, J. I. Cirac, C. W. Gardiner and P. Zoller, Phys. Rev. Lett. 82, 1975 (1999).
- (4) M. den Nijs and K. Rommelse, Phys. Rev. B40, 4709 (1989).
- (5) F. D. M. Haldane, Phys. Lett. 93A, 464 (1983); Phys. Rev. Lett. 50, 1153 (1983).
- (6) E. G. Dalla Torre, E. Berg and E. Altman, Phys. Rev. Lett. 97, 260401 (2006).
- (7) E. Berg, E. G. Dalla Torre, T. Giamarchi and E. Altman, Phys. Rev. B77, 245119 (2008).
- (8) G.G. Batrouni, R.T. Scalettar, V. G. Rousseau and B. Grémaud, Phys. Rev. Lett. 110, 265303 (2013).
- (9) G. G. Batrouni, V. G. Rousseau, R. T. Scalettar, and B. Grémaud Phys. Rev. B 90, 205123 (2014).
- (10) G. G. Batrouni, R. T. Scalettar, G. T. Zimanyi and A. P. Kampf, Phys. Rev. Lett. 74, 2527 (1995).
- (11) G. G. Batrouni and R. T. Scalettar, Phys. Rev. Lett. 84, 1599 (2000).
- (12) K. Gral, L. Santos and M. Lewenstein, Phys. Rev. Lett. 88, 170406 (2002).
- (13) S. Wessel and M. Troyer, Phys. Rev. Lett. 95, 127205 (2005).
- (14) M. Boninsegni and N. Prokof’ev, Phys. Rev. Lett. 95, 237204 (2005).
- (15) P. Sengupta, L. P. Pryadko, F. Alet, M. Troyer and G. Schmid, Phys. Rev. Lett. 94, 207202 (2006).
- (16) A. van Otterlo, K-H. Wagenblast, R. Baltin, C. Bruder, R. Fazio and G. Schön, Phys. Rev. B52, 16176 (2005).
- (17) G.G. Batrouni, F. Hébert and R.T. Scalettar, Phys. Rev. Lett. 97, 087209 (2006).
- (18) S. Yi, T. Li and C. P. Sun, Phys. Rev. Lett. 98, 260405 (2007).
- (19) T. Suzuki and N. Kawashima, Phys. Rev. B75, 180502(R) (2007).
- (20) L. Dang, M. Boninsegni and L. Pollet, Phys. Rev. B78, 132512 (2008).
- (21) L. Pollet, J. D. Picon, H. P. Büchler and M. Troyer, Phys. Rev. Lett. 104, 125302 (2010).
- (22) B. Capogrosso-Sansone, C. Trefzger, M. Lewenstein, P. Zoller and G. Pupillo, Phys. Rev. Lett. 104, 125301 (2010).
- (23) O. Golinelli, Th. Jolicoeur, and R. Lacaze, J. Phys.: Condens. Matter 5, 1399 (1993).
- (24) T.D. Kühner, S.R. White, and H. Monien, Phys. Rev. B61, 12474 (2000).
- (25) G. Vidal, Phys. Rev. Lett. 91, 147902 (2003);ibid. 93, 040502 (2004).
- (26) U. Schollwock Annals of Physics 326, 96 (2011).
- (27) B. Bauer et al. (ALPS collaboration), J. Stat. Mech. P05001 (2011).
- (28) V.G. Rousseau, Phys. Rev. E77, 056705 (2008); ibid. E78, 056707 (2008); V.G. Rousseau and D. Galanakis, arXiv:1209.0946.
- (29) D. Rossini and R. Fazio, New J. Phys. 14, 065012 (2012).
- (30) I. Affeck, T. Kennedy, E.H. Lieb, and H. Tasaki, Phys. Rev. Lett. 59, 799 (1987).
- (31) T. Kennedy, and H. Tasaki, Commun. Math. Phys. 147, 431 (1992).
- (32) O. Golinelli, Th. Jolicoeur, and R. Lacaze Phys. Rev. B 45, 9798 (1992).
- (33) R. Botet, R. Jullien, and M. Kolb, Phys. Rev. B 28, 3914 (1983).
- (34) M. Oshikawa, J. Phys.: Condens. Matter 4, 7469 (1992).
- (35) G. Fáth and J. Sólyom, J. Phys.: Condens. Matter 5, 8983 (1993).
- (36) H-J. Mikeska, A. Kolezhuk, in Quantum magnetism, edited by U. Schollwöck, J. Richter, D. Farnell, and R. Bishop (Springer Berlin Heidelberg, 2004).
- (37) T. Giamarchi, Quantum Physics in One Dimension, (Oxford Science Publications, 2004).
- (38) M. Iskin, Phys. Rev. A83, 051606(R) (2011).
- (39) R.T. Scalettar, G. G. Batrouni, A.P. Kampf, and G. T. Zimanyi Phys. Rev. B 51, 8467 (1995).