Normal force controlled rheology applied to agar gelation
Abstract
A wide range of thermoreversible gels are prepared by cooling down to ambient temperature hot aqueous polymer solutions. During the sol-gel transition, such materials may experience a volume contraction which is traditionally overlooked as rheological measurements are usually performed in geometries of constant volume. In this article, we revisit the formation of 1.5% wt. agar gels through a series of benchmark rheological experiments performed with a plate-plate geometry. We demonstrate on that particular gel of polysaccharides that the contraction associated withe the sol/gel transition cannot be neglected. Indeed, imposing a constant gap width during the gelation results in the strain hardening of the sample, as evidenced by the large negative normal force that develops. Such hardening leads to the slow drift in time of the gel elastic modulus towards ever larger values, and thus to an erroneous estimate of . As an alternative, we show that imposing a constant normal force equals to zero during the gelation, instead of a constant gap width, suppresses the hardening as the decrease of the gap compensates for the sample contraction. As such, imposing a zero normal force is a more reliable way to measure the linear properties of agar gels, which we prove to work equally well with rough and smooth boundary conditions. Using normal force controlled rheology, we then investigate the impact of thermal history on 1.5% wt. agar gels. We show that neither the value of the cooling rate, nor the introduction of a constant temperature stage during the cooling process influence the gel elastic properties. Instead, only depends on the terminal temperature reached at the end of the cooling ramp, as confirmed by direct imaging of the gel microstructure by cryoelectron microscopy. Finally, we also discuss two subtle artifacts associated with the use of duralumin plates that may interfere with the rheological measurements of agar gelation. We show that () the corrosion of duralumin by the aqueous solution, and () the slow migration of the oil rim added around the sample to prevent evaporation, may both lead separately to a premature and artificial growth of that should not be misinterpreted as the formation of a pre-gel. The present work offers an extensive review of the technical difficulties associated with the rheology of hydrogels and paves the way for a systematic use of normal force controlled rheology to monitor non-isochoric processes.
I Introduction
Bulk rheology is a powerful tool to monitor the linear properties of complex fluids such as polymer and surfactant solutions, emulsions, colloidal suspensions, gels, etc. Mezger (2014). Although most traditional rheology experiments are performed at constant temperature, several processes involve large temperature variations that make rheological measurements much more challenging. A textbook case of rheological experiments involving temperature variations, is the sol-gel transition. Popular examples include the jamming transition in suspensions of thermosensitive particles Senff and Richtering (1999); Kapnistos et al. (2000); Zhang et al. (2009); Wang et al. (2014), the precipitation of waxy crude oil Kané, Djabourov, and Volle (2004); Visintin et al. (2005) and the heat-induced formation of numerous gels such as biopolymer gels te Nijenhuis (1997); Stephen, Phillips, and Williams (2006); Souguir et al. (2015), gels made of oil-in-water nanoemulsions Helgeson et al. (2012, 2014), etc. In all of these examples, gelation is traditionally monitored in a geometry of constant gap with roughened boundary conditions to prevent wall slip. Small amplitude oscillatory shear (SAOS) is used to measure the linear elastic and viscous moduli, respectively and , and the thermal dilation of the shear cell due to the temperature variation is taken into account through a gap compensation procedure that is now commonly implemented on rheometers.
Nevertheless, a key technical assumption in such measurements is that the contraction of the sample during the sol-gel (or the liquid-solid) transition is negligible. Such assumption is not always valid as phase transition often comes with a volume contraction of the sample. In the latter case, if the phase transition is monitored in a geometry of constant volume, the sample will experience strain hardening as it deforms and remains in contact with the cell boundaries. In a more subtle way, the contraction may also lead either to the complete debonding of the sample from the walls of the shear cell as observed for very rigid samples, or to the formation of lubrication patches at the gel/geometry interface for soft hydrogels Zhang et al. (2001) which in both cases entail erroneous measurements of the sample elastic properties. Such issue is particularly important for biopolymer gels made of polysacharides and/or proteins which are the topic of the present work as they experience volume variations during the sol-gel transition, and are prone to solvent release under external stress.
Quantitative measurements of the linear properties of such soft solids are crucial in numerous applications Gong and Osada (2010); Nguyen and Lee (2010). For instance, biopolymer gels serve as substrate for bacterial growth and cell culture. The gel stiffness strongly impacts the cell locomotion, a phenomenon that is called “durotaxis” Lo et al. (2000), as well as stems cell differentiation Engler et al. (2006) which requires reliable methods to quantify the elastic properties of gels, especially when the latter is prepared through a complex thermal history. To our knowledge, most if not all the gelation experiments on thermoreversible gels reported in the literature have been performed at constant gap width, either in parallel-plate and cone-and-plate geometry Miyoshi, Takaya, and Nishinari (1996); Djabourov, Leblond, and Papon (1988); Mohammed et al. (1998); Norziah, Foo, and Karim (2006); Nordqvist and Vilgis (2011); Maurer, Junghans, and Vilgis (2012) or in a Taylor-Couette cell Richardson and Goycoolea (1994); Normand et al. (2000); Ikeda and Nishinari (2001). None of these experiments takes into account the contraction of the sample during gelation, although the loss of adhesion between the gel and the wall of the shear cell has been already reported as a major issue Zhang et al. (2001). The use of sand paper, although widespread, do not compensate for the sample contraction. Moreover, the presence of such a medium sandwiched between the Peltier plate and the sample further impairs the temperature control of the sample, while the glue attaching the sandpaper poorly withstands high temperatures. As a result of the sample contraction, measurements of the viscoelastic moduli in different geometries are often inconsistent which urges experimentalists to use alternative methods to monitor more accurately non-isochoric processes such as the gelation of biopolymer gels.
The purpose of the present paper is twofold. First, it aims to illustrate in a series of benchmark experiments in the same spirit as a recent work by Ewoldt et al. Ewoldt, Johnston, and Caretta (2015) that the use of a normal force controlled procedure is more adapted to monitor the gelation of thermoreversible gels than the traditional constant gap protocol. Normal force controlled rheology has been applied recently with success at constant temperature to the study of dense granular suspensions Mills and Snabre (2009); Boyer, Guazzelli, and Pouliquen (2011); Fall et al. (2015). However, if such method is also advertised by Anton Paar to probe soft solids in “World of Rheology” Mezger (2015), or appears in the TA instruments help files, the present manuscript is to our knowledge among the first quantitative report regarding normal force controlled rheology applied to thermoreversible gels. Here we show on a 1.5% wt. agar gel, that applying a constant normal force equals to zero to the sample enclosed in a parallel-plate geometry prevents any strain hardening or debonding of the gel from the plates, thus providing precise measurements of both the gelation dynamics and the gel elastic properties. Furthermore, we show that such method works equally well with both rough and smooth boundary conditions, and that as such it can be used advantageously with bare metallic surfaces without any sandpaper. Second, we build upon the first technical part and use the zero normal force protocol to study the impact of the thermal history of agar sols on the mechanical properties of the subsequent gels. We show that the cooling rate of the solution sets the gelation temperature and influences the gel contraction, without affecting significantly the final microstructure of the gel. Furthermore, the steady-state value of the gel elastic modulus is shown to be determined only by the final temperature reached at the end of the cooling ramp, and to be insensitive to the introduction of a constant temperature stage during the colling process.
Finally, we highlight two artifacts that may take place during the gelation dynamics of agar gels, whether the gelation is monitored at constant gap or at constant normal force. First, we show that the slow oxidation of the metallic walls of the shear cell by the agar sol may lead to an artificial increase of while the sample is still liquid. Second, we demonstrate that the oil rim surrounding the sample that is traditionally used to prevent the solvent evaporation, may slowly invade the gap also triggering a premature increase of the gel elastic modulus before the actual start of the gelation. Such an artifact leads to an erroneous estimate of the crossing of and , but hardly impacts the measurement of the gel final elastic properties, as long as the terminal elastic modulus is larger than a few hundred pascals.
The paper is organized as follows. Section II describes the agar samples, the experimental setup and the zero normal force procedure. We also discuss the effect of the strain amplitude and the impact of boundary conditions on the rheological measurements. In section III, the zero normal force protocol is applied to determine the impact of thermal history on the mechanical properties of agar gels. Finally, section IV provides a short discussion of these results and emphasizes future applications of normal-force controlled rheology.
II Material and methods
II.1 Agar gels
Agar is extracted from a marine red algae and consists in a mixture of polysaccharides among which the gelling component is agarose, a polymer composed of two different galactose subunits Araki (1956); Stanley (2006). When agar is dissolved in boiling water, the agarose is responsible for the formation of a crosslinked network upon cooling. The gelation involves a liquid-liquid phase separation known as spinodal decomposition that corresponds to the formation of polymer-rich and solvent-rich regions Feke and Prins (1974); SanBiagio et al. (1996); Matsuo, Tanaka, and Ma (2002), together with a conformational change of the agarose molecules which self-associate via hydrogen bonds Tako and Nakamura (1988); Braudo (1992). The exact formation scenario of the gel results from a subtle competition between these three distinct processes Manno et al. (1999) which in turn strongly depends on the agarose concentration, its molecular weight and the thermal history Normand et al. (2000); Aymard et al. (2001); Xiong et al. (2005). The spinodal demixion is favored for agarose concentrations lower than 2% wt., whereas the gelation occurs through a more direct scenario at larger concentrations. Furthermore, although the exact conformation of the agarose molecules inside the gel network is still debated (single vs. double helices) Arnott, Fulmer, and Scott (1974); Clark and Ross-Murphy (1987); Foord, Atkins, and Wills (1989); Djabourov et al. (1989); Schafer and Stevens (1995); Guenet and Rochas (2006), the microstructure of agar gels at a coarser scale is consensually described as a porous network made of bundles of agarose chains Chui, Philips, and McCarthy (1995); Pernodet, Maaloum, and Tinland (1997); Nordqvist and Vilgis (2011). The latter microstructure is filled with water and displays a brittle-like mechanical behavior including the formation of macroscopic fractures at large enough strains Bonn et al. (1998); Barrangou, Daubert, and Foegeding (2006); Daniels et al. (2007); Spandagos et al. (2012). Agar gels are also prone to release water at restMatsuhashi (1990), or under external deformation as low as a few pourcents Nakayama et al. (1978) which makes their rheological study particularly challenging and motivates the present study.
Here we focus on hydrogels made with 1.5 % wt of agar composed at 70% of agarose (BioMérieux). Agar is added as a powder to warm deionized water, and the mixture is brought to a boil whilst stirring mildly for about 10 minutes. The solution is then cooled down to C and kept at this temperature up to three days during which several samples are taken out to prepare gels inside the gap of a rheometer, as detailed below. After three days at C, the polymer solution starts suffering chemical aging as evidenced by the formation of gels of lower elastic moduli Hickson and Polson (1968); Mao et al. (2016). Fresh solutions are therefore prepared regularly, and all the data reported here have been obtained from fresh batches, younger than three days.
II.2 Rheological setup
Rheological measurements are conducted in a plate-plate geometry of diameter 40 mm driven by a stress-controlled rheometer (DHR-2, TA Instruments). The upper moving plate made of duralumin is sand-blasted and displays a surface roughness of m, measured by Atomic Force Microscopy. The bottom plate consists in a smooth and Teflon-coated Peltier unit that allows us to control the temperature of the sample. Evaporation is minimized either by using a solvent trap containing deionized water and placed on top of the upper plate, or by adding a thin layer of sunflower seed oil from Helianthus annuus (Sigma Aldrich) around the sample depending on the duration of the experiment (see section II.6 for more details). Gelation experiments are conducted as follows: the agar solution is first introduced at C in the gap of the plate-plate geometry that has been preheated at C. The temperature is then decreased at a constant rate C/min down to C (unless stated otherwise) and maintained at this temperature up to several hours to make sure the gelation is complete. In the meantime, oscillations of small amplitude performed at a frequency Hz allow us to monitor the temporal evolution of the gel viscoelastic properties. Gelation experiments are conducted either while imposing a constant gap width (m), or a constant normal force ( N) while the gap width is thus free to vary with the gel thickness. Finally, a few tests are performed on deionized water at constant temperature using either one or two transparent plates made of PMMA. In that case, images of the sample are taken from below with a webcam (Logitech HD c920) by means of a flat mirror placed at an angle of 45∘ with respect to the horizontal plates.
II.3 Gap compensation and zero normal force protocol
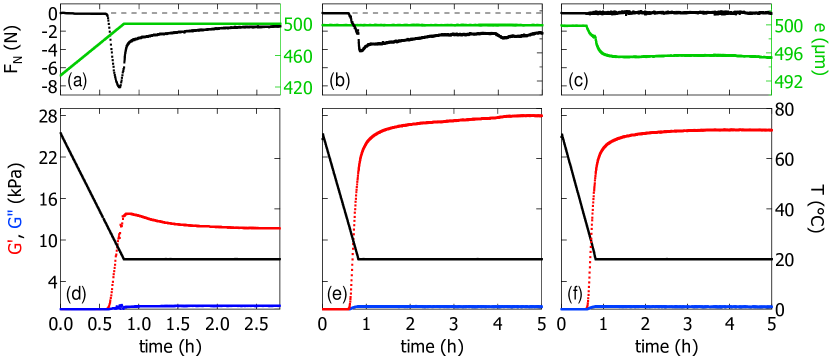
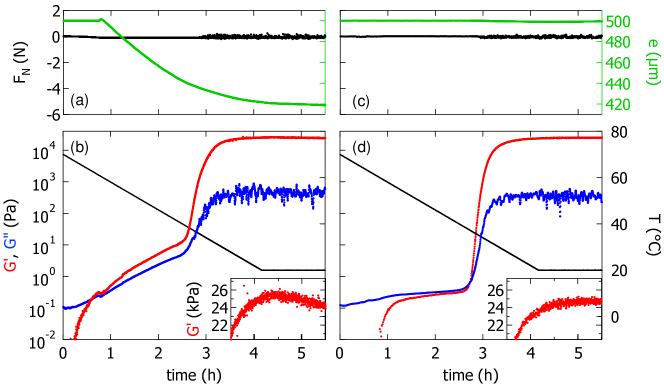
Let us start by illustrating the impact of the thermal expansion of the shear cell on the rheological measurements. For this first experiment, the gap width is set to m at C. However, due to the thermal dilation of the plates, the gap width decreases by 1.3 m/∘C for increasing temperature, as determined by calibration. The gap width is therefore 435 m at the moment the polymer solution is introduced inside the pre-heated geometry. Once the polymer solution is loaded, the temperature is decreased at a constant rate C/min down to C while we monitor the evolution of the normal force [Fig. 1(a)] and apply oscillations of small amplitude with a strain % to determine the elastic and viscous moduli of the gel, respectively and [Fig. 1(d)]. During the first half hour, while C the agar solution remains liquid, and the normal force is close to zero as the gap increases back to the initial value of 500 m. At h, the gel starts forming as evidenced by the growth of the elastic modulus which becomes larger than the viscous modulus. Concomitantly, the normal force shows negative values indicating that the gel is pulling down on the upper plate, until a strong upturn occurs at h before the end of the cooling phase ( h), indicating a brutal change in the contact between the gel and the plates, as discussed below. Moreover, goes through a maximum at h after the temperature has reached C, and relaxes towards a steady state value kPa, while remains negative. The formation of the gel appears as over after 2.5 h, and the gel displays a solid-like behavior as evidenced by .
In fact, the above procedure which does not compensate for the thermal dilation of the geometry leads to artificially low estimates of . Indeed, we have repeated the gelation experiment taking into account the variation of the gap thickness due to thermal dilation [Fig. 1(b)]. In that case, later referred to as the “temperature compensation mode”, the gap width remains constant during the entire experiment and the terminal value of the elastic modulus is kPa [Fig. 1(e)], instead of kPa in the absence of compensation for the thermal dilation of the geometry [Fig. 1(d)]. This experiment illustrates how dramatic and misleading can be the effect of the thermal dilation of the geometry on the measurements of the gel linear properties. As a consequence, the abrupt upturn of the normal force observed in Fig. 1(a) in the absence of any compensation results from a partial loss of contact between the sample and the geometry, and/or the formation of lubrication spots between the gel and the plate due to the large values of . Indeed, from the maximum value of N in Fig. 1(a), one can estimate the deformation experienced by the gel with an elastic modulus of 28 kPa to be of about 20% which is large enough to trigger the release of solvent and the partial lubrication of the gel-plate interface.
Nonetheless, the temperature compensation mode does not lead to fully satisfying rheological measurements. Indeed, one observes that the normal force still exhibits negative values during the gelation although we compensate for the thermal dilation of the geometry [Fig. 1(b)]. This result shows that the gel contracts during the sol-gel transition and pulls down on the upper plate. As a result, displays a weak logarithmic increase even after has reached a plateau [Fig. 1(e)] which is the signature of the strain hardening of the agar gel induced by the sample contraction [see Fig. 13 in the appendix for a supplemental experiment and the corresponding discussion]. Such a slow drift of towards ever larger values is also visible in other studies conducted on gels containing agar(ose) Goycoolea et al. (1995); Labropoulos et al. (2002); Normand et al. (2003); Piazza and Benedetti (2010), but usually unnoticed and not discussed as rheological data are most often plotted in semilogarithmic scale which flattens artificially.
To compensate the effect of both the thermal expansion of the geometry and the contraction of the sample during the phase transition, the gel formation is now monitored with the temperature compensation mode switched on, while imposing a controlled normal force N instead of a constant gap width. The gap width, which initial value is set to m may now vary during the experiment and indeed, we observe a gap decrease of 4 m concomitantly to the growth of [Fig. 1(c)]. Such a gap decrease of about 1% allows the upper plate to stay in contact with the gel while the latter contracts during the gelation. Furthermore, the elastic modulus does not drift anymore and reaches a constant value kPa at the end of the cooling phase [Fig. 1(f)], that is smaller than the one recorded in the constant gap experiment [Fig. 1(e)]. The latter observation also confirms the hardening scenario invoked in Fig. 1(e). The error bar associated with is mainly given by the ability of the experimentalist to load the shear cell with the same amount of hot agar solution. Repeating the same experiment about ten times on samples extracted from different batches leads to compatible results within 10%. There is thus only a slight difference between the value of measured with a constant gap (after 5 h), and the value measured with a constant normal force 111Note that repeating the gelation experiment under zero normal force with other initial gap values, i.e. m and 1000 m gives compatible values of within error bars, which demonstrates that the value of determined with the zero normal force protocol is independent of the initial value of the gap width.. However the value of measured with a constant gap width protocol is a function of time and as such depends on the patience of the experimentalist. In conclusion, monitoring the gelation while imposing a constant normal force equals to zero prevents the strain hardening of the gel and appears as a more accurate method to determine the gel elastic properties. This method, that is further referred to as “the zero normal force protocol” is the one that is used in the rest of the manuscript.
In the rest of section II we show that the terminal value of determined with the zero normal force protocol is robust and independent of the surface roughness of the plates. We also discuss in depth several artifacts related to the strain amplitude applied to measure the viscoelastic moduli, and to physico-chemical phenomena related to the boundary conditions. Finally, in section III we use the zero normal force protocol to investigate the impact of thermal history on the linear properties of a 1.5% wt. agar gel.
II.4 Strain adapted protocol
Here we briefly discuss the impact of the strain amplitude applied to monitor the gel formation. Fig. 2(b) displays in a semi-logarithmic plot the temporal evolution of the elastic and viscous moduli during a gelation conducted with the zero normal force protocol and determined with % and Hz [same protocol as in Fig. 1(f)]. Although the sample is liquid-like during the first half hour, such a small deformation leads to noisy and comparable values of and until both moduli exceed about 1 Pa. This experimental observation, which is commonly encountered in the literature Altmann et al. (2004); Russ, Zielbauer, and Vilgis (2014), is a consequence of the too small applied value of the strain amplitude. Indeed, the minimum measurable value of is inversely proportional to and given by the following expression: , where denotes the plate radius and the smallest measurable torque Ewoldt, Johnston, and Caretta (2015). Here, nN.m (for a DHR-2) and with % we find Pa which is in excellent agreement with the minimal significant stress value observed in Fig. 2(b). Imposing a larger strain before the start of the gelation, such as % allows us to decrease down to 0.01 Pa and measure consistent values for the viscoelastic moduli during the first half hour, i.e. since the sample is liquid [Fig. 2(d)]. The strain amplitude is then decreased when increases as the gelation starts, so as to remain in the linear regime and prevent any strain-induced release of solvent and/or debonding of the sample from the geometry. Indeed, strain sweep experiments performed on gels which have been prepared under oscillations of different amplitudes indicate that strain amplitudes as low as 0.01% are necessary for an optimal adhesion between the gel and the plates (see Fig. 14 and related discussion in the appendix which proves that the gel adhesion to the plates decreases for increasing strain values applied during the gelation). As a consequence, the following protocol leads to reproducible measurements: % for Pa, % for Pa Pa and % for Pa, and confirms that as long as the solution is liquid, only displays non-negligible values. After gelation, the terminal value of obtained with the strain adapted protocol is compatible within error bars with the value measured with a constant strain % [Fig. 1(f)]. Therefore adapting the value of strain amplitude during the gelation offers the opportunity to determine more accurately the crossover between and which is often used as a good estimate of the gelation point 222Note that a proper definition of the gelation point is the instant where and both scale as identical power laws of frequency which corresponds to the value of the phase angle that is independent of the frequency Chambon and Winter (1987). However, our goal here is not to determine a gelation point, but only to improve the determination of the intersection of and . and which occurs here at C. Such a strain-adapted protocol is systematically applied during the experiments reported in the rest of the manuscript.
II.5 Boundary conditions and related artifacts
II.5.1 Surface roughness
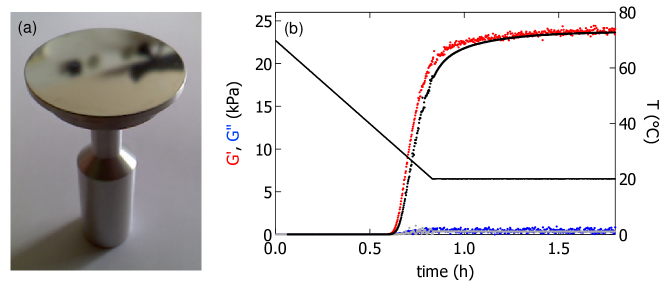
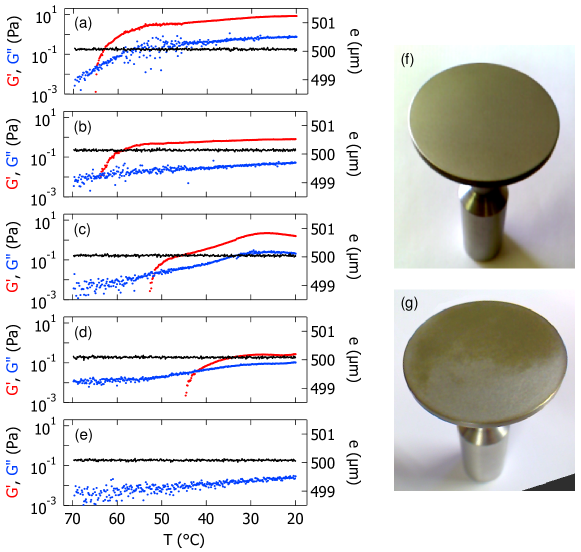
Let us now discuss the impact of the surface roughness of the plates. The experiments reported in Fig. 1 and 2 have been performed with mixed boundary conditions (BC), namely a rough metallic upper plate and a smooth (Teflon-coated) bottom Peltier plate. To further test the robustness of the zero normal force protocol, we have performed gelation experiments with symmetric boundary conditions. On the one hand, experiments with symmetrically smooth boundary conditions are performed by replacing the sand-blasted duralumin rotor with a duralumin plate polished on a rotating wheel with a suspension of ultrafine aluminum oxide particles to produce a mirror like surface pictured in Fig. 3(a) and of typical roughness nm, as determined from AFM measurements. The bottom plate is the smooth and Teflon-coated Peltier plate used by default. On the other hand, experiments with symmetrically rough boundary conditions are performed by topping the Peltier plate with a sandblasted duralumin cover that ensures a good thermal conductivity between the Peltier plate and the sample, and allows us to achieve a roughness of about 4 m for the bottom plate similar to that of the upper sandblasted duralumin plate. Both experiments reported in Fig. 3(b) lead to compatible values of within error bars (rough BC: kPa; smooth BC: kPa) that are also in quantitative agreement with the elastic modulus determined with mixed boundary conditions [see Fig. 1(f)]. These experiments demonstrate that the zero normal force protocol together with oscillations of small amplitude adapted to the value of the elastic modulus allows one to monitor the gelation dynamics in a plate-plate geometry with either smooth or sand-blasted boundary conditions. The zero normal force protocol thus appears as much simpler than the traditional constant gap width protocol which requires the use of sandpaper. In particular, sandpaper does not compensate the sample contraction during gelation and is a poor thermal conductor. Moreover, it often displays adhesion issues to the Peltier plate at high temperature, hence inducing large error bars.
II.5.2 Chemical properties of the plates surfaces
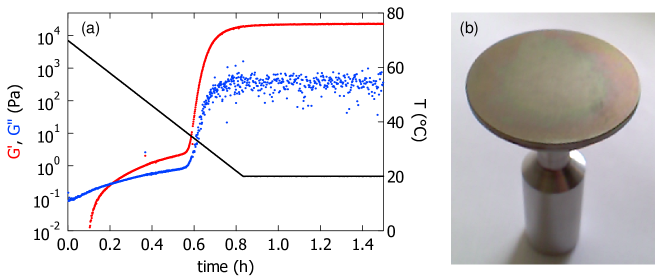
This subsection concerns a subtle artifact associated with the use of duralumin plates. We have observed that gelations performed with a duralumin rotor which has been freshly sandblasted before the experiment, systematically show a premature increase of the elastic modulus. An example is pictured in Fig. 4(a): increases from h instead of h [compare with Fig. 2(d)], and tends toward about 2 Pa before following the steep increase previously associated with the gelation. Such a premature increase of progressively disappears when the experiment is repeated four or five times with the very same geometry, while the upper plate takes an iridescent appearance [Fig. 4(b)]. If the rotor is sandblasted anew, the premature increase of is again visible in the subsequent first couple of experiments. We attribute such a premature increase of to the oxidation of the upper duralumin plate by the agar aqueous solution. Nanoparticles of aluminium oxide detach from the surface of the upper plate to be advected through the sample toward the air/liquid interface, which increases the elasticity of the contact line and leads to the premature increase of . In this framework, the successive gelation experiments result in the passivation of the upper plate which strongly slows down any further oxidation of the geometry and explains why the premature increase of is no longer observed in the subsequent experiments.
To support this interpretation, we have performed the following test: the rotor is sandblasted anew, and the preheated gap is filled with distilled water instead of the agar sol. The temperature is decreased as usual from C down to 20∘C at a cooling rate C/min under a constant normal force () N and oscillations of small amplitude ( % and Hz). Although no gelation can take place, one can see in Fig. 5(a) that after 5 min, the elastic modulus increases up to a few Pa, and remains larger than until the end of the temperature ramp. The same experiment is repeated four more times with fresh distilled water, and the results are pictured in Fig. 5(b)-(e). The increase of is still visible, but delayed from one experiment to the next and eventually no longer observed during the fifth experiment [Fig. 5(e)]. Furthermore, comparing the surface state of the upper plate before the first experiment [Fig. 5(f)] and after the fifth experiment [Fig. 5(g)], one observes an oxide layer visible by the naked eye in the latter case. The plate is indeed covered by some powdery material that can be removed easily with the finger which confirms the scenario discussed above: the corrosion of the duralumin plate nucleate aluminum oxide particles that increase the contact line elasticity leading to the premature increase of . Note that the bottom Peltier plate used in all the experiments reported in the present article (except in section II.5.1) is Teflon-coated which explains why the oxidation is only taking place at the rotor.
In conclusion, one should be aware that sandblasting a duralumin plate makes it rough, but also promotes its slow oxidation by the agar sol, which leads to an artificial increase of that should not be interpreted as the early onset of the gel formation. We shall emphasize that such issue is absent when using commercial plates made of stainless steal. In section III, all the gelation experiments are performed with an upper plate made of passivated duralumin to prevent any premature increase of .
II.6 Solvent evaporation, oil coating and related artifacts
Agar gels are mainly composed of water and evaporation has a strong impact on both the gelation dynamics and the gel linear properties. For gelation experiments performed under rapid cooling rates, i.e. C/min, evaporation is efficiently prevented by a solvent trap filled with water. However, for long lasting experiments conducted at lower cooling rates, evaporation becomes non negligible despite the solvent trap. A trick commonly reported in the literature consists in adding a thin layer of a non volatile oil at the periphery of the plate to isolate the sample from the ambiant air Orafidiya (1989); Mohammed et al. (1998); Nordqvist and Vilgis (2011). The purpose of this section is to demonstrate that such method efficiently prevents the evaporation and to investigate quantitatively the impact of the oil layer on the rheological measurements.
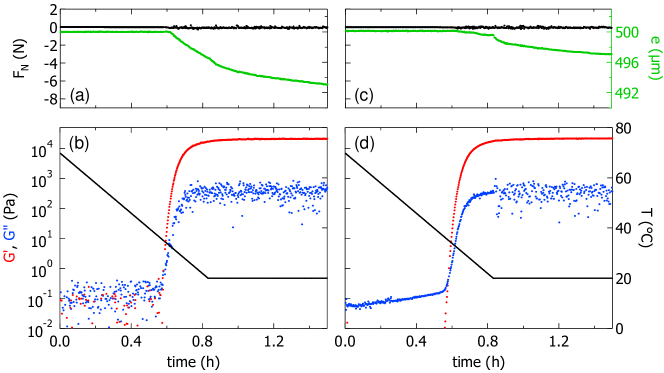
To this end, we perform two gelation experiments of long duration at a cooling rate C/min using a passivated sand-blasted duralumin rotor and the zero normal force protocol. The first gelation experiment is performed with water in the solvent trap [Fig. 6(a) and (b)], while in the second gelation experiment the sample is surrounded by a thin oil layer [Fig. 6(c) and (d)]. In the first case, we observe visually that the water in the solvent trap topping the rotor has evaporated after about 20 min, which coincides with the time above which shows non-negligible values [Fig. 6(b)]. The elastic and viscous moduli intersect at h while the gap starts decreasing. Both and slowly grow for about 2 h before showing a steep increase associated with the gelation. Non-negligible evaporation is further supported by two other observations. First, the large gap decrease of about 16% illustrated in Fig. 6(a) shows that the sample experiences water loss and that the increase of and between 0.5 and 2.5 h is artificial. Indeed, in the second experiment where the evaporation remains negligible because of the oil surrounding the sample, the gap decreases by less than 1% over the entire experiment [Fig. 6(d)]. Second, in the experiment conducted with water in the solvent trap, goes through a maximum at h before decreasing at larger times [Fig. 6(b)–inset], whereas in the experiment using oil to prevent evaporation, exhibits a monotonic behavior and tends toward a constant value after 5 hours [Fig. 6(d)–inset].
These results demonstrate quantitatively that for a low cooling rate of C/min, the sample experiences excessive evaporation when the solvent trap is filled with water. The use of an oil layer at the sample periphery prevents the solvent evaporation and allows one to access the steady state elastic properties of the gel 333We checked that the surrounding oil does not impact the steady state value of the elastic modulus by performing an experiment over a much shorter duration. Two experiments conducted at a cooling rate C/min, one with water in the solvent trap and the other one with an oil layer around the sample lead to compatible values of the elastic modulus, within error bars.. However, if the use of oil leads to quantitative measurements in steady state, shows non negligible values from h while the sample is still liquid, and long before the steep increase attributed to the gelation which takes place at h [Fig. 6(d)]. Such behavior is reminiscent of the artifact described in the previous subsection II.5.2. Nonetheless, the experiments reported in Fig. 6 are conducted with a passivated duralumin rotor, thus the premature increase of is here related to another mechanism than the corrosion of the upper plate. We show in the remainder of this section that the premature growth of is an artifact related to the presence of the surrounding oil layer.
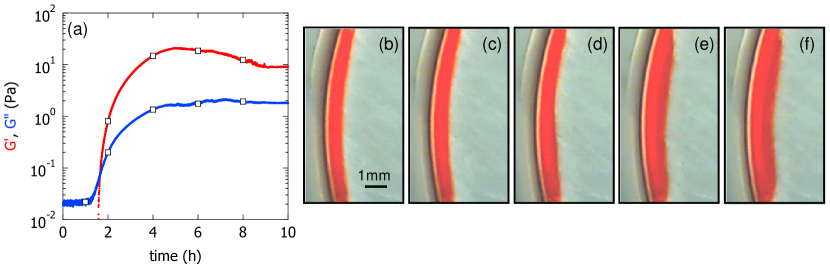
To study the effect of the surrounding oil alone, i.e. in the absence of the gelation, we perform a time sweep experiment on deionized water surrounded by a thin layer of oil. The experiment is conducted at constant temperature (C) using a passivated duralumin upper plate and a transparent bottom plate made of PMMA (gap m). Although no gelation can take place, increases and becomes larger than from h to reach a value Pa after six hours [Fig. 7(a)]. Moreover, images taken through the transparent bottom plate shows that concomitantly to the growth of , the oil rim slowly invades the gap at certain location along the sample periphery, and spreads on the surface of the upper metallic plate [Fig. 7(b)-(f)]. Therefore, the premature growth of reported in Fig. 6(d) during the gelation of the agar sol is most likley related to the inner migration of the oil/water interface.
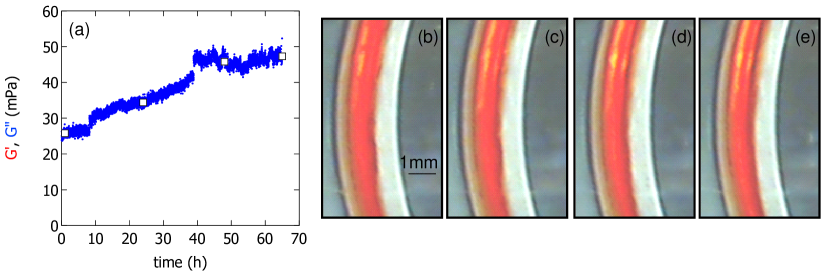
To further explore the role of the upper metallic plate on such an invasion process, we repeat the time sweep experiment on deionized water surrounded by a thin oil layer, with symmetric boundary conditions using two identical transparent plates made of PMMA (constant temperature: C and constant gap: m). For more than 65 h, and only shows non-negligible values [Fig. 8(a)], while no migration of the oil/water interface is observed by the naked eye [Fig. 8(b)-(e)]. These results confirm that the growth of and the migration of the oil/water interface observed in Fig. 7 are correlated. Furthermore it shows that the invasion of the gap by the outer oil layer, and therefore the premature increase of , are directly related to the use of metallic boundary conditions.
Finally, if a more detailed analysis of the mechanism responsible for the oil invasion of the gap is out of the scope of the present publication, we discuss the weak linear increase of visible in Fig. 8(a) which is instructive. The increase of results from the slow pervaporation of water through the oil layer. Indeed, a careful spatio-temporal analysis of the position of the oil/water interface pictured in Fig. 8(b)-(e) shows a net displacement of the oil/water interface after 65 hours 444Note that one can also estimate the length over which the oil invades the gap from the increase of the loss modulus . Indeed, since corresponds to the energy dissipated per unit volume, at first order the relative variation of follows:
with
where is the local shear rate, is the viscosity of the liquid phase (with for and for , where and stand respectively for the viscosity of the surrounding oil and that of water), denotes the plate radius and is the instantaneous angular velocity of the upper plate. From Fig. 8(a), one infers that and with one finds m in excellent agreement with the average radial displacement of the oil/water interface derived from the spatiotemporal analysis of the snapshots pictured in Fig. 8(b)-(e) (see Fig. 15 and discussion in the appendix).
ranging between 30 and 50 m depending on the angular position along the interface [see Fig. 15 in the appendix]. Such a displacement corresponds to an average velocity of the oil/water interface of about 0.17 nm.s-1. Assuming a near-diffusive transfer, the migration velocity of the oil/water interface should scale as , where is the diffusion coefficient of water in oil, is the partition coefficient of water at the oil/water interface and denotes the thickness of the oil layer Ziane et al. (2015). For water permeation through a vegetable oil/water interface 555Note that the diffusion coefficient m2.s-1 of water in sunflower seed oil is an order of magnitude lower than the diffusivity of water in silicone oil reported in Ziane et al. (2015) since the polar moieties of triglycerides strongly interact with water through hydrogen bonds, resulting in a lower mobility of dissolved water molecules Zieverink et al. (2009). one has and m2.s-1 Zieverink et al. (2009). Considering an oil layer of thickness mm [Fig. 8(b)], the above relation leads to nm.s-1 in very good agreement with the experimental observations, which confirms that the pervaporation scenario accounts for the increase of in Fig. 8(a).
In conclusion, using a layer of oil to surround the sample efficiently prevents the evaporation and allows one to measure reliable steady-state values of the viscoelastic moduli. Nonetheless, one should keep in mind that the presence of an oil layer together with metallic boundary conditions may result in the slow migration of the oil/water interface at the periphery of the plates, in turn leading to the premature growth of . As a consequence, any early evolution of the elastic modulus during the formation of an agar(ose) gel monitored with a surrounding oil layer should be considered with caution. In particular, the premature growth of reported in ref. Nordqvist and Vilgis (2011) in the early stage of a gelation experiment is likely to be artificial and may not be the signature of the formation of an intermediate structure and/or a pre-gel inside the gap.
III Impact of thermal history on the gel mechanical properties
In section II, we have shown that the zero normal force protocol is an efficient way to monitor the heat-induced formation of agar gels. This method, which may be used with either rough or smooth boundary conditions, prevents the loss of contact between the gel and the plates and allows one to measure reliably the terminal values of the gel elastic and viscous moduli. In what follows, the zero normal force protocol is applied to determine the influence of the thermal history on the linear properties of a 1.5% wt. agar gel. We first quantify the impact of the cooling rate on the gel elastic properties, before turning to the role of the final temperature Tf reached at the end of the linear ramp, for a fixed cooling rate of 1∘C/min. These experiments are conducted with the mixed boundary conditions described in section II.2: the upper duralumin plate is rough and passivated to prevent any oxidation (see subsection II.5.2), while the bottom Peltier plate is smooth and Teflon coated. Unless stated otherwise, the gelation experiments reported in this last section are conducted using an oil layer around the sample to prevent evaporation (see section II.6).
III.1 Impact of the cooling rate
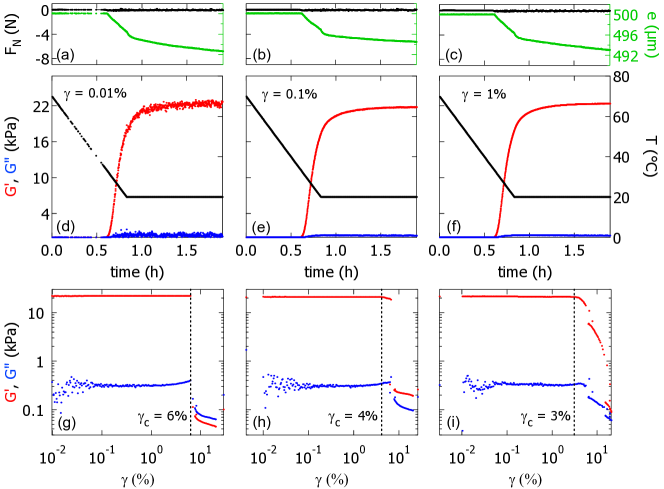
In order to determine the impact of the cooling rate on the gel elastic properties, we have performed a series of gelation experiments on a 1.5% wt agar solution, at different cooling rates ranging from 0.1 to C/min. For each experiment, the temperature is decreased from C down to C. The zero normal force protocol is applied to monitor the gelation, and the value of the strain is further adapted to the value of the elastic modulus as discussed in II.4, to properly determine the intersection of and .
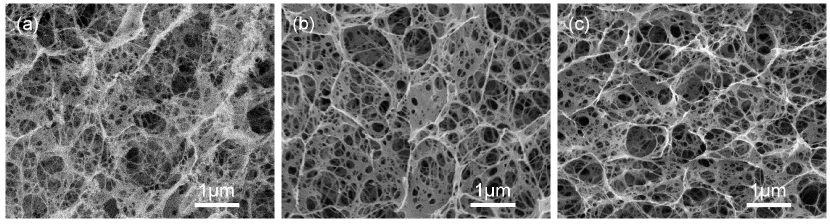
Results are displayed in Fig. 9. The formation dynamics of the gel strongly depends on : gelation occurs sooner for larger cooling rates. More quantitatively, the gelation time , defined here as the time at which is inversely proportional to the cooling rate and allows us to rescale the temporal evolution of the elastic modulus into a single mastercurve [Fig. 9(b)]. Such a rescaling hints at a unique gelation scenario that is independent of the cooling rate. The gelation temperature, defined as decreases with the cooling rate: the gelation occurs at C at C/min, while the agar sol remains liquid down to 31∘C for a cooling rate of C/min Fig. 9(d)]. Interestingly, this evolution does not affect the steady-state properties of the gel at C since the terminal values and are independent of , within error bars [Fig. 9(c)]. Scanning cryoelectron microscopy (cryo-SEM) shows that indeed the microstructure of gels prepared at different cooling rates is qualitatively the same (Fig. 10) which supports the idea that lower cooling rates only delay the gelation, but do not affect the terminal elastic properties of a 1.5% wt. agar gel.
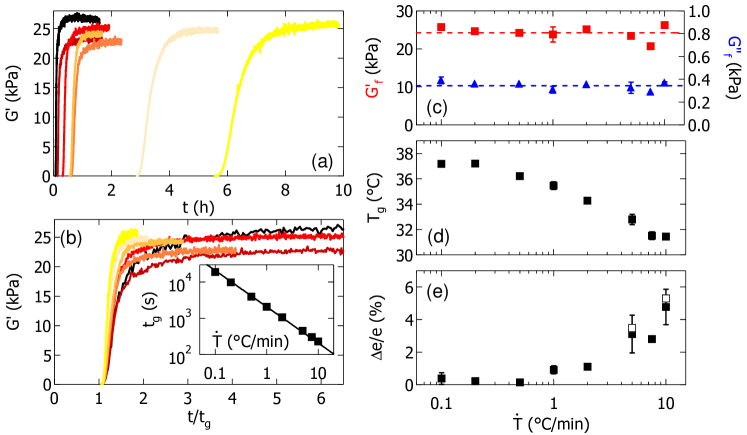
This observation strikingly contrasts with results from the literature where agarose gels prepared at constant gap width appear stronger for decreasing cooling rates Medin (1995); Mohammed et al. (1998). We attribute such a discrepancy to the partial loss of contact between the gel and the geometry in previous studies, as already discussed in Fig. 1(a) and (d). Indeed, the formation of agar gels causes the sample contraction which is robustly observed to become more important for increasing cooling rates, independently of the presence of an oil rim [Fig. 9(d)]. The sample contraction increases from about 1% for C/min, up to 5%, at C/min. In the latter case, the rapid cooling freezes the microstructure far from its minimum energy state and the relaxation of internal elastic stresses then favors the contraction of the network. For a fixed gap, the contraction is sufficient to trigger a partial loss of contact between the gel and the geometry leading to a lower estimate of the elastic modulus, exactly as evidenced in the experiment reported in Fig. 1(a) and (d). Besides, the present observation showing that larger cooling rates lead to larger contractions is compatible with the apparent decrease of the elastic modulus reported for increasing cooling rates in experiments previously reported in the literature at constant gap width. Hence the relevance of the zero normal force protocol, especially for large cooling rates where the gel contraction becomes non-negligible. Finally, one should keep in mind that the value of selects the gelation temperature (roughly estimated from the intersection of and ), and does not affect the gel linear rheology determined at 20∘C, at least over two decades of cooling rates from 0.1 to C/min. These two results are not incompatible. Indeed, the elastic modulus of the agar gel scales as a power-law of the concentration in agarose, with an exponent close to 2.2 Normand et al. (2000). Therefore a 5% increase in the agar concentration due to the gap decrease during a rapid cooling results in a 12% increase in . The uncertainty in the measurement of is of the same order of magnitude as emphasized in section IIC, which explains why is reported as roughly constant without significant dependence upon the cooling rate.
III.2 Impact of the temperature drop
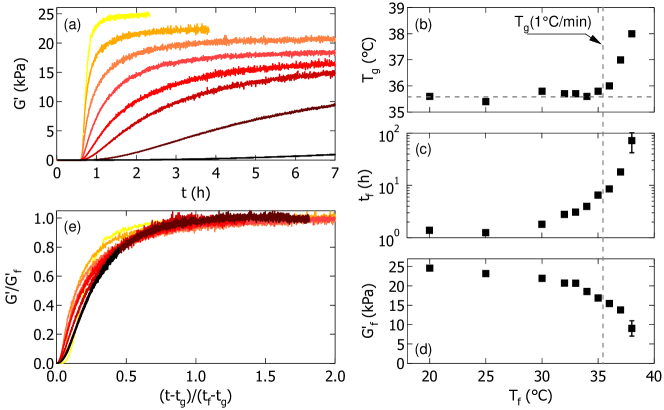
The cooling rate is now fixed to C/min and experiments are performed by varying the final temperature at the end of the ramp so as to quantify the impact of the temperature drop on the gel mechanical properties. The sample is loaded as a liquid into the preheated gap of the rheometer, and the temperature is swept from C down to , where is chosen between 20 and C. As illustrated in Fig. 11(a), the terminal temperature impacts both the gelation dynamics and the steady-state value of the elastic modulus.
Imposing a cooling rate C/min, fixes the gelation temperature to C [Fig. 9(d)]. We will therefore discuss the gelation dynamics whether is larger or smaller than C. For C, the gelation always starts at C confirming that the intersection of and mainly depends on the cooling rate [Fig. 11(b)]. Moreover, the time for the elastic modulus to reach a steady-state value (within 5%) increases with , which accounts for the increasing duration of the gelation as the terminal temperature is increased [Fig. 11(c)]. Surprisingly, for C, the gelation dynamics becomes slower but the gelation is still observed, at least up to C. Within this temperature range, the slowdown of the dynamics now results from the increase of both the gelation time and the time to reach the steady state, i.e. for increasing values of , the intersection of and occurs later and once it takes more time for to reach [Fig. 11(b) and (c)]. Finally, for increasing terminal temperatures one observes the formation of gels with decreasing elastic modulus [Fig. 11(d)]. Such a behavior is observed whether is smaller or larger than C, which suggests that the gel formation scenario is likely to be the same on both sides of although the dynamics is strongly slowed down for .
Indeed, here again the various gelation curves obtained for different terminal temperature can be rescaled into a single master curve by plotting versus [Fig. 11(e)]. The latter function provides the best rescaling among other temporal functions such as , , etc. which demonstrates that the duration separating the beginning of the gelation from the steady state is the relevant unit of time associated with the gelation of 1.5% wt. agar gels. Furthermore, the existence of a master curve confirms the existence of a single gelation scenario, that is supposedly the same as the one evidenced by the experiments performed at different cooling rates (section III.1). This result also indicates that the gel elastic modulus is mostly a function of the terminal temperature reached at the end of the temperature ramp, and that reflects the temperature dependence of a gel with a single microstructure, whether it has been formed above or below 35.5∘C. This point is discussed in more detail in the following paragraph.
III.3 Impact of a temperature plateau during cooling
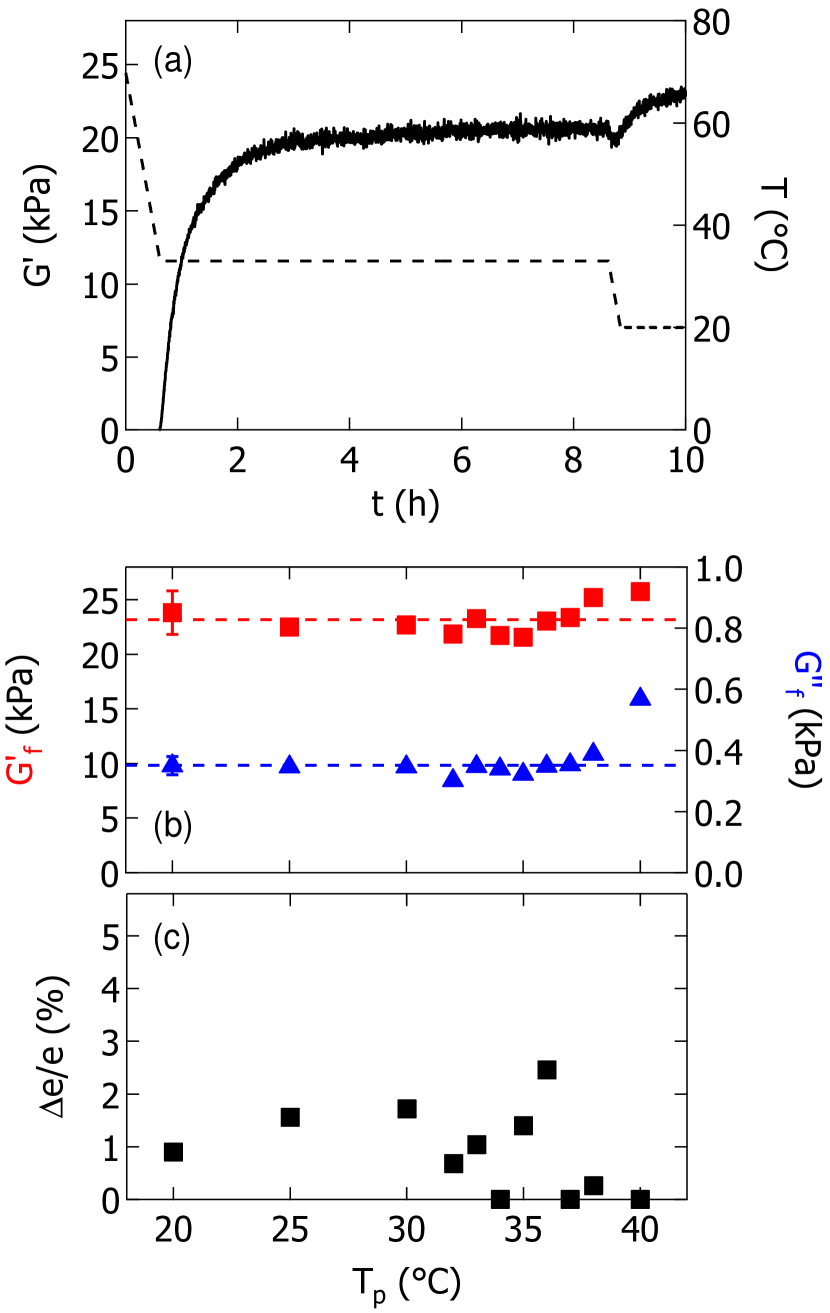
To determine whether the gels that are obtained at different terminal temperatures on both sides of C display fundamentally different properties, we perform a last series of experiments. Gelation experiments of 1.5% wt. agar solutions similar to the ones reported in section III.2 are performed by decreasing the temperature at 1∘C/min from C down to , where is chosen between 20 and C and maintained for 8 h before resuming the cooling down to C. The result of a temperature stop at C is given in Fig. 12(a). The elastic modulus reaches a constant value while in agreement with the data reported in Fig. 11. The subsequent drop of temperature down to leads to a novel increase of which terminal value, , is compatible with the value measured by direct cooling from 70∘C to 20∘C, i.e. without any plateau of temperature. The experiments repeated at different values of further support this conclusion: the terminal values reached by and are independent of [Fig. 12(b)], whether the plateau of temperature is performed above or below the gelation temperature C selected by the cooling rate. Such values of and are also compatible within error bars with the ones reported in Fig. 9(c) for different cooling rates. This result shows that the gelation of a 1.5% wt. agar solution is mainly controlled by the spinodal demixing expected to take place over shorter timescales than the timescale associated with the cooling process (i.e. 50 min). As a result, the elastic and viscous moduli of the gel formed upon cooling are fixed by the terminal temperature and the thermal history poorly impacts the gel linear properties. Finally, the gel contraction slightly varies from one experiment to the next, but does not show any significant trend with the temperature of the plateau, ranging between 0 and 2%, with a mean value % [Fig. 12(c)]. Again, such values justify the use of the zero normal force protocol instead of a constant gap width to determine the gel elastic properties.
IV Discussion and conclusions
In the first part of this work we have shown quantitatively that the zero normal force protocol is more adapted to monitor the gelation dynamics of agar solutions than the traditional constant gap width procedure. Indeed, the gelation of a 1.5% wt. agar solution results in the sample contraction as evidenced by the large negative normal forces measured in experiments performed at constant gap width. Such a contraction in a cell of constant volume leads to the strain hardening of the gel, which explains the artificial drift of the gel elastic modulus towards ever larger values that is commonly encountered in the literature, even after the gelation is over. Although supplemental observations of the gel formation in a geometry of constant gap width are needed to fully elucidate the local scenario associated with strain hardening and the gel debonding from the walls [see for instance ref. Arevalo et al. (2015)], we have shown that the zero normal force protocol allows one to determine more reliably the steady-state values of the gel elastic properties. Furthermore, we have demonstrated that the zero normal force protocol makes it possible to monitor the gelation with smooth boundary conditions. Therefore, such protocol ensures a good thermal contact between the sample and the bare metallic geometry compared to constant gap width experiments which require the use of sandpaper (or an equivalent coating) to prevent wall slip and/or the gel debonding from the walls. As such, the zero normal force protocol appears very promising to investigate more quantitatively the gelation or the solidification dynamics of samples displaying large volume changes during the sol-gel or the liquid-solid transition. In particular, we anticipate that the zero normal force protocol will find relevant applications for cocoa butter rheology Sonwai and Mackley (2006); Taylor et al. (2009); Habouzit (2012) and more generally in the rapidly growing field of hydrate slurries Peixinho et al. (2010); Ahuja, Zylyftari, and Morris (2015) where rheological measurements appear extremely delicate due potentially to the relative dilation of the sample compared to that of the geometry under complex thermal protocols.
Moreover, we have unraveled two subtle artifacts related to the contact of an aqueous solution with metallic boundary conditions that may lead to a premature increase of the elastic modulus long before the start of the gelation. On the one hand, the corrosion of duralumin plates by the oxidative agar sol may enrich the air/solution or the oil/solution interface with nanoparticles. Such nanoparticles increase the elasticity of the contact line before the start of the gelation, leading to an artificial increase of the elastic modulus, with . Note that the latter issue is specific to duralumin and is not observed for plates made of stainless steel. On the other hand, the oil layer traditionally added around the sample to prevent evaporation may also affect the rheological measurements while the sample is still liquid. The oil may slowly invade the gap leading to a premature increase of . The role of the plates wetting properties on the oil invasion scenario remains to be investigated.
Finally, in the second part of this article, we have applied the zero normal force protocol to determine the influence of thermal history on the linear rheology of a 1.5% wt. agar gel containing 1% wt. of agarose. Our study demonstrates that the gel elastic properties are mostly controlled by the terminal temperature at the end of the cooling process, and that contrarily to gels with higher agarose content Aymard et al. (2001), neither the cooling rate nor the thermal path affect the gel mechanical properties. Such a result suggests that the local gelation scenario is mostly controlled by the rapid spinodal demixing of the agar solution in contrast with the complex formation scenario reported in Manno et al. (1999) on a 2% wt agarose gel. As a practical consequence, the thermal parameters allow one to modulate the gel formation dynamics. Namely, the crossover between the elastic and viscous modulus is selected by the cooling rate , while for a given value of , the choice of the terminal temperature relative to the temperature at which the crossover of and takes place makes it possible to strongly slow down the gelation. These results should help in the optimization of manufacturing lines of agar-based products such as Petri dishes or specific electrophoretic gels, for which the cooling rate and the delay to complete gelation are the most constraining factors regarding the production rate. More generally, the zero normal force procedure should help performing more reliable rheological investigation of non-isochoric processes.
Acknowledgements.
This work received funding from BioMérieux and the ANRT under the CIFRE program, Grant Agreement No. 112972. The authors acknowledge H. Saadaoui for AFM measurements of the surface roughness, J.-M. Olive for polishing the duralumin plates, P. Legros for his help with the cryo-SEM experiments, as well as Y. Amarouchène, J.-B. Salmon, F. Villeval and E. Laurichesse for stimulating discussions, and two anonymous referees for constructive comments on our manuscript. T.D. acknowledges funding from the CNRS through the“Theoretical Physics and Interfaces” PEPS scheme, project “ComplexWall”.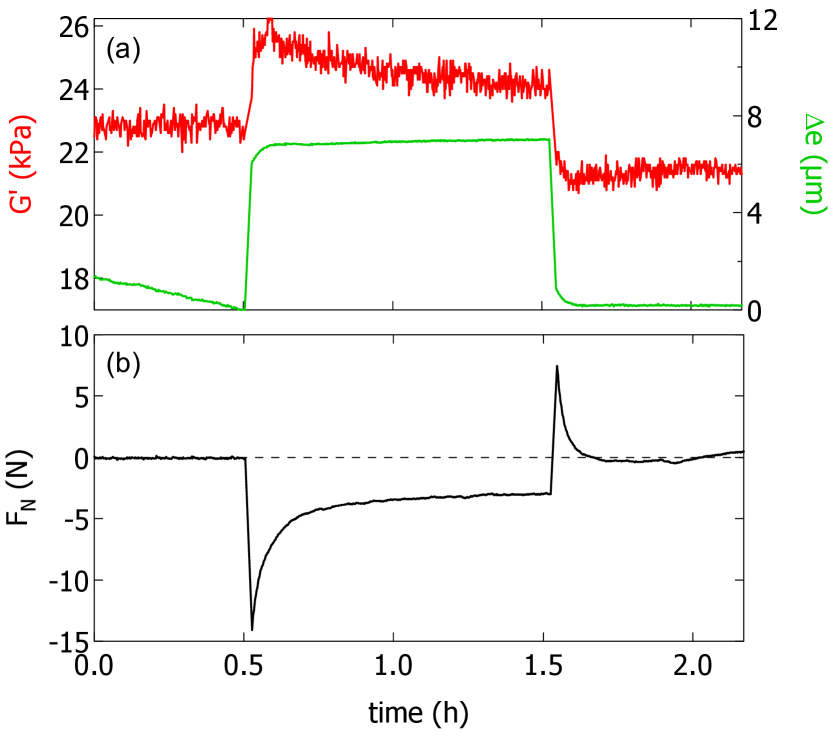
Appendix
The first part of the appendix provides a proof that the slow increase of the elastic modulus reported in Fig. 1(e) during a gelation experiment performed at constant gap width, is indeed due to the strain hardening of the sample. We have performed the following supplemental test: an agar gel is prepared between parallel plates (initial gap 500 m) using the zero normal force protocol, by decreasing the temperature from C down to C at C/min. At the end of the gelation process, the gap has decreased by 1% and the normal force is still equal to zero, in agreement with the results reported in Fig. 1(c) and (f) in the main text. We then switch the rheometer to a controlled gap mode and increase the gap width by m at m/s, which corresponds to a vertical extension of the gel of about 1%. In response, the gel elastic modulus reported in Fig. 13(a) shows a brutal increase of about 10% from 23 kPa to 25 kPa, while the normal force concomitantly becomes negative and relaxes towards N [Fig. 13(a)] which indicates that the gel is pulling on the upper plate. These results show that an increase of the gap width triggers an increase of the gel elastic modulus: the gel experiences strain hardening under extension. We thus conclude that the contraction of the sample at constant gap width also leads to the strain hardening of the sample, which explains the ever increasing values of reported during gelations performed at constant gap width [Fig. 1(e)]. Moreover, when the gap is brought back to its initial position after 1 h, the normal force relaxes back to zero, while decreases to a value slightly lower than the initial one (Fig. 13). Such a discrepancy is likely due to a partial loss of contact between the gel and the plates, but remains to be investigated in more details.
The second part of the appendix is dedicated to the impact of the strain amplitude during the gelation experiments. We have repeated the gelation experiment reported in the main text [Fig. 1(f)] at different strain amplitudes of constant value: , 0.1 and 1% while applying the zero normal force protocol. The results displayed in Fig. 14 show quantitatively the same terminal values of the elastic modulus [ kPa in Fig. 14(d)–(f)] and the same sample contraction [% in Fig. 14(a)–(c)]. Therefore, as long as the strain amplitude remains lower than 1%, the stress applied during the gelation performed with the zero normal force protocol does not impact the gel formation dynamics nor the steady-state parameters of the gel. Yet the strain applied during the gelation does matter. Indeed, we have performed a strain sweep on the three gels which have been exposed to different oscillatory amplitudes during their gelation [Fig. 14(g)–(i)]. For all the experiments, we observe that G’ decreases above a critical strain which is interpreted as the progressive debonding of the gel from the plate, as the gel remains intact and no macroscopic crack are visible at the end of the strain sweep. First, the critical strain above which decreases as a result of the gel debonding is always larger than 1%. This result further justifies the strain adapted protocol introduced in section II.4 of the main text, which consists in progressively decreasing the strain amplitude applied to measure the viscoelastic modulus during the gelation. Second and as a remarkable result, the critical strain above which decreases depends on the strain amplitude applied during the gelation. Gels which formation has been monitored with a smaller amplitude, maintain contact with the plates up to a larger value of . This observation indicates that small strain amplitude as low as 0.01% during the gelation are required for an optimal adhesion between the sample and the plates. Finally, the evolution of the viscoelastic modulus in the vicinity of the critical deformation strongly differs depending on the strain amplitude applied during the gel formation. The gel which has been prepared at % shows a brutal drop in during the strain sweep [Fig. 14(g)] which hints at an abrupt detachment from the plates. Gels which formation have been monitored under larger strains ( and 1%) display a much smoother decrease in above [Fig. 14(h) and (i)] which could correspond to a more progressive contact loss from the plate. This last point certainly deserves more investigation.
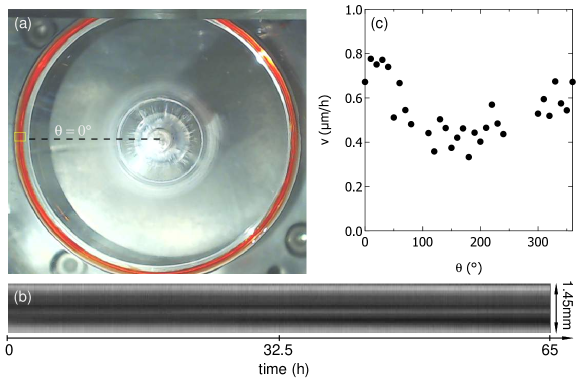
The third and last part of the appendix concerns the displacement of the peripheral oil/water interface sandwiched between two transparent PMMA plates, as illustrated in Fig. 8 in the main text. Let us recall that the gap is filled with distilled water and that the surrounding oil rim is stained in red with a fat soluble dye. We use a spatiotemporal analysis to measure the velocity of the interface. A picture of the entire geometry shot from below is reported in Fig. 15(a). A rectangular region of interest ( mm mm, i.e. 3932 pixels2) is pictured as a yellow rectangle in Fig. 15(a) and defines the reference angular position with respect to the plate rotation axis. The temporal evolution of the gray level along the oil/water interface is plotted as a spatiotemporal diagram in Fig. 15(b) which allows us to measure the inclination of the grey level texture through a sub-pixel digital image correlation and detect a displacement of about one pixel over a duration of 65 h! The latter analysis applied every 10∘ along the periphery of the oil/water interface reveals that the oil moves systematically towards the rotation axis at a velocity which depends on the angular position and ranges between 0.4 and 0.8 m/h [Fig. 15(c)].
References
References
- Mezger (2014) T. G. Mezger, The Rheology Handbook, edited by E. Coatings (Vincentz Network; 4 edition, 2014).
- Senff and Richtering (1999) H. Senff and W. Richtering, “Temperature sensitive microgel suspensions: Colloidal phase behavior and rheology of soft spheres,” Journal of Chemical Physics 111, 1705–1711 (1999).
- Kapnistos et al. (2000) M. Kapnistos, D. Vlassopoulos, G. F. F. Mortensen, G. Fleisher, and J. Roovers, “Reversible thermal glelation in soft spheres,” Phys. Rev. Lett. 85, 4072–4075 (2000).
- Zhang et al. (2009) Z. Zhang, N.Xu, D. Chen, P. Yunker, A. Alsayed, K. Aptowicz, P. Habdas, A. Liu, S. Nagel, and A. Yodh, “Thermal vestige of the zero-temperature jamming transition,” Nature 459, 230–233 (2009).
- Wang et al. (2014) H. Wang, X. Wu, Z. Zhu, C. Liu, and Z. Zhang, “Revisit to phase diagram of poly(n-isopropylacrylamide) microgel suspensions by mechanical spectroscopy,” The Journal of Chemical Physics 140, 024908 (2014).
- Kané, Djabourov, and Volle (2004) M. Kané, M. Djabourov, and J.-L. Volle, “Rheology and structure of waxy crude oils in quiescent and under shearing conditions,” Fuel 83, 1591–1605 (2004).
- Visintin et al. (2005) R. Visintin, R. Lapasin, E. Vignati, P. D’Antona, and T. Lockhart, “Rheological behavior and structural interpretation of waxy crude oil gels,” Langmuir 21, 6240–6249 (2005).
- te Nijenhuis (1997) K. te Nijenhuis, Thermoreversible networks: viscoelastic properties and structure of gels, edited by Springer-Verlag (Springer Berlin Heidelberg, 1997).
- Stephen, Phillips, and Williams (2006) A. Stephen, G. Phillips, and P. Williams, eds., Food Polysaccharides and Their Applications (CRC Press, Taylor and Francis Group – 2nd ed., 2006).
- Souguir et al. (2015) H. Souguir, O. Ronsin, C. Caroli, and T. Baumberger, “Two-step build-up of a thermoreversible polymer network: From early local to late collective dynamics,” Phys. Rev. E 91, 042305 (2015).
- Helgeson et al. (2012) M. Helgeson, S. Moran, H. An, and P. Doyle, “Mesoporous organohydrogels from thermogelling photocrosslinkable nanoemulsions,” Nature Materials 11, 344–352 (2012).
- Helgeson et al. (2014) M. Helgeson, Y. Gao, S. Moran, J. Lee, M. Godfrin, A. Tripathi, A. Bose, and P. Doyle, “Homogeneous percolation versus arrested phase separation in attractively-driven nanoemulsion colloidal gels,” Soft Matter 10, 3122–3133 (2014).
- Zhang et al. (2001) H. Zhang, M. Yoshimura, K. Nishinari, M. Williams, T. Foster, and I. Norton, “Gelation behaviour o fkonjac glucomannan with different molecular weights,” Biopolymers 59, 38–50 (2001).
- Gong and Osada (2010) J. Gong and Y. Osada, “Soft and wet materials: From hydrogels to biotissues,” Advances in Polymer Science 236, 203–246 (2010).
- Nguyen and Lee (2010) M. K. Nguyen and D. Lee, “Injectable biodegradable hydrogels,” Macromol. Biosci. 10, 563–579 (2010).
- Lo et al. (2000) C.-M. Lo, H.-B. Wang, M. Dembo, and Y.-L. Wang, “Cell movement is guided by the rigidity of the substrate,” Biophysical Journal 79, 144–152 (2000).
- Engler et al. (2006) A. Engler, S. Sen, H. Sweeney, and D. Discher, “Matrix elasticity directs stem cell lineage specification,” Cell 126, 677–689 (2006).
- Miyoshi, Takaya, and Nishinari (1996) E. Miyoshi, T. Takaya, and K. Nishinari, “Rheological and thermal studies of gel-sol transition in gellan gum aqueous solutions,” Carbohydrate Polymers 30, 109–119 (1996).
- Djabourov, Leblond, and Papon (1988) M. Djabourov, J. Leblond, and P. Papon, “Gelation of aqueous gelatin solutions. ii. rheology of the sol-gel transition,” J. Phys. France 49, 333–343 (1988).
- Mohammed et al. (1998) Z. Mohammed, M. Hember, R. Richardson, and E. Morris, “Kinetic and equilibrium processes in the formation and melting of agarose gels,” Carbohydrate Polymers 36, 15–26 (1998).
- Norziah, Foo, and Karim (2006) M. Norziah, S. Foo, and A. Karim, “Rheological studies on mixtures of agar (gracilaria changii) and k-carrageenan,” Food Hydrocolloids 20, 206–217 (2006).
- Nordqvist and Vilgis (2011) D. Nordqvist and T. Vilgis, “Rheological study of the gelation process of agarose-based solutions,” Food Biophysics 6, 450–460 (2011).
- Maurer, Junghans, and Vilgis (2012) S. Maurer, A. Junghans, and T. Vilgis, “Impact of xanthan gum, sucrose and fructose on the viscoelastic properties of agarose hydrogels,” Food Hydrocolloids 29, 298–307 (2012).
- Richardson and Goycoolea (1994) R. Richardson and F. Goycoolea, “Rheological measurement of -carrageenan during gelation,” Carbohydrate Polymers 24, 223–225 (1994).
- Normand et al. (2000) V. Normand, D.L.Lootens, E. Amici, K. Plucknett, and P. Aymard, “New insight into agarose gel mechanical properties,” Biomacromolecules 1, 730–738 (2000).
- Ikeda and Nishinari (2001) S. Ikeda and K. Nishinari, ““weak gel”-type rheological properties of aqueous dispersions of nonaggregated -carrageenan helices,” J. Agric. Food. Chem. 49, 4436–4441 (2001).
- Ewoldt, Johnston, and Caretta (2015) R. Ewoldt, M. Johnston, and L. Caretta, “Complex fluids in biological systems,” (Springer New York, 2015) Chap. Chapter 6: Experimental Challenges of Shear Rheology: How to Avoid Bad Data, pp. 207–241.
- Mills and Snabre (2009) P. Mills and P. Snabre, “Apparent viscosity and particle pressure of a concentrated suspension of non-brownian hard spheres near the jamming transition,” Eur. Phys. J. E 30, 309–316 (2009).
- Boyer, Guazzelli, and Pouliquen (2011) F. Boyer, E. Guazzelli, and O. Pouliquen, “Unifying suspension and granular rheology,” Phys. Rev. Lett. 107, 188301 (2011).
- Fall et al. (2015) A. Fall, G. Ovarlez, D. Hautemayou, C. Mézière, J.-N. Roux, and F. Chevoir, “Dry granular flows: Rheological measurements of the -rheology,” J. Rheol. 59, 1065–1080 (2015).
- Mezger (2015) T. Mezger, “Tips and tricks from joe flow - normal force control: May the force be with you,” Tech. Rep. (Anton Paar, 2015).
- Araki (1956) C. Araki, “Structure of the agarose consitutent of agar-agar,” Bulletin of the Chemical Society of Japan 29, 543–544 (1956).
- Stanley (2006) N. Stanley, “Food polysaccharides and their applications, second edition,” (A.M. stephens and G.O. Philips and P.A. Williams, 2006) Chap. agars, pp. 217–238.
- Feke and Prins (1974) G. Feke and W. Prins, “Spinodal phase separation in a macromolecular sol-gel transition,” Macromolecules 7, 527–530 (1974).
- SanBiagio et al. (1996) P. SanBiagio, D. Bulone, A. Emanuele, M. Palma-Vittorelli, and M. Palma, “Spontaneous symmetry-breaking pathways: time-resolved study of agarose gelation,” Food Hydrocolloids 10, 91–97 (1996).
- Matsuo, Tanaka, and Ma (2002) M. Matsuo, T. Tanaka, and L. Ma, “Gelation mechanism of agarose and -carrageenan solutions estimated in terms of concentration fluctuation,” Polymer 43, 5299–5309 (2002).
- Tako and Nakamura (1988) M. Tako and S. Nakamura, “Gelation mechanism of agarose,” Carbohydrate Research 180, 277–284 (1988).
- Braudo (1992) E. Braudo, “Mechanism for galactan gelation,” Food Hydrocolloids 6, 25–43 (1992).
- Manno et al. (1999) M. Manno, E. Emanuele, V. Martorana, D. Bulone, P. S. Biagio, M. Palma-Vittorelli, and M. Palma, “Multiple interactions between molecular and supramolecular ordering,” Phys. Rev. E 59, 2222–2230 (1999).
- Aymard et al. (2001) P. Aymard, D. Martin, K. Plucknett, T. Foster, A. Clark, and I. Norton, “Influence of thermal history on the structural and mechanical properties of agarose gels,” Biopolymers 59, 131–144 (2001).
- Xiong et al. (2005) J.-Y. Xiong, J. Narayanan, X.-Y. Liu, T. Chong, S. Chen, and T.-S. Chung, “Topology evolution and gelation mechanism of agarose gel,” J. Phys. Chem. B 109, 5638–5643 (2005).
- Arnott, Fulmer, and Scott (1974) S. Arnott, A. Fulmer, and W. Scott, “The agarose double helix and its function in agarose gel structure,” Journal of Molecular Biology 90, 269–284 (1974).
- Clark and Ross-Murphy (1987) A. Clark and S. Ross-Murphy, “Structural and mechanical properties of biopolymer gels,” Advances in Polymer Science 83, 57–192 (1987).
- Foord, Atkins, and Wills (1989) S. Foord, E. Atkins, and H. Wills, “New x-ray diffraction results from agarose: Extended single helix structures and implications for gelation mechanism,” Biopolymers 28, 1345–1365 (1989).
- Djabourov et al. (1989) M. Djabourov, A. Clark, D. Rowlands, and S. Ross-Murphy, “Small-angle x-ray scattering characterization of agarose sols and gels,” Macromolecules 22, 160–180 (1989).
- Schafer and Stevens (1995) S. Schafer and E. Stevens, “A reexamination of the double-helix model for agarose gels using optical rotation,” Biopolymers 36, 103–108 (1995).
- Guenet and Rochas (2006) J.-M. Guenet and C. Rochas, “Agarose sols and gels revisited,” Macromol. Symp. 242, 65–70 (2006).
- Chui, Philips, and McCarthy (1995) M. Chui, R. Philips, and M. McCarthy, “Measurement of the porous microstructure of hydrogels by nuclear magnetic resonance,” Journal of Colloid and Interface Science 174, 336–344 (1995).
- Pernodet, Maaloum, and Tinland (1997) N. Pernodet, M. Maaloum, and B. Tinland, “Pore sizes of agarose gels by atomic force microscopy,” Electrophoresis 18, 55–58 (1997).
- Bonn et al. (1998) D. Bonn, H. Kellay, M. Prochnow, K. Ben-Djemiaa, and J. Meunier, “Delayed fracture of an inhomogeneous soft solid,” Science 280, 265–267 (1998).
- Barrangou, Daubert, and Foegeding (2006) L. Barrangou, C. Daubert, and E. Foegeding, “Textural properties of agarose gels. i. rheological and fracture properties,” Food Hydrocolloids 20, 184–195 (2006).
- Daniels et al. (2007) K. Daniels, S. Mukhopadhyay, P. Houseworth, and R.P.Behringer, “Instabilities in droplets spreading on gels,” Phys. Rev. Lett. 99, 124501 (2007).
- Spandagos et al. (2012) C. Spandagos, T. Goudoulas, P. Luckham, and O. Matar, “Surface tension-induced gel fracture. part 1. fracture of agar gels,” Langmuir 28, 7197–7211 (2012).
- Matsuhashi (1990) T. Matsuhashi, “Food gels,” (Elsevier Science Publishers LTD, 1990) Chap. 1. Agar, pp. 1–51.
- Nakayama et al. (1978) T. Nakayama, M. Kawasaki, E. Niwa, and I. Hamada, “Compression creep behavior and syneresis water of agar-agar and actomyosin gels,” Journal of Food Science 43, 1430–1432 (1978).
- Hickson and Polson (1968) T. Hickson and A. Polson, “Some physical characteristics of the agarose molecule,” Biochemica et Biophysica Acta 165, 43–58 (1968).
- Mao et al. (2016) B. Mao, A. Bentaleb, F. Louerat, T. Divoux, and P. Snabre, “Overcooked agar solutions: impact on the structural and mechanical properties of agar gels,” Submitted to Soft Matter (February 2016).
- Goycoolea et al. (1995) F. Goycoolea, R. Richardson, E. Morris, and M. Gidley, “Effect of locus bean gum and konjac glucomannan on the conformation and rheology of agarose and -carrageenan,” Biopolymers 36, 643–658 (1995).
- Labropoulos et al. (2002) K. Labropoulos, D. Niesz, S. Danforth, and P. Kevrekidis, “Dynamics rheology of agar gels: theory and experiments. part ii: gelation behavior of agar sols and fitting of a theoretical rheological model,” Carbohydrate Polymers 50, 407–415 (2002).
- Normand et al. (2003) V. Normand, P. Aymard, D. Lootens, E. Amici, K. Plucknett, and W. Frith, “Effect of sucrose on agarose gels mechanical behaviour,” Carbohydrate Polymers 54, 83–95 (2003).
- Piazza and Benedetti (2010) L. Piazza and S. Benedetti, “Investigation on the rheological properties of agar gels and their role on aroma release in agar/limonene solid emulsions,” Food Research International 43, 269–276 (2010).
- Note (1) Note that repeating the gelation experiment under zero normal force with other initial gap values, i.e. m and 1000 m gives compatible values of within error bars, which demonstrates that the value of determined with the zero normal force protocol is independent of the initial value of the gap width.
- Altmann et al. (2004) N. Altmann, J. Cooper-White, D. Dunstan, and J. Stokes, “Strong through to weak sheared gels,” J. Non-Newtonian Fluid Mech. 124, 129–136 (2004).
- Russ, Zielbauer, and Vilgis (2014) N. Russ, B. Zielbauer, and T. Vilgis, “Impact of sucrose and trehalose on different agarose-hydrocolloid systems,” Food Hydrocolloids 41, 44–52 (2014).
- Note (2) Note that a proper definition of the gelation point is the instant where and both scale as identical power laws of frequency which corresponds to the value of the phase angle that is independent of the frequency Chambon and Winter (1987). However, our goal here is not to determine a gelation point, but only to improve the determination of the intersection of and .
- Orafidiya (1989) L. Orafidiya, “Continuous shear rheometry of o/w emulsions; control of evaporation in cone/plate geometry,” J. Pharm. Pharmacol. 41, 341–342 (1989).
- Note (3) We checked that the surrounding oil does not impact the steady state value of the elastic modulus by performing an experiment over a much shorter duration. Two experiments conducted at a cooling rate C/min, one with water in the solvent trap and the other one with an oil layer around the sample lead to compatible values of the elastic modulus, within error bars.
-
Note (4)
Note that one can also estimate the length over
which the oil invades the gap from the increase of the loss modulus .
Indeed, since corresponds to the energy dissipated per unit volume, at
first order the relative variation of follows:
with
where is the local shear rate, is the viscosity of the liquid phase (with for and for , where and stand respectively for the viscosity of the surrounding oil and that of water), denotes the plate radius and is the instantaneous angular velocity of the upper plate. From Fig. 8(a), one infers that and with one finds m in excellent agreement with the average radial displacement of the oil/water interface derived from the spatiotemporal analysis of the snapshots pictured in Fig. 8(b)-(e) (see Fig. 15 and discussion in the appendix). - Ziane et al. (2015) N. Ziane, M. Guirardel, J. Leng, and J.-B. Salmon, “Drying with no concentration gradient in large microfluidic droplets,” Soft Matter 11, 3637–3642 (2015).
- Note (5) Note that the diffusion coefficient m2.s-1 of water in sunflower seed oil is an order of magnitude lower than the diffusivity of water in silicone oil reported in Ziane et al. (2015) since the polar moieties of triglycerides strongly interact with water through hydrogen bonds, resulting in a lower mobility of dissolved water molecules Zieverink et al. (2009).
- Zieverink et al. (2009) M. Zieverink, E. de Rijke, K. de Kruijf, and P. de Kok, “Diffusivity and solubility of water in palm oil.” in 7th Euro Fed Lipid Congress, Poster (PHYS-004) Graz, Austria (2009).
- Medin (1995) A. Medin, Studies on structure and properties of agarose, Ph.D. thesis, Uppsala (1995).
- Arevalo et al. (2015) R. Arevalo, P. Kumar, J. Urbach, and D. Blair, “Stress heterogeneities in sheared type-i collagen networks revealed by boundary stress microscopy,” PLoS ONE 10, e0118021 (2015).
- Sonwai and Mackley (2006) S. Sonwai and M. Mackley, “The effect of shear on the crystallization of cocoa butter,” Journal of the American Oil Chemists’ Society 83, 583–586 (2006).
- Taylor et al. (2009) J. Taylor, I. V. Damme, M. Johns, and A. R. ans D.I. Wilson, “Shear rheology of molten crumb chocolate,” Journal of Food Science 74, 55–61 (2009).
- Habouzit (2012) D. Habouzit, Rhéophysique et stabilité des matériaux hétérogènes solide/liquide à base de corps gras, Ph.D. thesis, Université de Bordeaux I (2012).
- Peixinho et al. (2010) J. Peixinho, P. Karanjkar, J. Lee, and J. Morris, “Rheology of hydrate forming emulsions,” Langmuir 26, 11699–11704 (2010).
- Ahuja, Zylyftari, and Morris (2015) A. Ahuja, G. Zylyftari, and J. Morris, “Yield stress measurements of cyclopentane hydrate slurry,” J. Non-Newtonian Fluid Mech. 220, 116–125 (2015).
- Chambon and Winter (1987) F. Chambon and H. Winter, “Linear viscoelasticity at the gel point of a crosslinking pdms with imbalanced stoichiometry,” J. Rheol. 31, 683–697 (1987).